In a taxable account, taxes quietly trim an 8% stated return to roughly 6.5% to 7.6% a year. Over 30 years on $100,000 that gap is worth $106,000 to $345,000. Tax-advantaged accounts (Roth, traditional, HSA) remove the annual drag, so where you hold an investment can matter almost as much as which one you pick.
Your brokerage statement says 8% return. Your actual wealth grew by something less. The difference is taxes - on dividends throughout the year, on interest payments, on capital gains when you sell. The stated return and the real return are not the same number, and the gap between them is wider than most people assume.
The After-Tax Return Calculator shows what you actually keep. No signup required.
The Return You See vs. The Return You Get
A portfolio earning 8% pre-tax in a taxable account does not deliver 8% to your net worth. Here is why.
Dividends get taxed every year they are paid. A 2% dividend yield taxed at the 15% qualified rate creates 0.30% in annual drag. Bond interest, if you hold any, is taxed at ordinary income rates, so a 3% yield in the 24% bracket costs 0.72% per year in taxes. Add in some portfolio turnover generating realized capital gains, and the total annual drag lands between 0.4% and 1.5% for most portfolios.
That turns an 8% pre-tax return into something between 6.5% and 7.6% after taxes. Over a short period, the difference barely registers. Over 30 years on $100,000:
- 8.0% return (tax-free account): $1,006,266
- 7.6% return (modest tax drag): $900,260
- 6.5% return (heavier tax drag): $661,437
The tax drag costs between $106,000 and $345,000 on a single $100,000 investment. No fee disclosure document, no line item on a statement - just a quieter portfolio than it could have been.
Why Account Type Matters So Much
The same investment behaves differently depending on which account holds it. This is one of the most consequential and least discussed aspects of personal investing.
Roth IRA or Roth 401(k). No tax on dividends, no tax on gains, no tax on withdrawals. An 8% return is an 8% return. The stated number and the real number are identical. This is why Roth accounts are so valuable - every dollar of growth is yours.
Traditional 401(k) or IRA. No annual tax on dividends or gains - the full amount compounds every year. But withdrawals in retirement are taxed as ordinary income. If your effective tax rate in retirement is 22%, a portfolio worth $68,485 delivers $53,418 after the tax bill. The deferral helps enormously during accumulation, but the taxes arrive eventually.
Taxable brokerage. Dividends taxed annually, capital gains taxed on sale, and the compound drag accumulates year after year. This is the account type where after-tax return calculations matter most, because it is the only one where taxes actively erode growth during the accumulation phase.
HSA (Health Savings Account). Contributions are tax-deductible, growth is tax-free, and withdrawals for qualified medical expenses are tax-free. Triple tax advantage. After age 65, HSA withdrawals for non-medical expenses are taxed as ordinary income (similar to a traditional IRA) but with no penalty. For people who can cover current medical costs out of pocket and let the HSA grow, it is the most tax-efficient account available.
Where You Put Things Matters
Owning the same investments but rearranging which account holds each one can improve after-tax returns by 0.3% to 0.75% annually - without changing risk, without picking different funds, without timing the market. This is called asset location.
The principle is simple: put the most tax-inefficient investments in accounts where taxes do not apply.
Bonds generate interest taxed at ordinary rates, which makes a 401(k) or IRA their natural home, where those rates do not bite during accumulation. REITs distribute most income as non-qualified dividends, so the same shelter suits them. Actively managed funds with high turnover throw off frequent capital gains distributions, another candidate for a tax-advantaged account.
Index funds, growth stocks, and tax-managed funds generate minimal annual tax events, so they sit comfortably in a taxable account. Their low dividends and minimal turnover create little drag.
The overall portfolio looks the same. The same allocation, the same risk level, the same expected return on a pre-tax basis. But the after-tax return improves because the investments generating the most taxable income are sheltered from annual taxes.
The Practical Priority Order
For most people, the single biggest improvement to after-tax returns comes from maximizing tax-advantaged account contributions before investing in taxable accounts.
The often-cited sequence: contribute enough to a 401(k) to capture the full employer match (that is an instant 50-100% return on the matched amount). Then max out a Roth IRA or traditional IRA. Then max out the remaining 401(k) space. Then, and only then, invest additional savings in a taxable brokerage account.
Each step up this ladder improves the after-tax return on the money invested. The employer match step alone can be worth more than years of careful tax optimization on the rest of the portfolio.
The Number Nobody Tracks
Most investors know their portfolio’s return. Very few know their after-tax return. This is partly because brokerage statements do not report it, partly because the calculation requires knowing tax rates and dividend classifications, and partly because people prefer not to think about it.
But after-tax return is the real return. It is what you actually keep. An investor earning 8% in a taxable account and paying 1.2% in annual tax drag is effectively earning 6.8%. All financial planning - retirement projections, savings rate calculations, goal timelines - is more accurate when it uses the after-tax number. Using the pre-tax number feels better but plans worse.
The gap between what people think they earn and what they actually keep is one of the quieter miscalculations in personal finance. Closing that gap starts with knowing the after-tax number.
The Financial Planning Template lists each holding with its value, annual yield and annual growth rate, then projects assets and debt forward to a chosen end year. The projection runs on the growth and yield assumptions you set, so it does not model tax drag on its own.
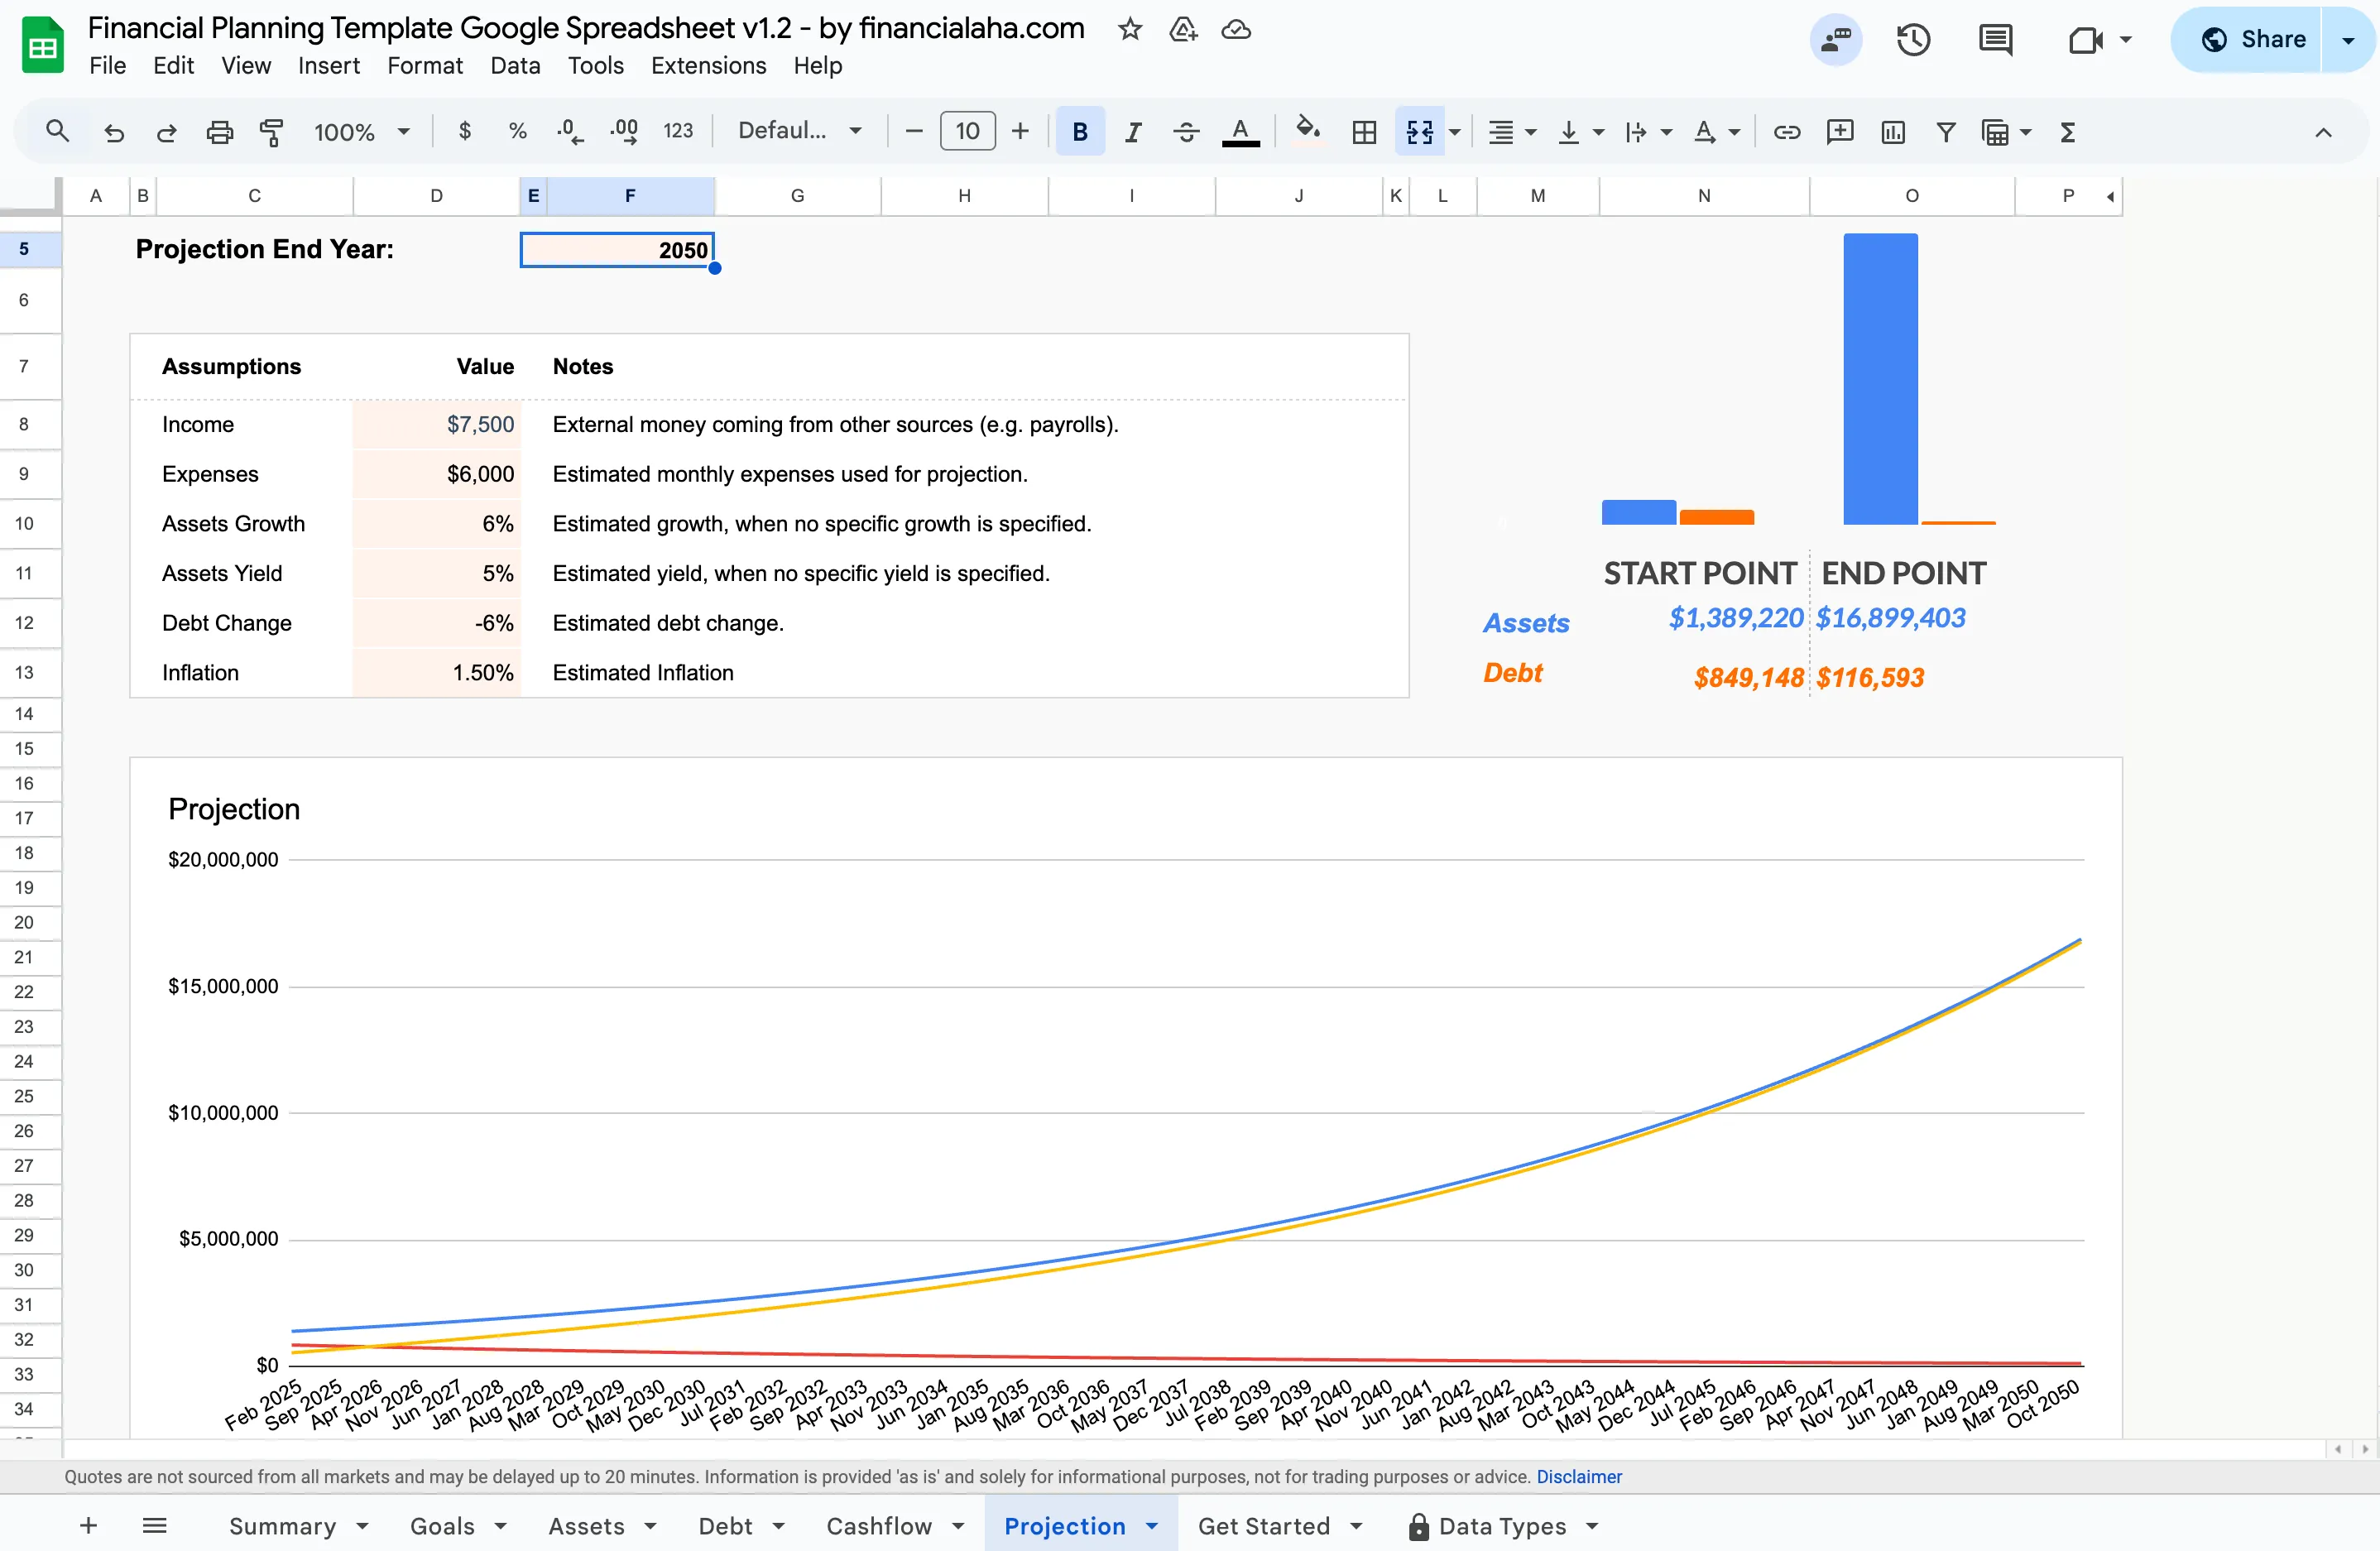 The Financial Planning Template (Premium tier) projects assets and debt forward from a set of growth and yield assumptions.
The Annual Tax Planner Template logs income by type through the year, with Capital Gains, Dividends and Interest as separate lines on the Dashboard, each taking a tax rate you enter.
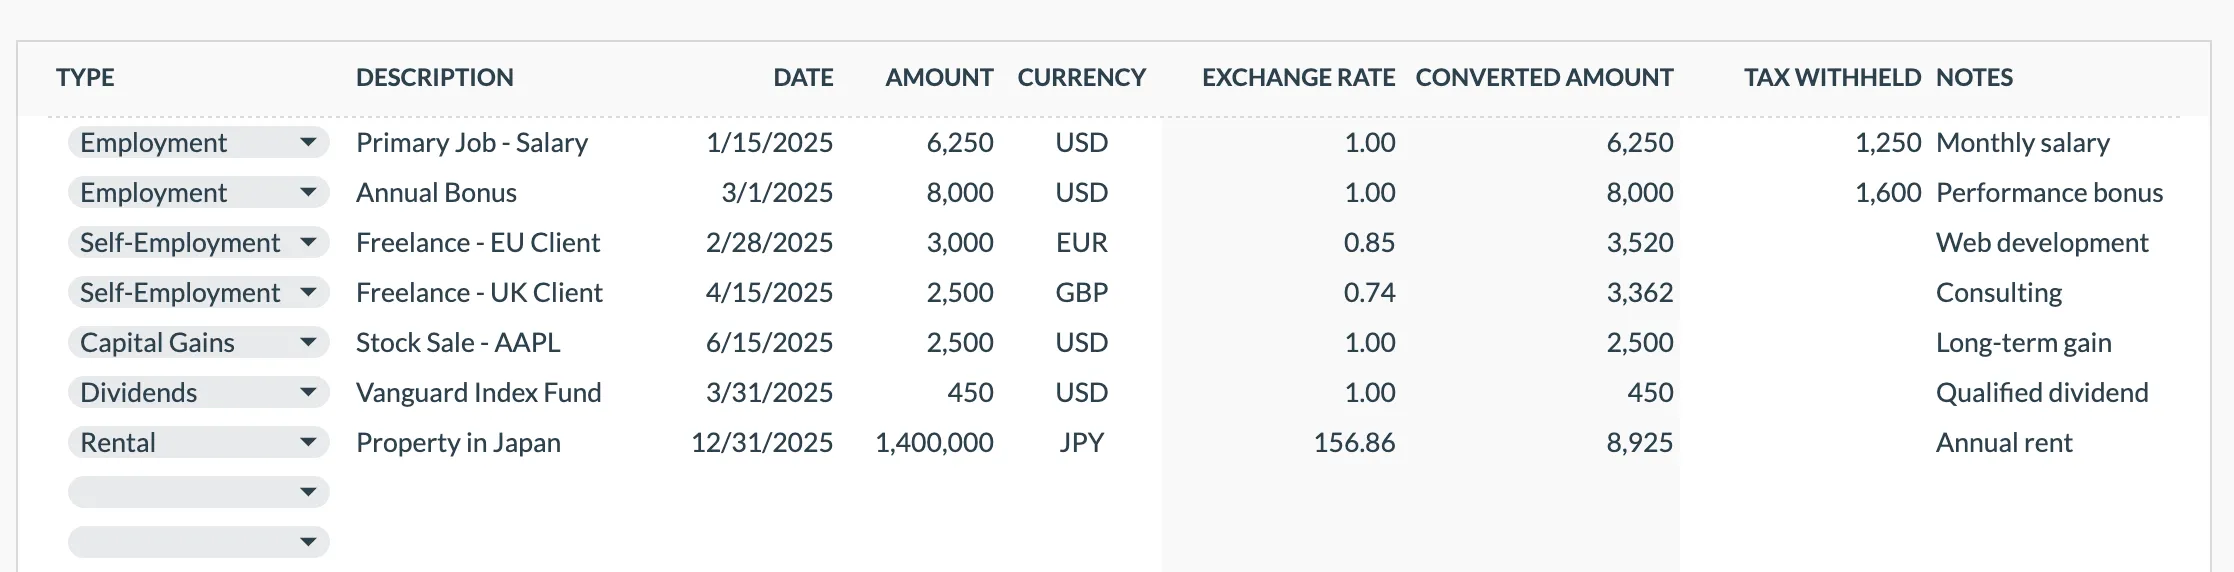 The Annual Tax Planner Template (Premium tier) separates dividends, capital gains, and other income so each type can carry its own tax rate.
Tax-Aware Investing Guides
- 401(k) Calculator: Maximizing Contributions - How the employer match and contribution limits compound
- Investment Returns Calculator: What to Expect - Setting a realistic pre-tax return assumption
- Capital Gains Tax Calculator - What selling investments costs in taxes
Related
Frequently asked questions
What's the difference between pre-tax and after-tax returns?
Pre-tax return is the investment's growth before taxes. After-tax return subtracts taxes on dividends, interest, and capital gains. The gap can be 1-2% annually in taxable accounts.
How do tax-advantaged accounts improve returns?
Traditional accounts defer taxes until withdrawal. Roth accounts eliminate taxes on growth entirely. Both allow full compounding without annual tax drag, which can add 20-30% more to the final balance over decades.
Does asset location really matter?
Yes. Placing tax-inefficient investments (bonds, REITs) in tax-advantaged accounts and tax-efficient investments (index funds, growth stocks) in taxable accounts can add 0.3-0.75% in after-tax returns annually.
Do I owe tax on gains I haven't sold yet?
No. Capital gains are taxed only when you sell and realize them. Dividends and interest are taxed in the year they are paid, but price appreciation you have not sold sits untaxed until a sale. That is part of why buy-and-hold index funds carry less annual drag than frequently traded funds.
Do state taxes change the after-tax return too?
The worked figures in this article reflect federal tax only. The calculator has a separate state tax rate field for adding your own. States that tax dividends, interest, and capital gains widen the drag, while the handful with no income tax leave the federal number unchanged. Worth checking your own state's treatment before relying on a single after-tax figure.
Sources
- Topic no. 409, Capital gains and losses - Internal Revenue Service
- Topic no. 404, Dividends - Internal Revenue Service
- Publication 969, Health Savings Accounts and Other Tax-Favored Health Plans - Internal Revenue Service
About this article
Growth figures compound $100,000 at 6.5%, 7.6%, and 8% over 30 years. Dividend, capital-gains, and HSA tax treatment checked against IRS Topic 409, Topic 404, and Publication 969. Calculator and template claims checked on 2026-09-10 against the After-Tax Return Calculator component and the shipped Financial Planning (Assets, Projection) and Annual Tax Planner (Dashboard, Income) sheets. Last reviewed September 2026.