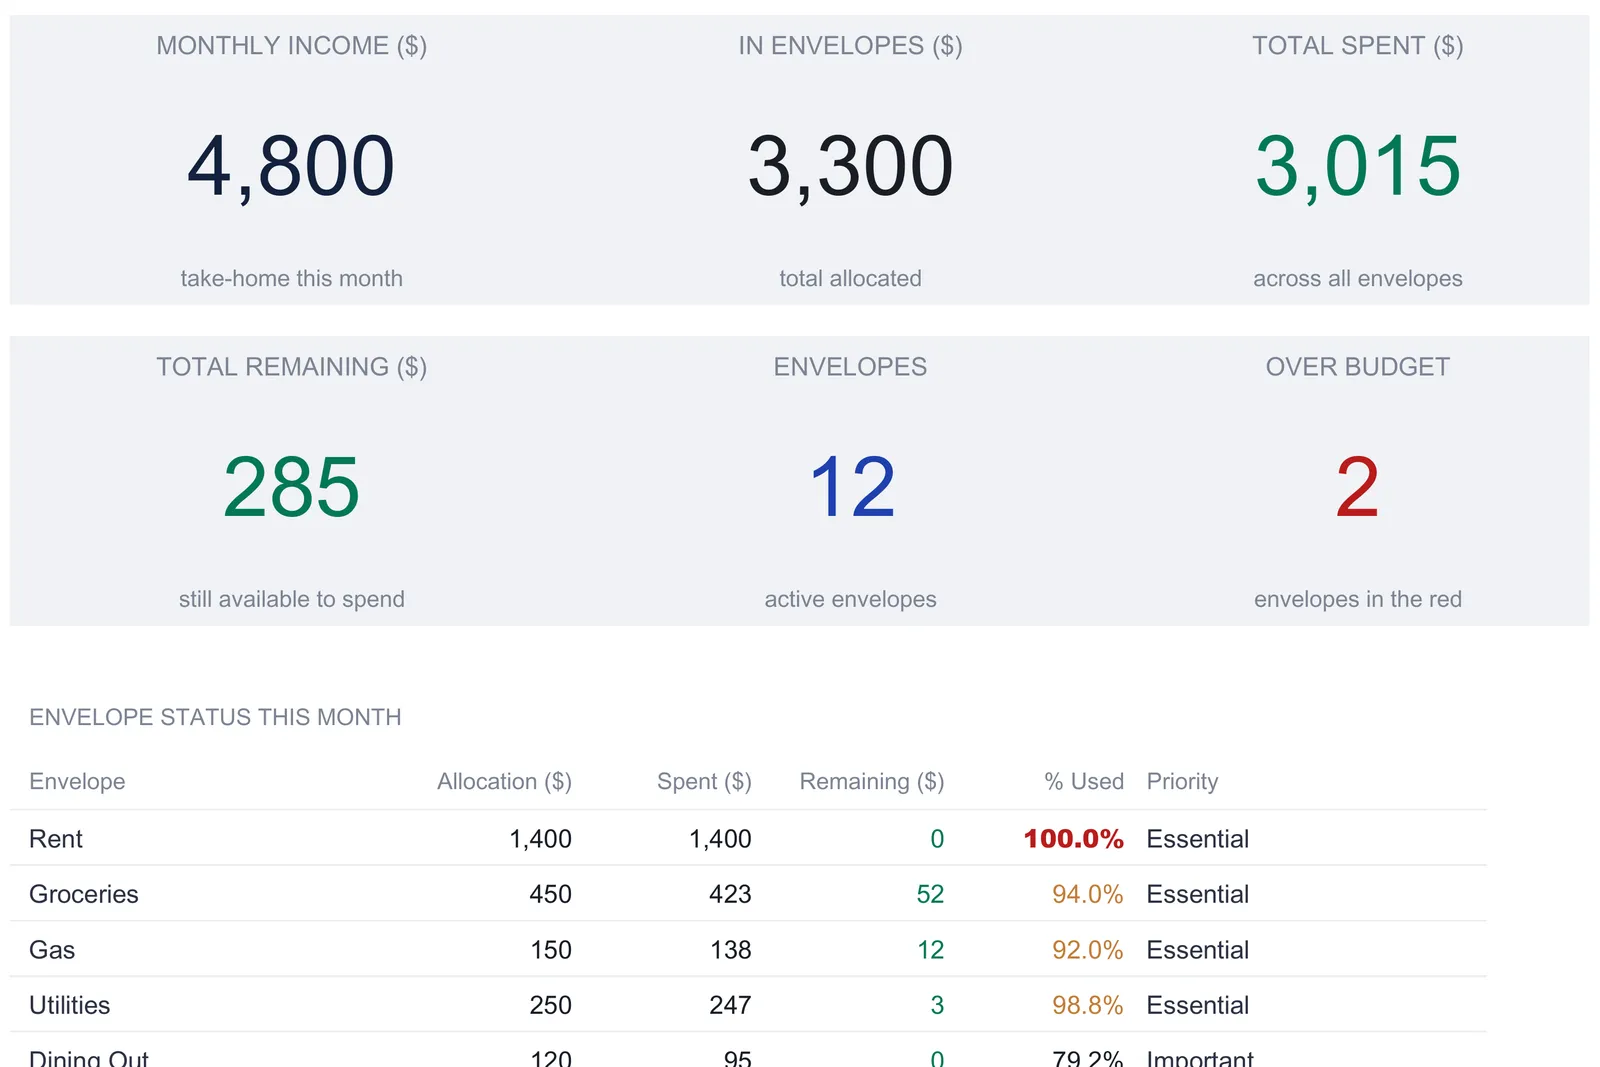
An envelope budget spreadsheet gives each spending category its own envelope with a monthly allocation, then derives the rest: a spending log feeds each envelope by name, remaining balances update as money is spent, and overspent envelopes turn red. This walkthrough follows a worked month with $4,800 of income across 12 envelopes, $3,300 allocated, $3,015 spent, and $285 still in envelopes, including rollover, mid-month transfers, and a 12-month history. The Envelope Budget Ultimate ($29) ships the whole structure for Excel and Google Sheets.
The old cash-envelope method is simple to describe. Divide income into labeled envelopes, one per spending category, and when an envelope is empty, spending in that category stops until the next month. The constraint does the work, because the limit stays visible and tangible. What the paper version cannot do is add up twelve envelopes at once, carry a surplus forward cleanly, or show you which category has quietly run short every month for half a year. That is where a spreadsheet earns its place: it keeps the same envelope-by-envelope discipline while doing the arithmetic.
An envelope budget spreadsheet is four moving parts working together: a setup sheet that names the envelopes and funds each one, a spending log where every transaction is recorded once, a monthly sheet that turns those two into a remaining balance per envelope, and a dashboard that reads the month at a glance. The examples below come from the Envelope Budget Ultimate Spreadsheet Template ($29), which ships this whole structure ready-made for Excel and Google Sheets, using a worked sample month. The same layout is reproducible by hand if you would rather build your own.
What an envelope budget spreadsheet has to hold
Strip the method down and there are only four kinds of data in it:
- The envelopes themselves. A name, a monthly allocation, and a priority for each category. This is the plan, and it is the part you set.
- Transactions. Every purchase, logged once, tagged with the envelope it belongs to. This is the raw material for everything else.
- Per-envelope balances. Starting balance, spent, and remaining for each envelope this month. These are calculated, not typed.
- The summary. Totals, an over-budget count, a spending chart, and a longer history. Also all computed.
The Ultimate workbook gives each of these its own sheet: Envelope Setup, Spending Log, and Monthly Envelopes for the first three, with a Fund Transfers sheet for mid-month adjustments, a 12-Month History for the long view, and a Dashboard on top. A How to Use sheet carries the instructions. The convention throughout is that tinted cells are the ones you fill in and white cells hold formulas, so it is always clear which numbers are yours and which the sheet works out.
Start with the envelopes: the Envelope Setup sheet
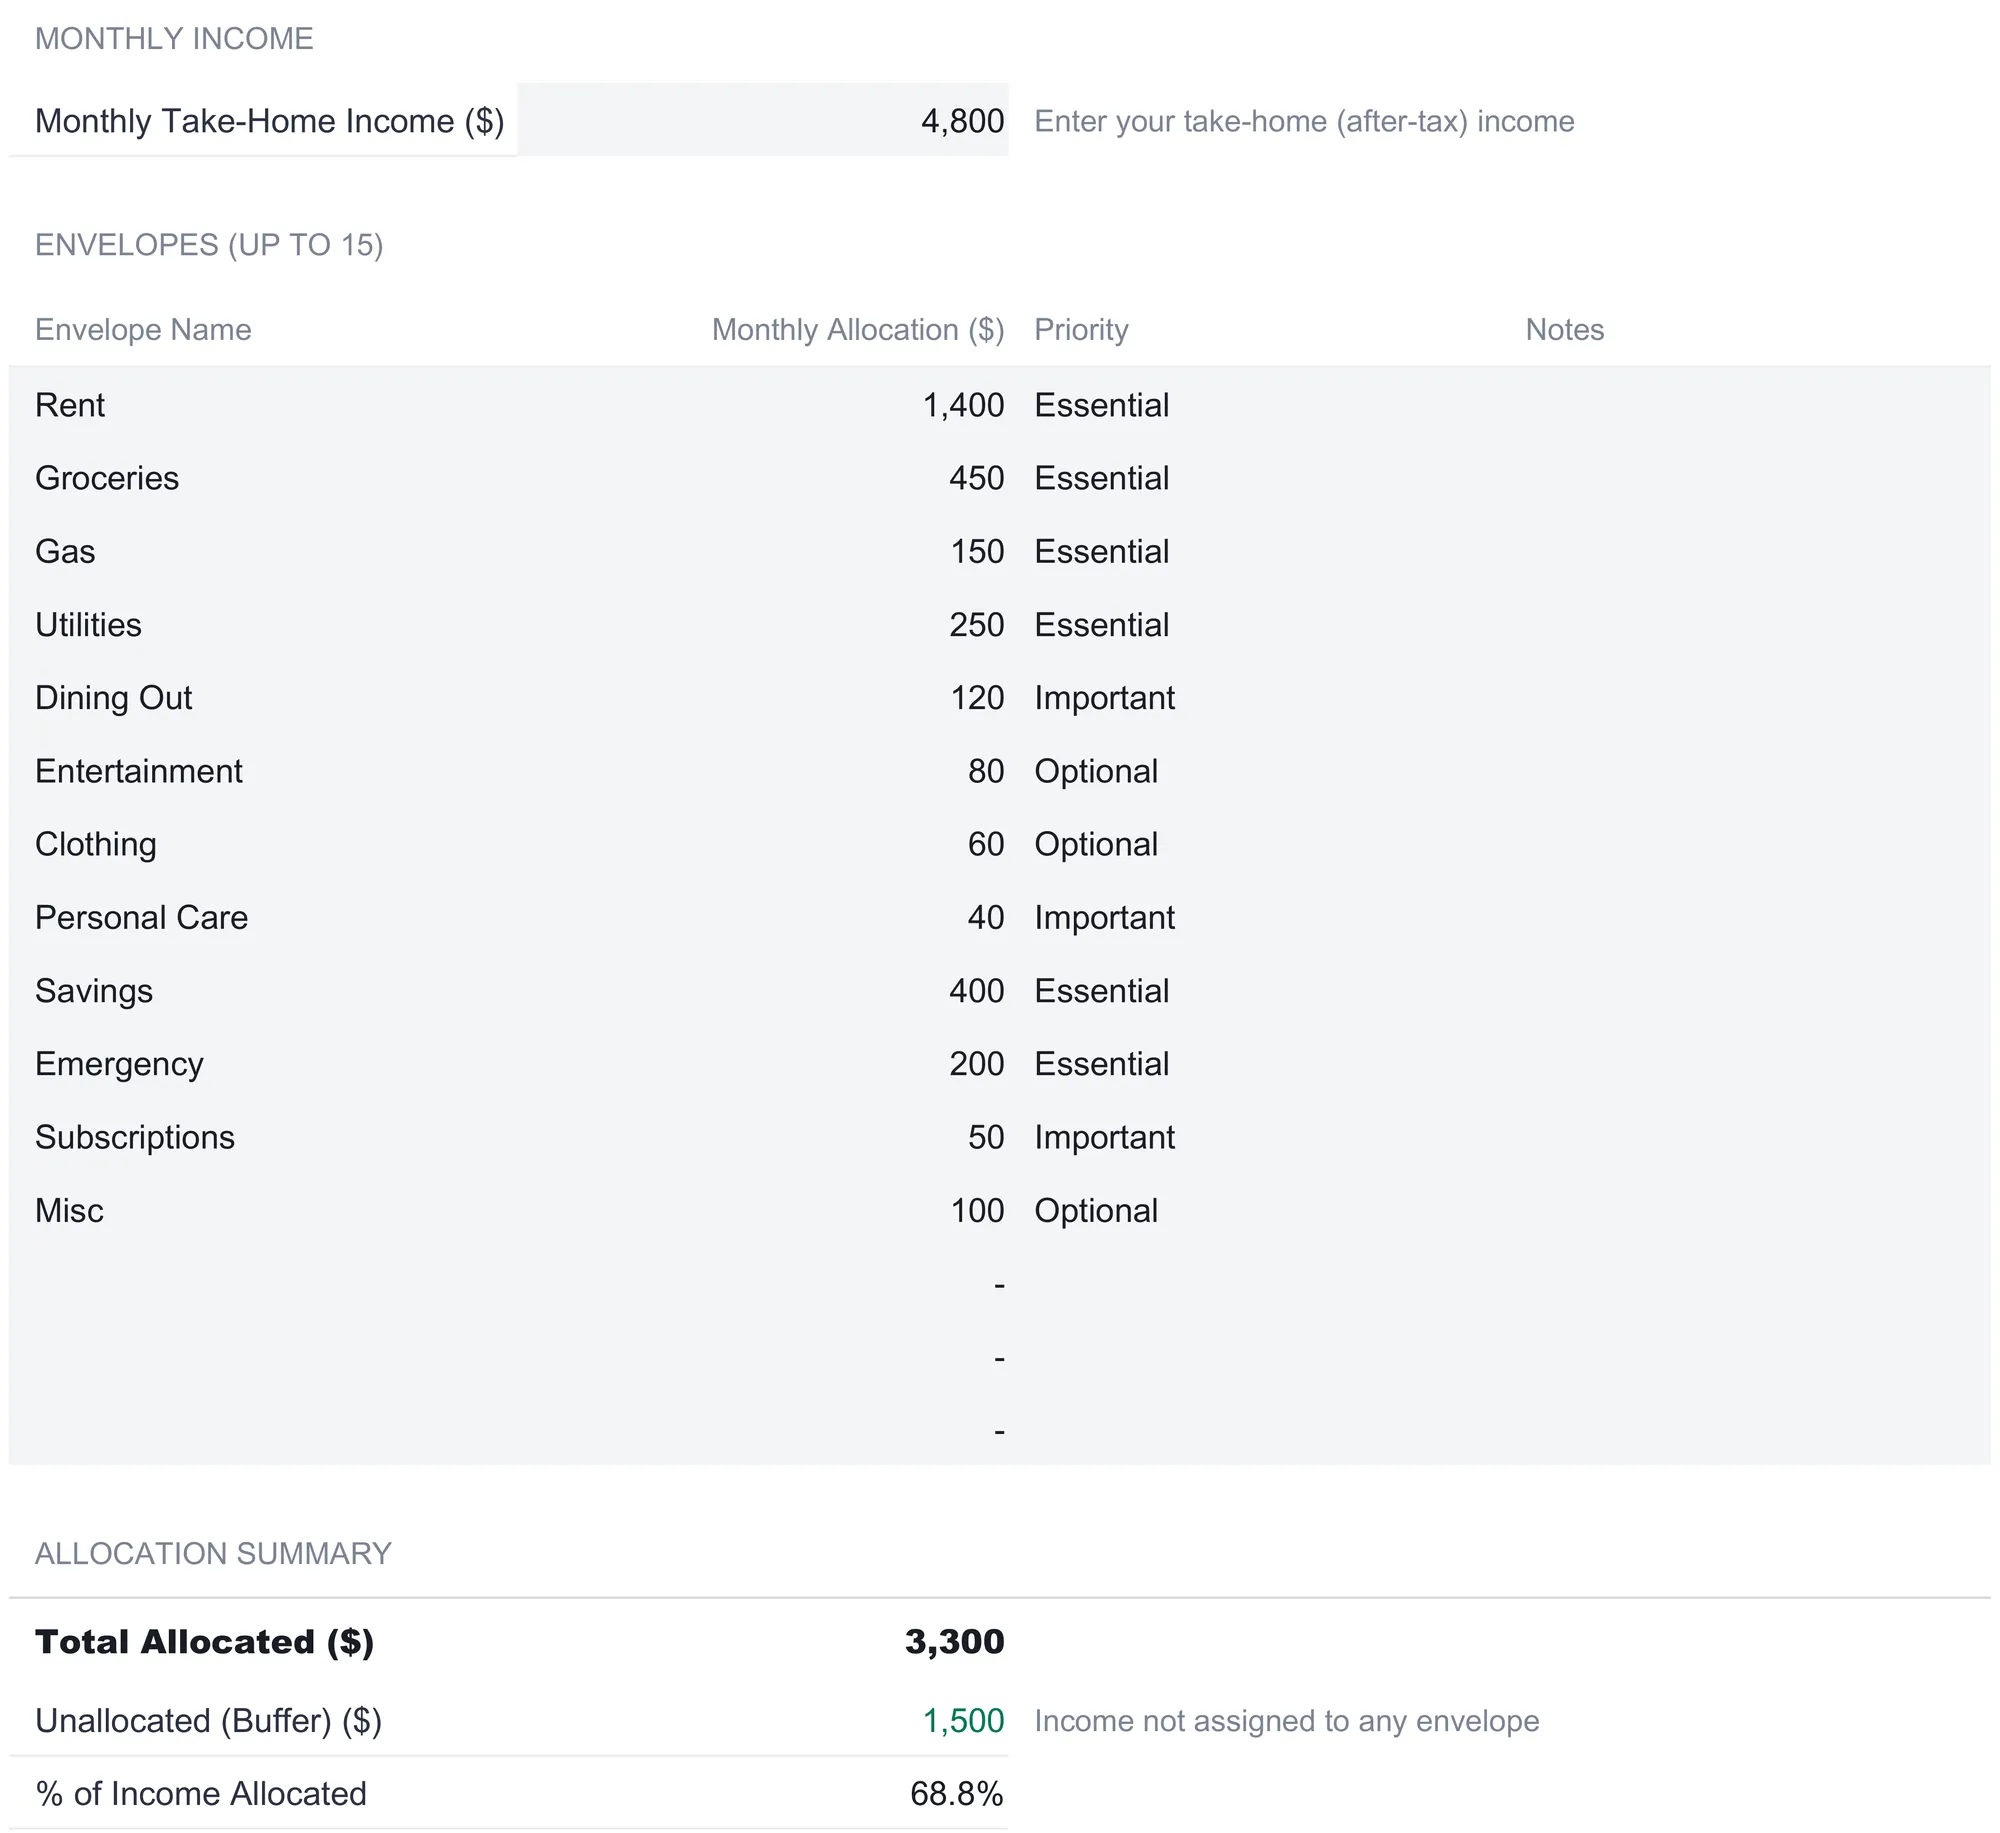
Everything downstream reads from the setup sheet, so it comes first. It opens with a single figure, the monthly take-home income, entered after tax. The sample uses $4,800. Below that sits the envelope list, with room for up to 15 rows. Each envelope gets a name, a monthly allocation, and a priority.
The sample fills 12 envelopes. Rent is funded at $1,400, Groceries at $450, Utilities at $250, Savings at $400, Emergency at $200, and so on down through Gas, Dining Out, Entertainment, Clothing, Personal Care, Subscriptions, and Misc. These names and amounts are all editable inputs, sample values chosen to show the sheet working rather than a prescription for how anyone should split their own income. The point of the exercise is the structure, not the specific numbers.
The priority column carries one of three labels, Essential, Important, or Optional. It does not change any math. It is there so the funding order is visible at a glance, which the workbook’s notes describe as helping decide which envelopes to trim first when spending needs to come down. In the sample, Rent, Groceries, Gas, Utilities, Savings, and Emergency are marked Essential, Dining Out, Personal Care, and Subscriptions are Important, and Entertainment, Clothing, and Misc are Optional.
Three computed figures close the sheet and are worth understanding, because they describe how fully the income has been assigned:
- Total Allocated sums every envelope. In the sample that is $3,300.
- Unallocated (Buffer) is income minus that total, the money not assigned to any envelope. Here it is $1,500, and the sheet labels it a safety net.
- % of Income Allocated is the total over income, which the sheet displays as 68.8 percent. A little over two-thirds of the take-home pay is committed to named envelopes, and the rest sits unassigned.
Log each purchase once: the Spending Log
The Spending Log is the only place a transaction is ever typed. It has room for 100 rows, and each one carries a date, a description, the envelope it belongs to, the amount, a payment method, and an optional note. The sample fills 21 transactions across a month, from Monthly Rent at $1,400 on August 1 down to smaller day-to-day purchases like a $17 Netflix charge, an $11 Spotify charge, and a $271 grocery run flagged in the notes as a big shop.
What makes the log the engine of the whole workbook is the Envelope column. Each Monthly Envelopes row pulls its spending with a SUMIF that adds every logged amount tagged to that envelope name. So the three Subscriptions charges, $17 plus $11 plus $24, roll up to $52 against the Subscriptions envelope automatically. The two grocery trips of $87 and $65 plus the $271 big shop total $423 against Groceries. Nothing is added by hand on the balance sheet; the log does it.
Two design details are worth copying into any hand-built version. First, the envelope names come from a dropdown, which keeps spelling consistent so the SUMIF matches. A transaction tagged to an envelope name that does not exist on the setup sheet would not match any envelope, and the workbook handles that honestly with a Logged but matched to no envelope figure under the monthly totals, spending that was recorded but landed in no envelope. In the sample that figure is zero, because every transaction is tagged to a real envelope. Second, the amount is the actual transaction, not a running total, so each row stands alone and the sheet does the summing.
The remaining two columns, Payment Method and Notes, do no arithmetic, and that is the point of them. Payment Method records how each purchase was paid, cash, debit card, credit card, auto-pay, or bank transfer in the sample, which is useful precisely because envelope budgeting predates cards and a card charge does not empty a physical envelope on its own. Recording the method keeps the digital envelope honest about spending that never touched cash. The Notes column is free text for the small reminders a bank statement never carries, like the sample’s “Weekly shop,” “Big shop,” and “With partner.” Neither column feeds a formula, so both can be left blank without breaking anything.
Because the log ships with all 100 rows already inside the SUMIF ranges, there is nothing to extend when you add a transaction. The next purchase goes on the first free row and every envelope balance updates. There is no formula to drag down and no total to widen, which is the single most common way a hand-built budget quietly breaks, when a new row lands outside the range a total was summing.
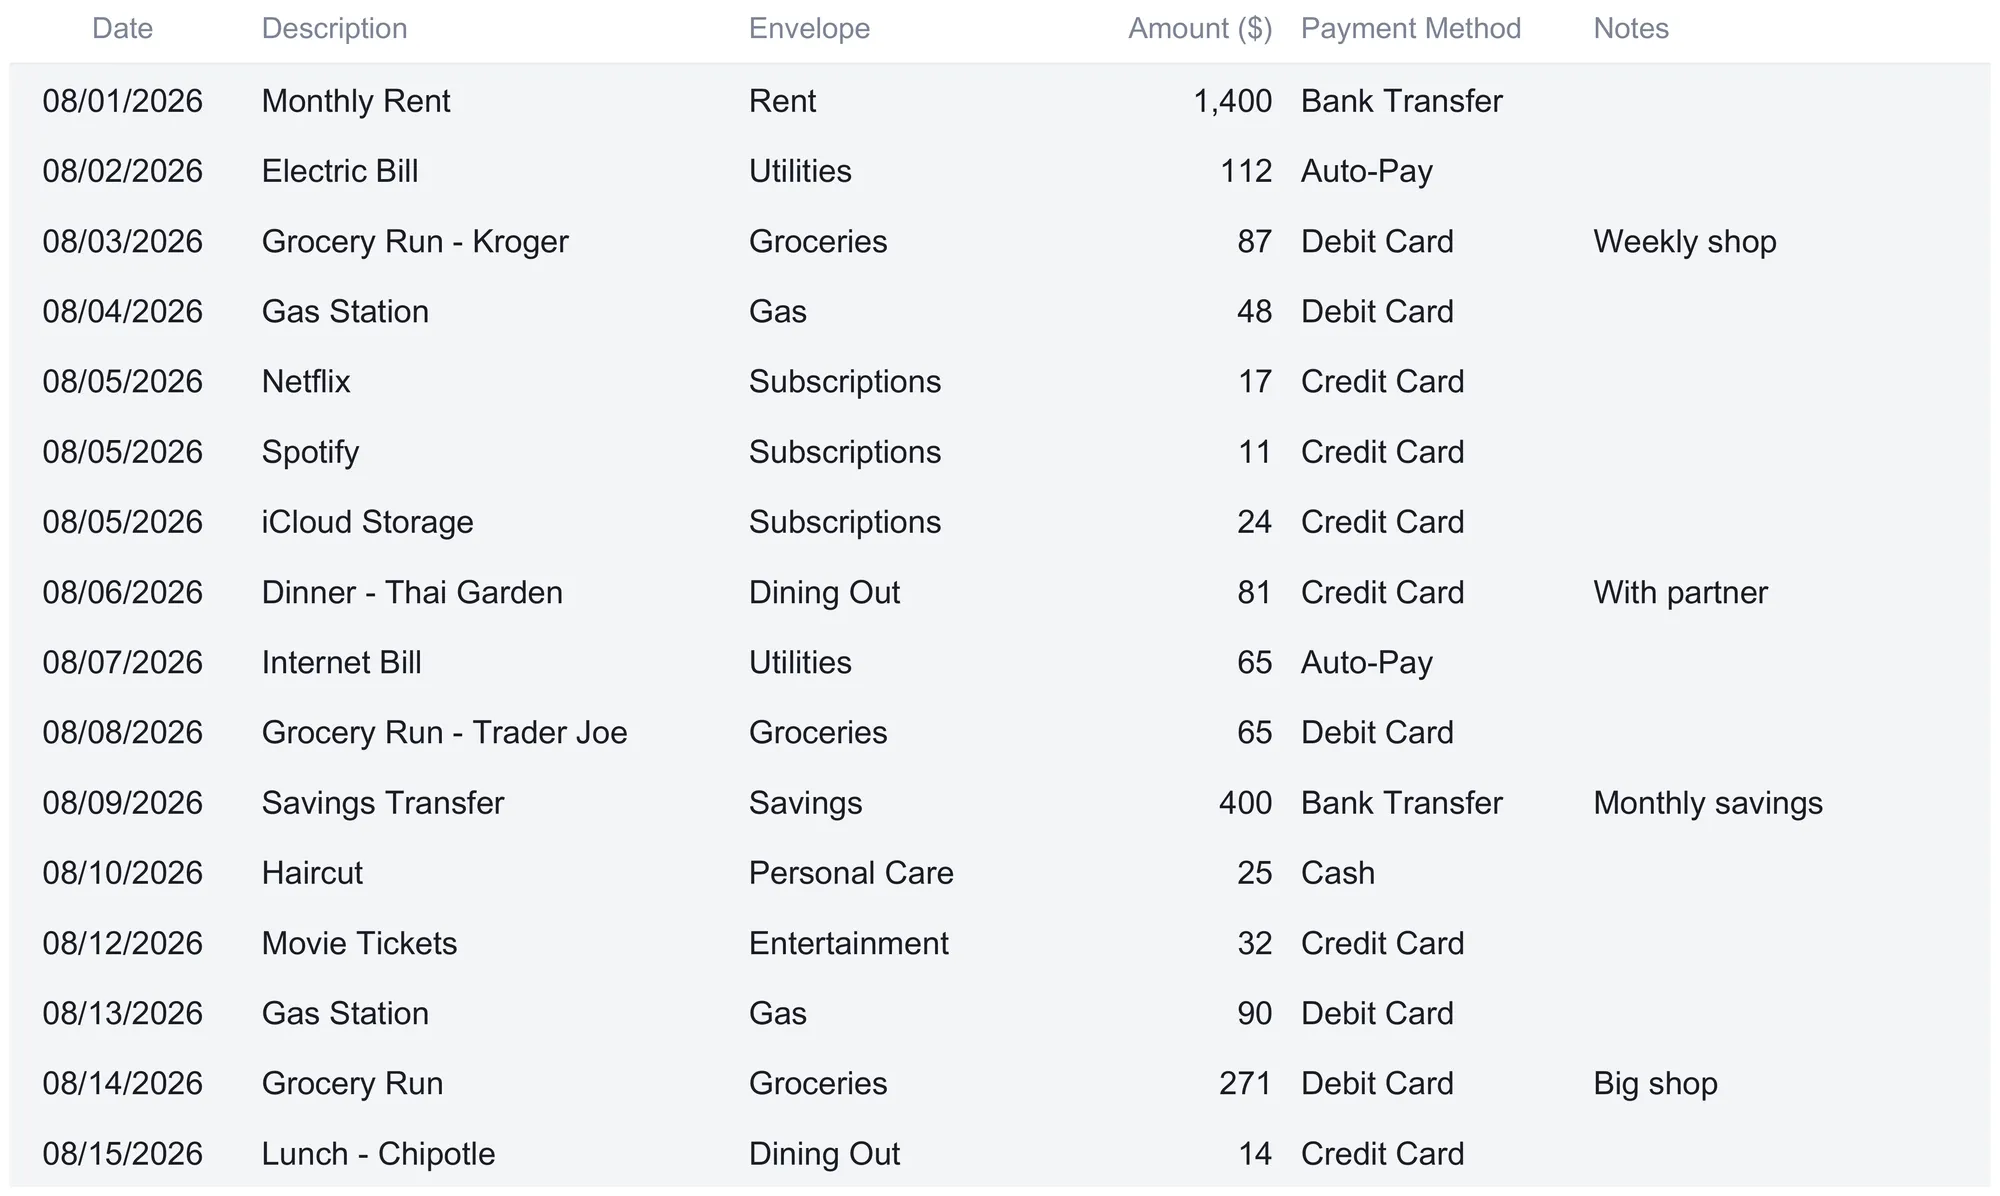
The image above shows the first sixteen of the sample transactions; the log continues below the crop with the remaining five and its total of $3,015 logged for the month.
Watch each envelope fill and empty: the Monthly Envelopes sheet
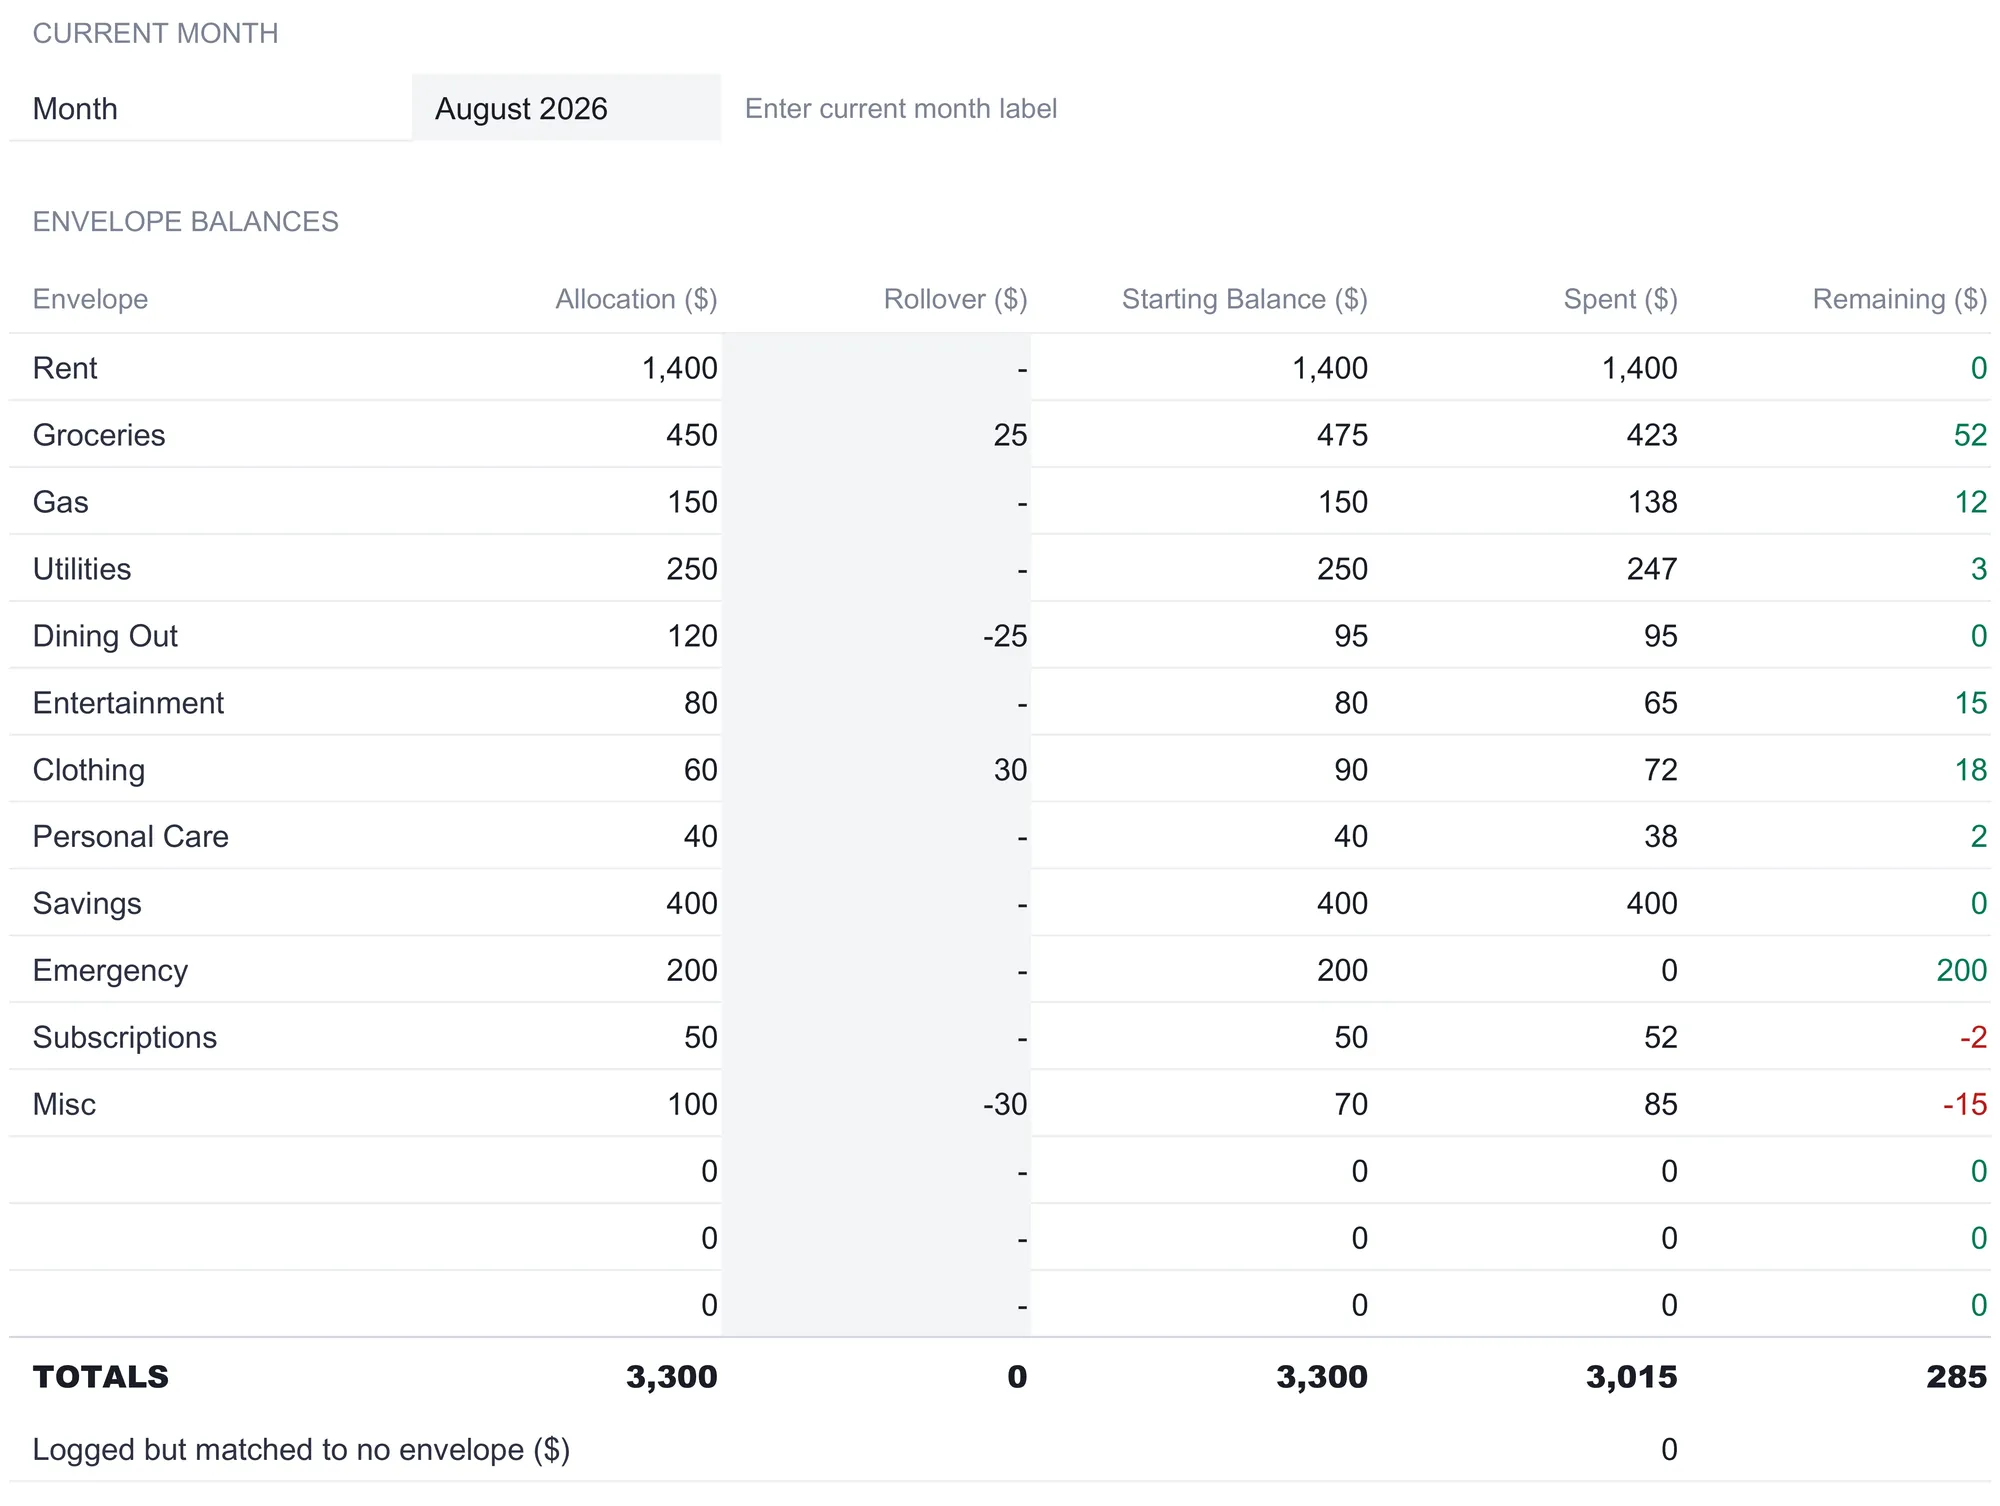
This is where the method becomes visible. Every cell on the Monthly Envelopes sheet is computed except the month label at the top and the rollover column. For each envelope it shows five figures across a row: Allocation, Rollover, Starting Balance, Spent, and Remaining.
The chain is short and worth reading once. Allocation comes straight from the setup sheet. Rollover is the one field you carry in by hand, holding either last month’s surplus or a transfer logged elsewhere. Starting Balance is Allocation plus Rollover. Spent is the SUMIF pulled from the log. Remaining is Starting Balance minus Spent. That last number is the envelope’s current contents, the digital equivalent of looking inside the paper envelope.
The sample month, labeled August 2026, shows the range of what can happen:
- Rent starts and ends exact: $1,400 allocated, $1,400 spent, $0 remaining. The envelope is empty and square.
- Groceries starts at $475 (a $450 allocation plus a $25 rollover), spends $423, and keeps $52.
- Emergency is funded at $200, spends nothing, and holds all $200. An untouched envelope simply carries its full balance.
- Subscriptions is funded at $50 but spends $52, so it finishes at -$2. Misc starts at $70 (a $100 allocation with a -$30 rollover) and spends $85, ending at -$15. Both negatives show in red.
The totals row adds the columns: $3,300 allocated, a net $0 of rollover across all envelopes, $3,300 starting, $3,015 spent, and $285 remaining. That $285 is the money still sitting in envelopes at this point in the month, spread across the categories that came in under. The rollover column nets to zero here because the two sample transfers cancel out across the whole sheet: $25 and $30 leave two envelopes, and the same amounts land in two others. A transfer moves money between envelopes without changing the total in the system.
Only the month label at the top and the rollover figures are yours to type; everything else on the sheet is a formula. The blank rows below the twelve named envelopes carry the same formulas but sit at zero, so an unused envelope contributes nothing to the totals until it is named on the setup sheet. Updating the month label at the start of a new period, and carrying any surpluses or transfers into the rollover column, is the whole of the monthly upkeep here.
Move money between envelopes: the Fund Transfers sheet
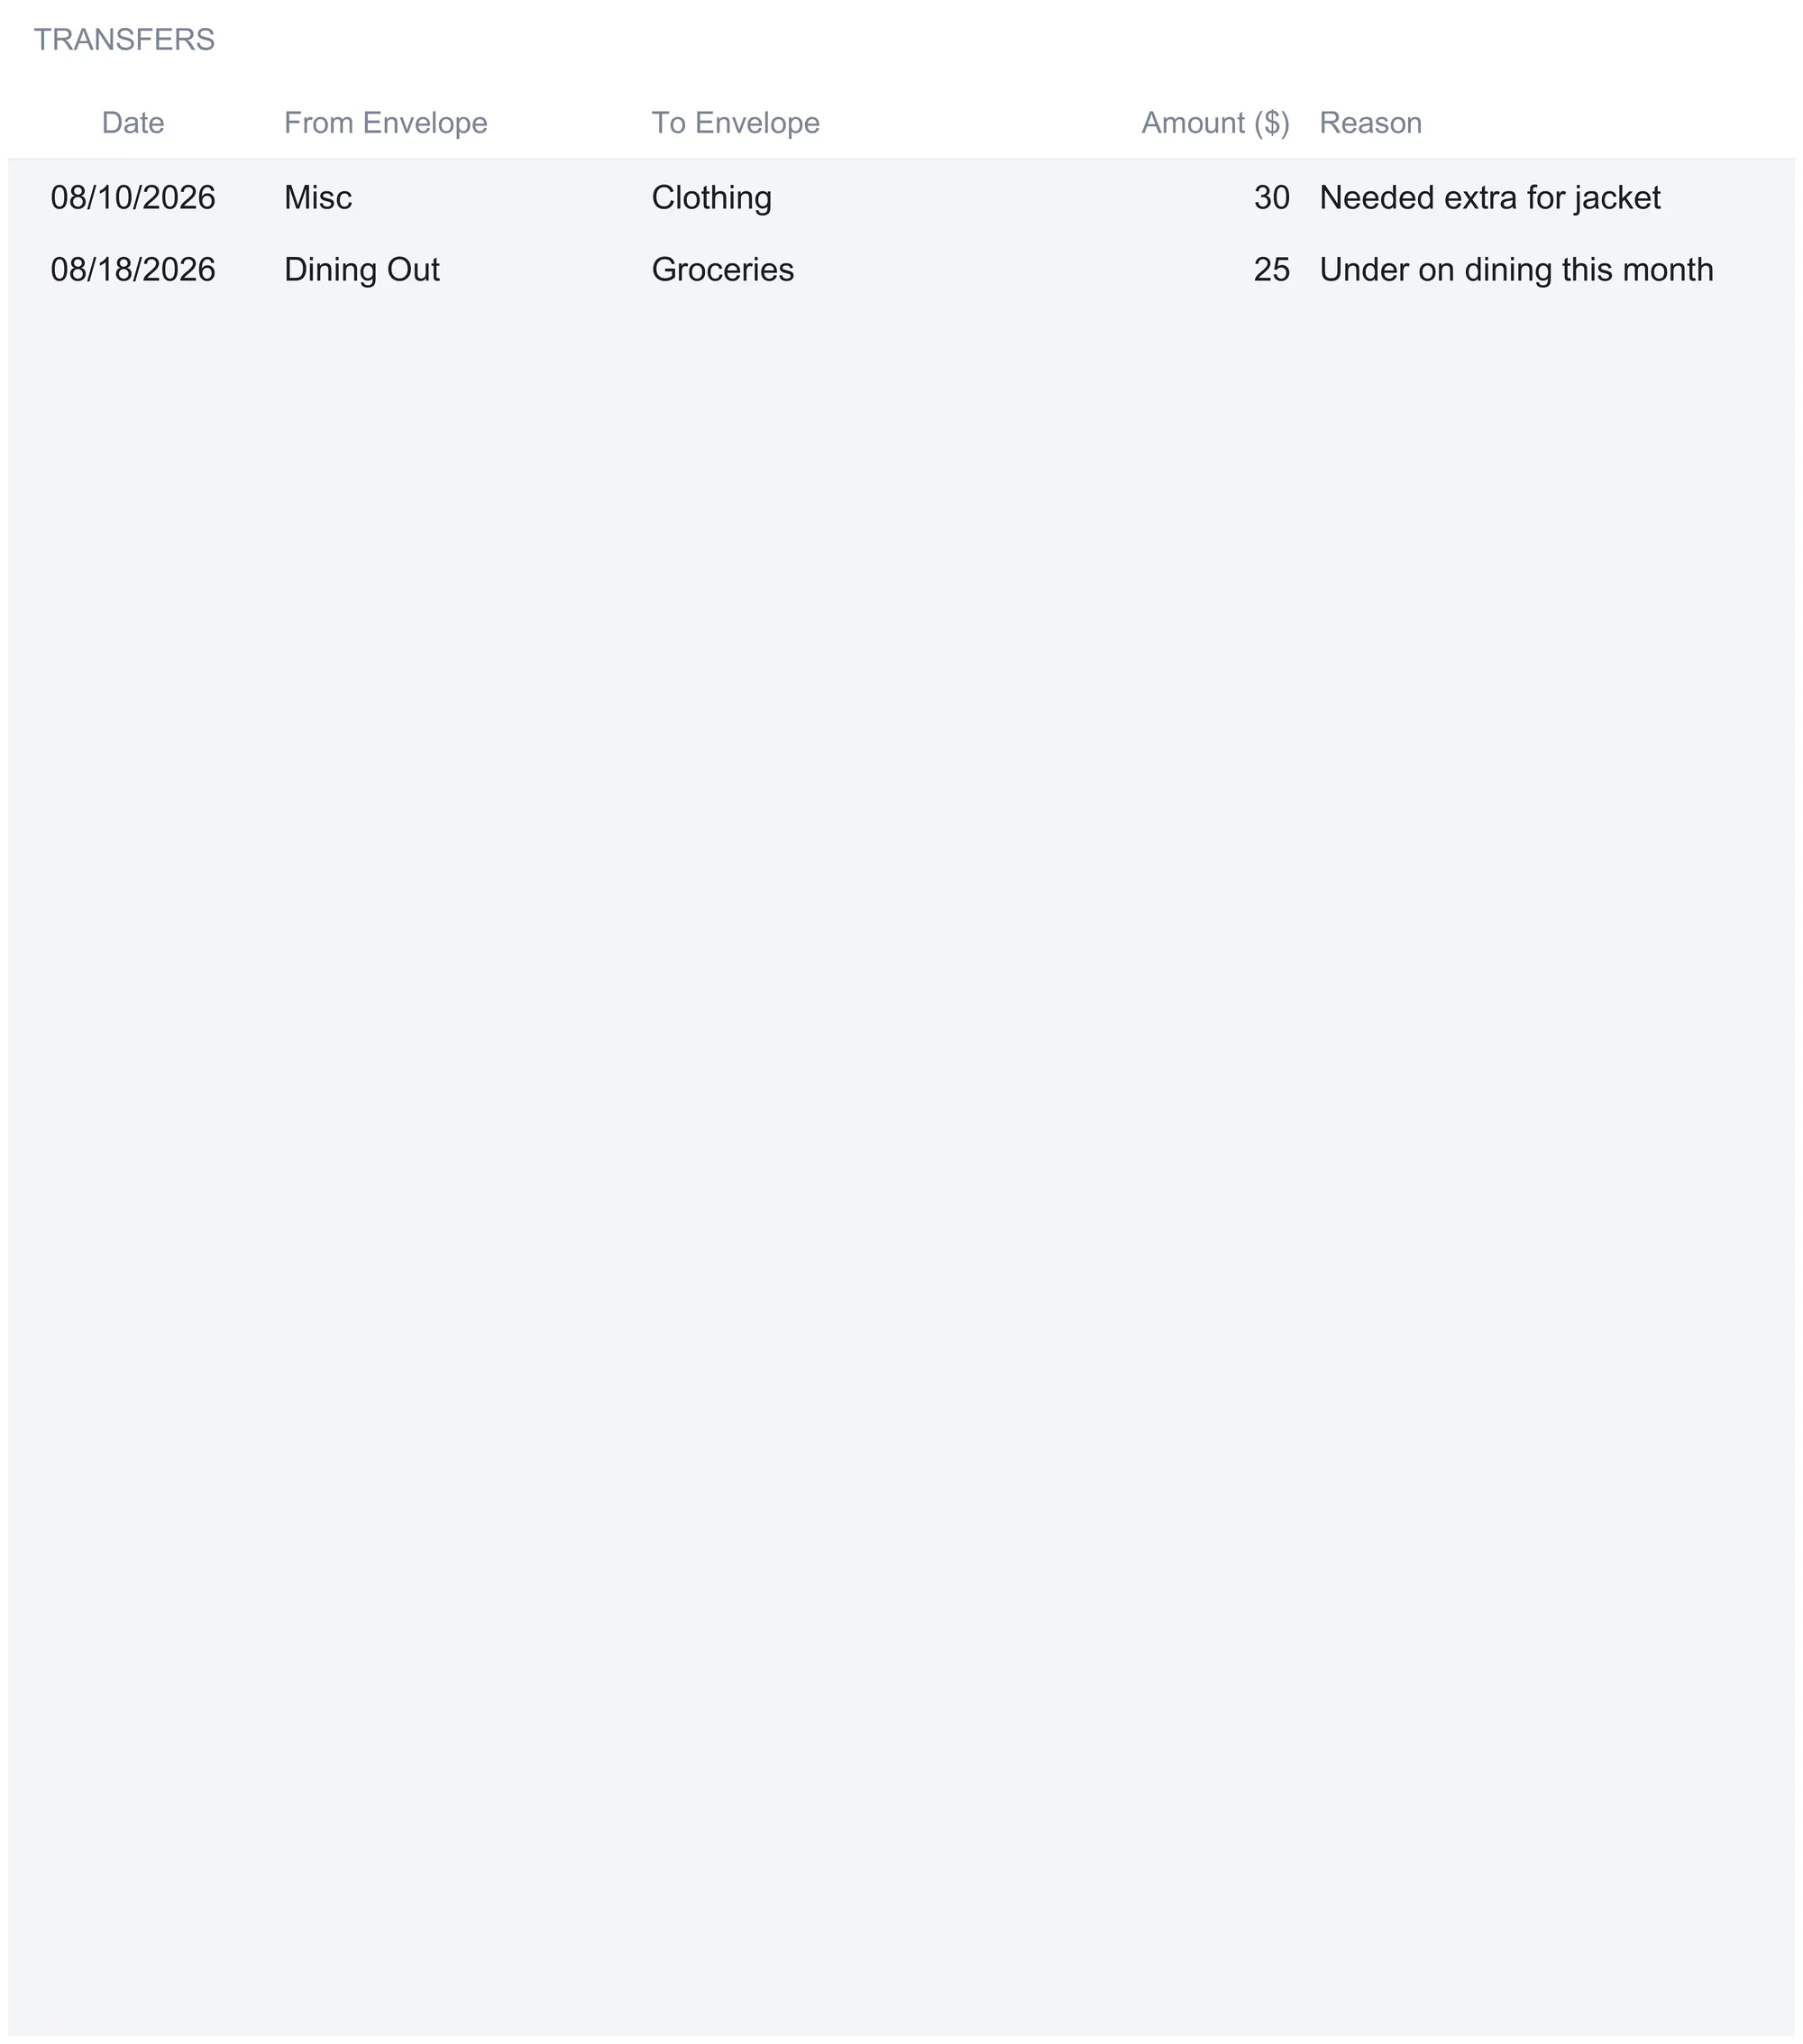
Cash envelope budgeters have always shifted bills from one envelope to another when a category runs short. The Fund Transfers sheet records that same move in a form the workbook can total. Each row logs a date, the envelope the money left, the envelope it went to, the amount, and a short reason.
The sample logs two transfers. On August 10, $30 moves from Misc to Clothing, with the reason “Needed extra for jacket.” On August 18, $25 moves from Dining Out to Groceries, noted as “Under on dining this month.” A summary below sums transfers per envelope into a net figure, so Clothing shows plus $30 and Groceries plus $25, while Misc shows minus $30 and Dining Out minus $25.
One mechanical point matters here, and the workbook is explicit about it: the transfer log does not change the Monthly Envelopes sheet on its own. Logging a transfer is a record, not a live link. To make it count, the net figure is carried into that envelope’s Rollover on the Monthly Envelopes sheet. That is exactly what the sample does, which is why Clothing carries a +$30 rollover, Groceries +$25, Misc -$30, and Dining Out -$25, matching the transfers one for one. Keeping the transfer as a deliberate two-step, log it here and carry the net over there, means the monthly balances never move without a reason you can point to.
Read the year, not just the month: the 12-Month History
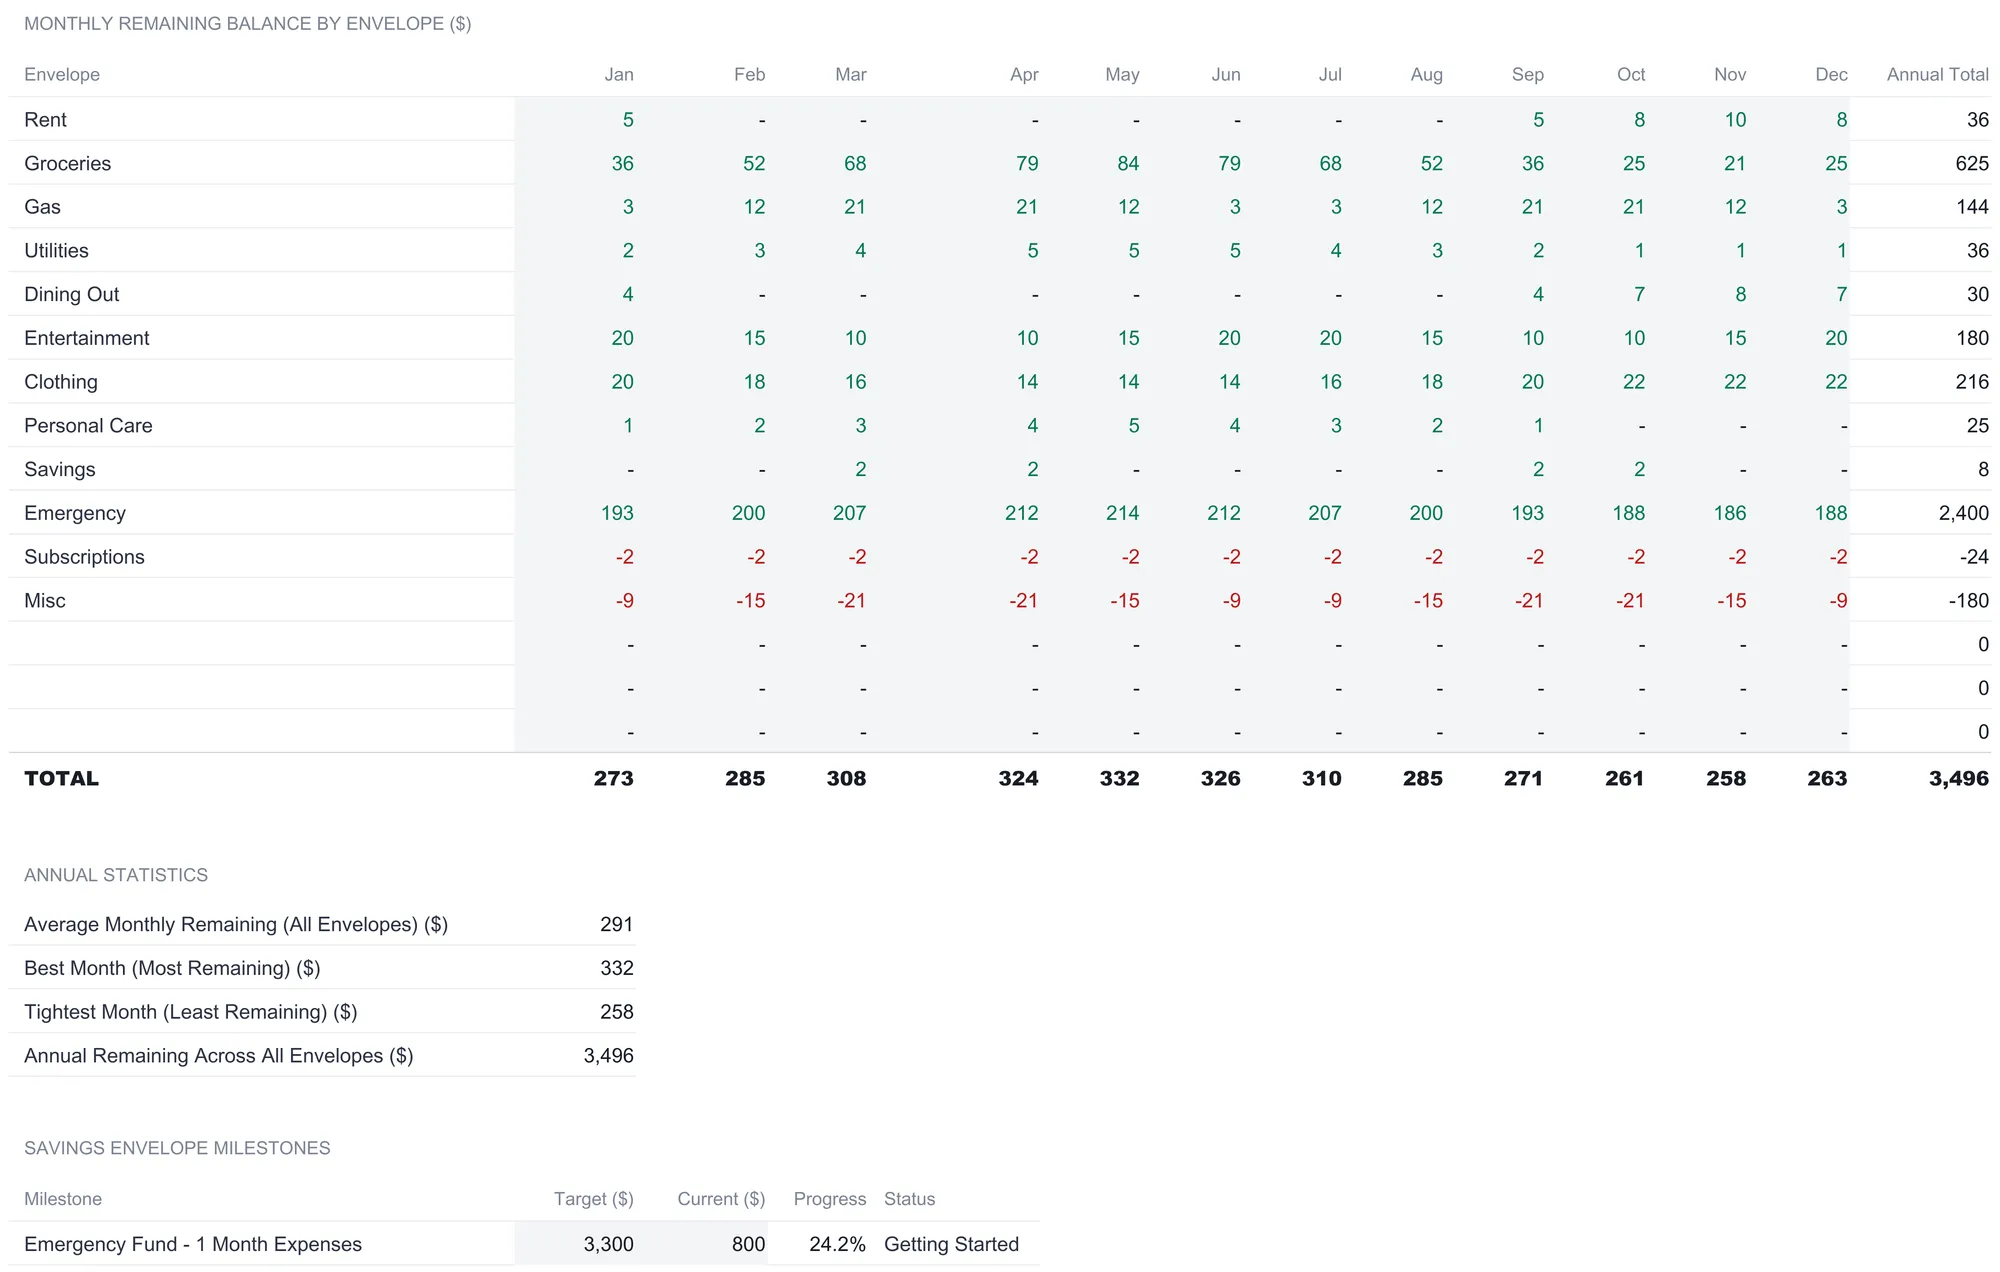
A single month tells you where the envelopes stand now. The 12-Month History is where a pattern shows itself. It holds the remaining balance for each envelope across all twelve months, January through December, and the values are yours to edit as each month closes, so the sheet becomes a running record rather than a live calculation.
The sample fills a plausible year, and reading down a row is instructive in a way a single month cannot be. The Subscriptions row sits at -$2 every month, the mark of an envelope funded a couple of dollars short all year. The Misc row runs negative across the board. Groceries and Emergency, by contrast, stay comfortably positive most months. This is the sheet the workbook’s notes point to for spotting an envelope that runs short month after month. A chronically underfunded category looks fine in any one month and obvious across twelve.
Below the grid, a set of computed annual statistics reads the whole table. In the sample they land at an average monthly remaining of about $291 across all envelopes, a best month of $332, a tightest month of $258, and $3,496 of remaining balance summed across the full year. A savings-milestones block tracks progress toward emergency-fund and savings targets. A one-month-expenses emergency fund of $3,300 sits at $800 saved, roughly 24 percent of the way, and a $1,000 savings buffer shows at $500, or halfway. Each carries a plain status like Getting Started or In Progress. These targets and current balances are sample inputs too, there to show the milestone tracker working.
The dashboard: six numbers and two charts
With the setup, log, and monthly sheet filled, the Dashboard reads the month back in six KPI tiles:
| KPI | Sample value | What it means |
|---|---|---|
| Monthly Income | $4,800 | Take-home this month, from setup |
| In Envelopes | $3,300 | Total allocated across all envelopes |
| Total Spent | $3,015 | Sum of every envelope’s spending |
| Total Remaining | $285 | Still available to spend across envelopes |
| Envelopes | 12 | Count of active, named envelopes |
| Over Budget | 2 | Envelopes finishing in the red |
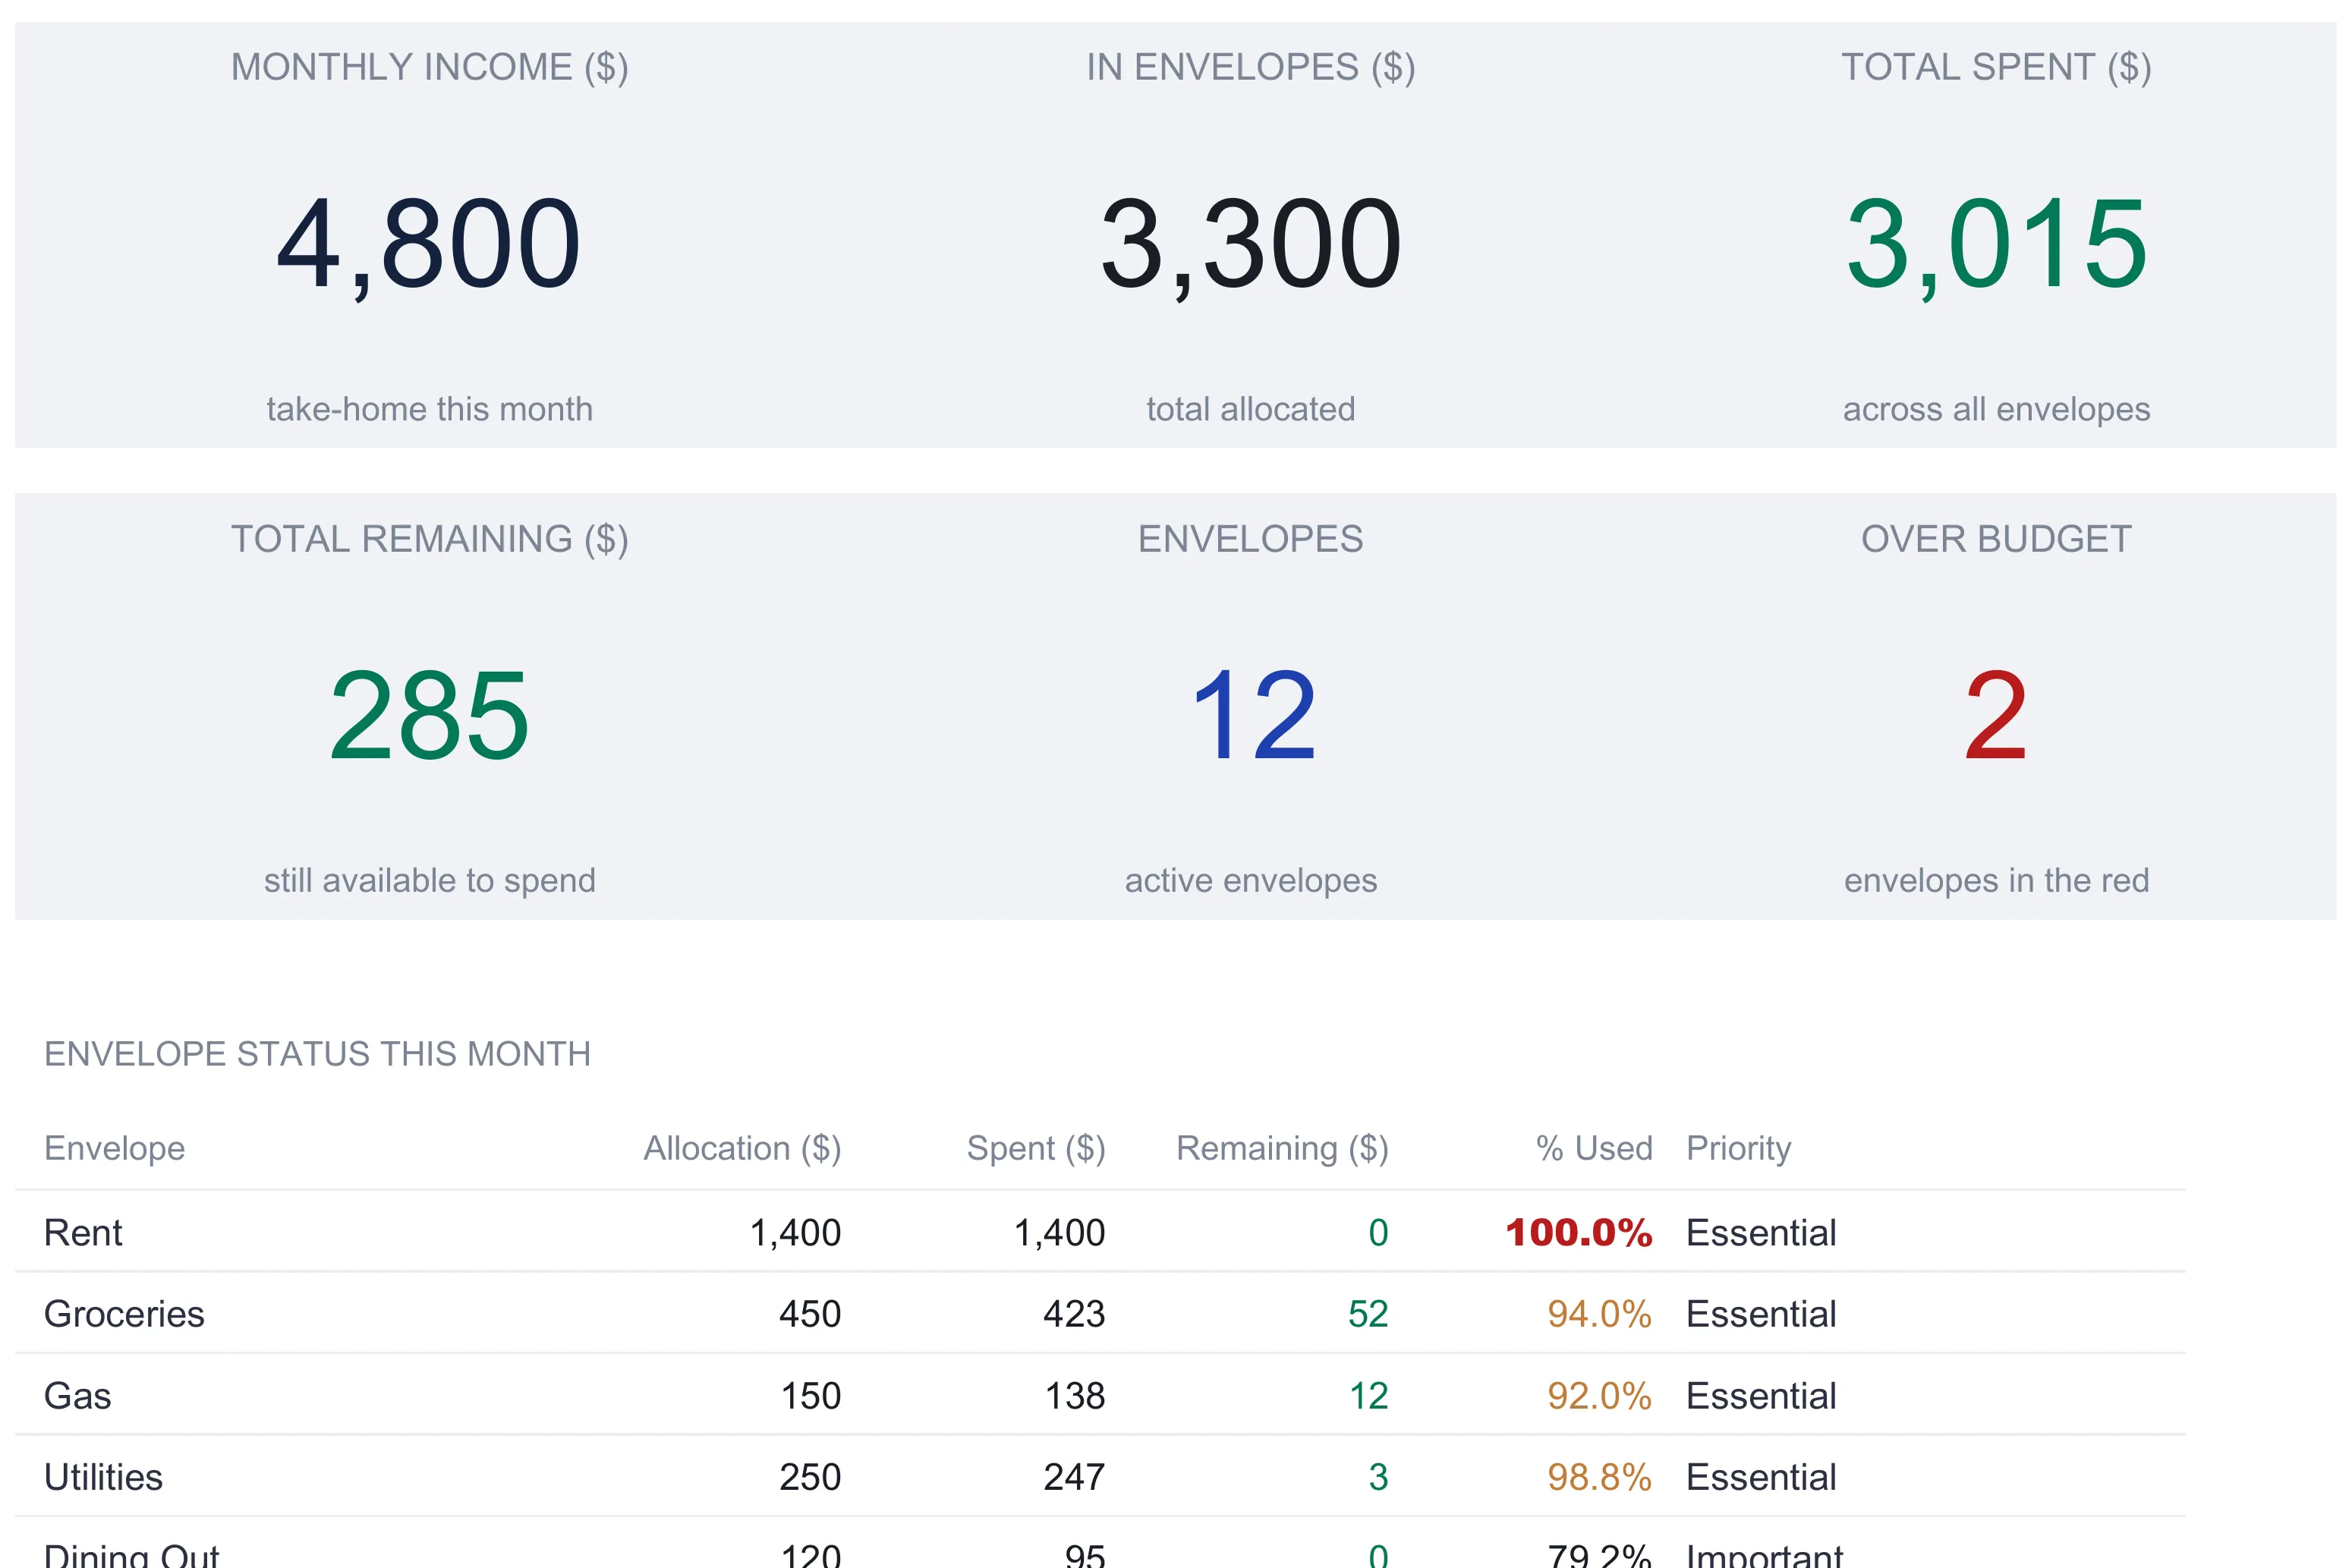
Below the tiles, an Envelope Status table lists every envelope with its allocation, spent, remaining, percent used, and priority. The percent-used column is color-coded: it turns amber at 80 percent and red at 100 percent or more, so an envelope filling up draws the eye before it overflows. In the sample, several Essential envelopes cluster in the amber band, Groceries at 94 percent among them, because they were funded close to what they cost, while Emergency sits at zero having gone untouched.
Two charts sit under the table. An Allocation vs Spent column chart pairs two bars per envelope so the plan and the reality stand side by side. Rent, where the bars match exactly, reads differently from Clothing, where the spent bar overshoots the allocation bar. A Spending Share pie chart shows where the money actually went this month, and in the sample it is dominated by the single Rent slice, a reminder that one fixed cost can swamp every discretionary envelope combined.
The Over Budget tile is the number the paper method never gave you in a single glance, and it repays a close look because of a subtlety in how the two counts differ. The percent-used column measures spending against the fresh allocation alone, so Clothing, which spent $72 against a $60 allocation, reads 120 percent and shows red. But Clothing is not counted among the over-budget envelopes, because its starting balance included a $30 rollover, leaving it $18 in the black. Over Budget counts only envelopes whose remaining balance is actually negative, which in the sample is just Subscriptions and Misc. The percent bar flags a category that outran its monthly funding; the over-budget count flags one that outran everything it had, rollover included. Both are true, and they answer slightly different questions.
Remaining, rollover, and over-budget in plain terms
Three ideas carry the whole sheet, and none of them is complicated once the words are pinned down.
Remaining is what an envelope has left: its starting balance minus what has been spent against it. A positive number is money still in the envelope; a negative one, shown in red, is spending that went past the envelope’s contents.
Rollover is memory. It is how an envelope remembers a surplus from last month or a transfer from a sibling envelope, added on top of this month’s fresh allocation. Without it, every envelope would reset to its allocation each month and the carry-forward that makes envelope budgeting flexible would be lost.
Over budget is the count of envelopes in the red right now. It is a status, not a verdict: the sheet is reporting that spending logged against those envelopes has passed what they held, and leaving the reader to decide what, if anything, to do about it. The CFPB frames budgeting as a tool for seeing whether spending lines up with a plan and analyzing where it does not, and the over-budget count is simply that comparison made automatic.
Excel or Google Sheets for an envelope budget
The workbook is a plain .xlsx file built on standard functions like SUMIF and COUNTIF, with no macros, no VBA, and no array formulas. It behaves the same in Microsoft Excel, Google Sheets after an upload, and LibreOffice Calc. Cross-sheet references use the standard tab names, so the one rule is to keep those tab names as they are. Google Sheets suits anyone who wants to log a purchase from a phone on the way out of the store; Excel suits those who prefer a local file. The structure described here is buildable in either.
One convenience worth noting is the currency selector next to the dashboard title. Choosing from its list of 35 symbols relabels every money column header and KPI across the six working sheets at once, leaving the How to Use sheet as it is. It changes the label only and does not convert the underlying numbers, so a workbook set up in dollars still holds dollar amounts after the symbol changes; the figures just display with a different sign.
Where the envelope method fits
Envelope budgeting is one of several ways to give structure to spending, and the CFPB’s own guidance leans on the same building blocks the workbook uses: creating a realistic budget and tracking spending against it by category. The envelope version adds the constraint that each category is a container with a running balance, rather than a line that resets. That container behavior, with rollover and transfers, is what separates it from a plain category budget, and it is the part a spreadsheet models cleanly. If you want the method and its history before looking at a build, our guide to envelope budgeting in a digital age covers cash stuffing, bank buckets, and app-free approaches; this article is about the mechanics of one particular workbook.
Which envelope template fits which situation
- Envelope Budget Ultimate Spreadsheet Template ($29) is the workbook this walkthrough follows: the setup sheet, spending log, monthly balances with rollover, the transfers sheet, the 12-month history, and the six-KPI dashboard, ready to use in Excel or Google Sheets. The same template comes in a free version with a single envelope sheet for anyone who wants to try the method first, and an Essentials version ($19) with a tracker and dashboard that sits between the two.
- If you would rather assign every dollar of income to a job by name until nothing is left, rather than fund a fixed set of envelopes and leave a buffer, the Zero Based Budget Ultimate Spreadsheet Template ($29) uses that method instead. The two share the same category-by-category spirit but differ in how they treat the leftover: envelope budgeting can leave income unallocated as a buffer, while zero-based budgeting drives the plan to zero.
Related
- Envelope Budgeting in a Digital Age: App-Free Methods - the method itself, from cash stuffing to bank buckets, before any spreadsheet
- Zero-Based Budgeting Template Tutorial - the give-every-dollar-a-job method built out step by step
- Biweekly Budgeting: The Paycheck Method - structuring a budget around pay dates rather than the calendar month
Frequently asked questions
What is the difference between an envelope's allocation and its rollover?
Allocation is the amount funded into an envelope for the current month, entered once on the setup sheet. Rollover is whatever is carried into the envelope on top of that, such as last month's surplus or a mid-month transfer from another envelope. Starting Balance is the two added together, and Remaining is Starting Balance minus what has been spent. In the sample, the Clothing envelope has a 60 allocation and a 30 rollover, so it starts the month at 90 even though only 60 was budgeted fresh.
Does the spreadsheet stop me from spending once an envelope is empty?
No. Unlike physical cash, a spreadsheet cannot physically withhold money, so it records rather than blocks. When spending logged against an envelope passes its starting balance, the Remaining figure goes negative and turns red, and the dashboard counts that envelope in its over-budget tally. In the worked month, Subscriptions and Misc both finish in the red, so the dashboard shows two envelopes over budget. The constraint is the visible number, not a locked cell.
How many envelopes can the spreadsheet hold?
The setup sheet has room for up to 15 envelopes, and the sample fills 12. Fewer is fine: leaving the extra rows blank keeps them out of every total and off the dashboard, which counts only the named envelopes. Some people start with a smaller set and add more once the routine settles, which the workbook's own notes point out.
How is this different from a normal category budget?
A category budget usually tracks planned versus actual for the month as a whole. An envelope budget treats each category as a container with its own running balance that carries forward, so an envelope can hold a rollover from last month or lend money to another envelope through a transfer. The mechanics here are the same idea as physical cash envelopes, translated into a spending log and per-envelope balances rather than paper and cash.
Does changing the currency symbol convert the numbers?
No. The currency selector next to the dashboard title relabels every money column header and KPI across the workbook, and nothing else. Choosing a different symbol from the list of 35 changes the label shown, so a 4,800 income figure reads with the new symbol, but the underlying number stays 4,800. There is no exchange-rate conversion built in.
Sources
- Budgeting: How to create a budget and stick with it - Consumer Financial Protection Bureau
- Analyzing budgets - Consumer Financial Protection Bureau
About this article
Sheet names, inputs, formulas, sample figures, chart types and conditional formatting checked on 2026-09-10 against the shipped Envelope Budget Ultimate workbook (Dashboard, Envelope Setup, Monthly Envelopes, Spending Log, Fund Transfers, 12-Month History, How to Use). CFPB budgeting and spending-tracker references checked against the live Consumer Financial Protection Bureau pages at writing time. Last reviewed September 2026.