Quick Summary
Learn how to create a comprehensive personal finance tracker in Google Sheets to manage your income, expenses, savings, and investments effectively.
Building a finance tracker from scratch takes time, but Google Sheets makes it possible to create something genuinely useful. This guide walks through the process of setting up a tracker that handles income, expenses, savings, and investments - all in one place.
Why Google Sheets Works Well for This
Google Sheets is free, accessible from any device, and flexible enough to build exactly what you need. You can share it with a partner or family member, and everything syncs automatically.
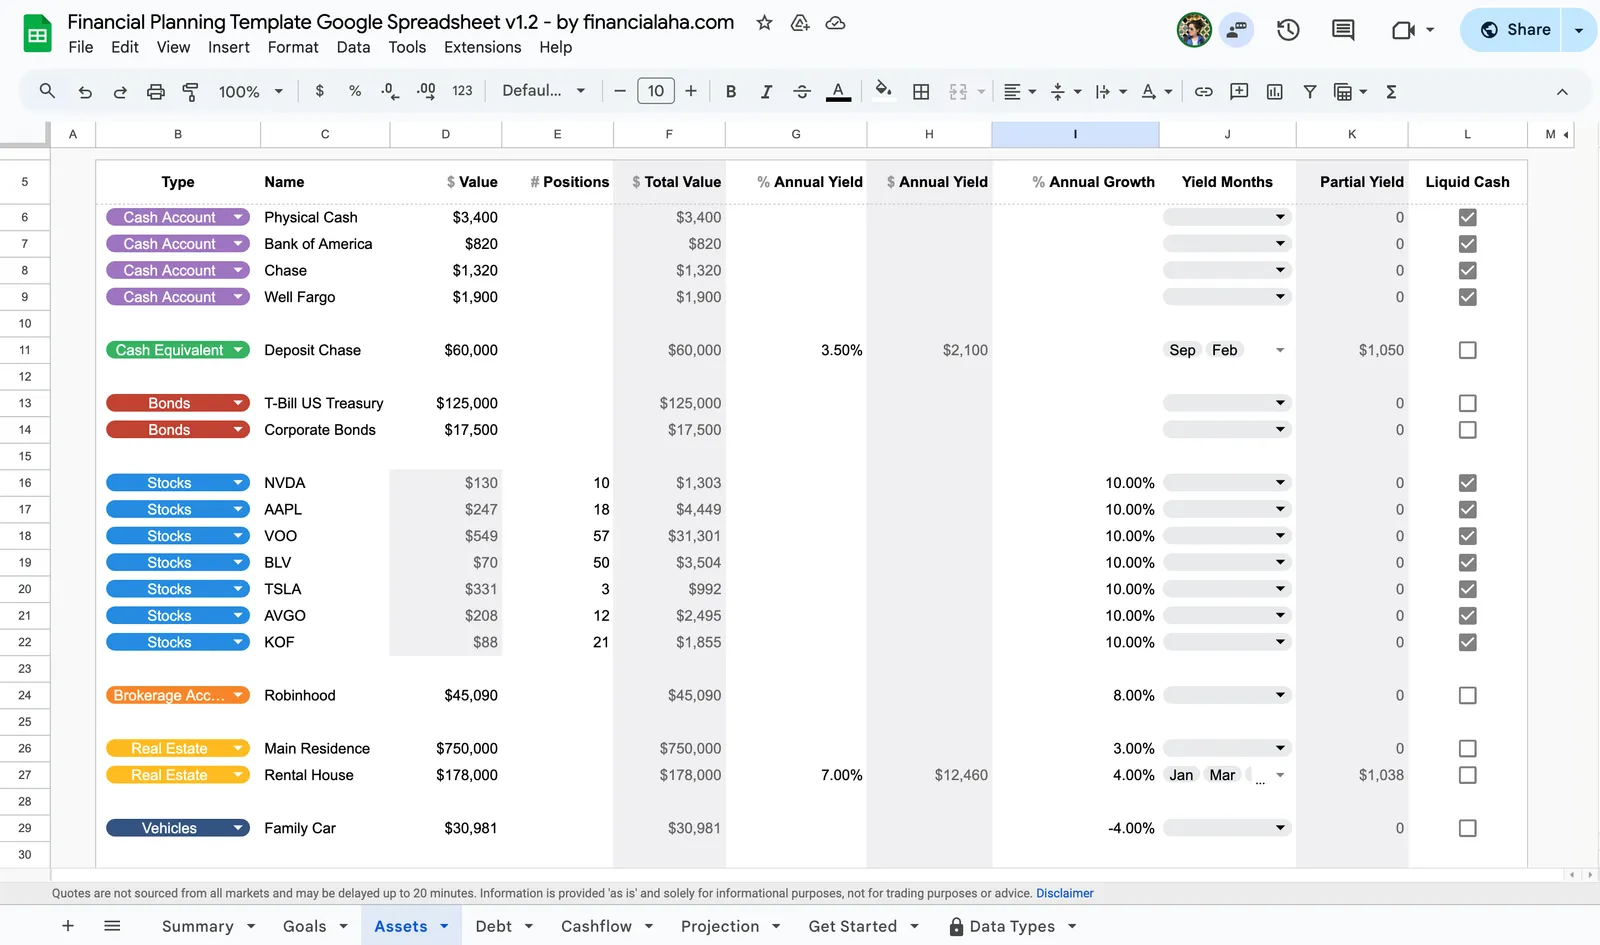
That said, building a tracker from scratch requires time and some spreadsheet knowledge. If you’d rather skip the setup, FinancialAha’s spreadsheet templates come ready to use with these features built in. The Financial Planning Template in particular covers income, expenses, savings, and investments in a single spreadsheet.
Set Up Your Spreadsheet Structure
Start by creating a new spreadsheet and renaming it to something like “Personal Finance Tracker.” The name matters less than having something descriptive enough that you’ll recognize it later.
The key to a good finance tracker is separating different types of data into their own tabs. This keeps things organized and makes formulas easier to write since you can reference entire sheets rather than hunting for specific cell ranges. Here are the tabs worth considering:
- Dashboard - A visual summary of your finances
- Income - Track earnings from various sources
- Expenses - Categorize and track spending
- Savings - Monitor progress towards savings goals
- Investments - Keep track of your investment portfolio
- Budget Planning - Set monthly or yearly budgets
- Debt Tracker - Monitor outstanding debts and repayments
You don’t need all of these from day one. Starting with just Income and Expenses is perfectly reasonable, and you can add more tabs as your tracking becomes more sophisticated.
Build Your Income Tracking Tab
Income tracking tends to be simpler than expense tracking since most people have fewer income sources. Still, having a dedicated tab makes it easy to see patterns over time - like whether freelance income is growing or how much a side project actually contributes.
In the “Income” tab, set up these columns:
| Column | Content |
|---|---|
| A | Date |
| B | Source (e.g., Salary, Freelance, Investments) |
| C | Description |
| D | Amount |
| E | Category (e.g., Fixed, Variable) |
Some useful formulas for this tab:
Total income:
=SUM(D2:D)Income by source (e.g., total from Freelance):
=SUMIF(B2:B, "Freelance", D2:D)Monthly breakdown using QUERY - this is one of Google Sheets’ most useful features:
=QUERY(A2:D, "SELECT MONTH(A)+1, SUM(D) GROUP BY MONTH(A)+1 LABEL MONTH(A)+1 'Month', SUM(D) 'Total'")Pivot tables also work well here for breaking down income by source or month.
Create the Expense Tracker
The “Expenses” tab is where most of the action happens. This is typically the largest data set in any finance tracker, so the structure matters more here than anywhere else. Getting categories right from the start saves headaches later.
The “Expenses” tab needs more detail than Income. Include these columns:
| Column | Content |
|---|---|
| A | Date |
| B | Category (e.g., Housing, Food, Entertainment) |
| C | Subcategory (e.g., Rent, Groceries, Dining Out) |
| D | Description |
| E | Payment Method (e.g., Credit Card, Cash) |
| F | Amount |
| G | Recurring? (Yes/No) |
Tip: Use Data Validation to create dropdown menus for Category and Payment Method. Select the column, go to Data → Data validation, and add your list of options. This keeps entries consistent and makes filtering easier.
If setting up categories from scratch feels tedious, the Monthly Expense Tracker from FinancialAha comes with pre-built categories that work for most situations.
Some useful formulas:
Total expenses:
=SUM(F2:F)Expenses by category:
=SUMIF(B2:B, "Housing", F2:F)Expenses by category AND payment method (using SUMIFS for multiple conditions):
=SUMIFS(F2:F, B2:B, "Housing", E2:E, "Credit Card")Monthly expenses using QUERY:
=QUERY(A2:F, "SELECT MONTH(A)+1, SUM(F) GROUP BY MONTH(A)+1 LABEL MONTH(A)+1 'Month', SUM(F) 'Total'")Conditional formatting can highlight high spending - select the Amount column, go to Format → Conditional formatting, and set rules like “greater than 500” to flag larger expenses.
Add Budget Targets
Tracking expenses gives you visibility into where money goes. The next step is comparing actual spending against what you intended to spend. This is where a budget tab comes in - it turns your expense data into actionable insights.
Create a “Budget” tab with:
| Column | Content |
|---|---|
| A | Category |
| B | Monthly Budget |
| C | Actual (pulled from Expenses tab) |
| D | Difference (=B-C) |
Pull actual spending using SUMIF:
=SUMIF(Expenses!B:B, A2, Expenses!F:F)This shows at a glance which categories are over or under budget. The Monthly Budget Template handles this automatically with visual indicators for budget status.
Track Savings and Investments
Savings and investments represent the forward-looking part of your finances. While income and expenses show the present, tracking savings progress and investment growth reveals whether you’re moving toward your goals.
For the “Savings” tab, use these columns:
| Column | Content |
|---|---|
| A | Date |
| B | Account Name |
| C | Amount Deposited |
| D | Total Balance |
| E | Interest Rate (as decimal, e.g., 0.05 for 5%) |
Calculate projected balance with compound interest:
If you want to see what your savings could grow to over time:
=D2*(1+E2)^12This calculates your balance (D2) with interest rate (E2) compounded over 12 periods. Adjust the number based on your timeframe.
Running total of deposits:
=SUM($C$2:C2)The “Investments” tab works well with these columns:
| Column | Content |
|---|---|
| A | Date Purchased |
| B | Investment Type (e.g., Stocks, ETFs, Bonds) |
| C | Name/Ticker |
| D | Quantity |
| E | Buy Price |
| F | Current Price |
| G | Current Value (=D*F) |
| H | Gain/Loss (=G-(D*E)) |
Total portfolio value:
=SUM(G2:G)Total gain/loss:
=SUM(H2:H)For a more complete financial picture that includes net worth tracking, the Financial Planning Template combines all of these elements in one place.
Build a Dashboard
A dashboard brings everything together visually. Instead of switching between tabs to understand your finances, a well-designed dashboard surfaces the most important information in one place. This is where all your tracking work pays off.
Consider including these visualizations:
- Bar charts for monthly income and expenses comparison
- Pie charts showing expense distribution by category
- Line charts tracking investment or savings growth over time
Drop-down menus and slicers let you filter data by date range or category. This is especially useful when reviewing a specific month or comparing quarters.
Building charts and keeping them linked to your data takes time, and formulas can break if the underlying structure changes. The Financial Planning Template includes a pre-built dashboard that updates automatically as you add transactions.
Optional: Automate with Scripts
Google Apps Script can automate repetitive tasks like data entry or generating monthly summaries. This requires some coding knowledge, but there are plenty of tutorials available if you’re interested in exploring this direction.
Common automations include importing transactions from bank exports, sending weekly summary emails, or creating monthly snapshots of your net worth. The learning curve is real, but once set up, scripts can save significant time on routine tasks.
An Alternative: Pre-Built Templates
Building a tracker from scratch gives you complete control, but it takes time to get right - and formulas can break if something’s set up incorrectly.
FinancialAha offers several templates depending on what you need:
- Monthly Expense Tracker - For tracking where money goes, no budgeting required
- Monthly Budget Template - Tracking plus budget targets with visual comparisons
- Annual Budget Planner - Full year view with all 12 months
- Financial Planning Template - The complete solution covering income, expenses, savings, investments, and net worth in one place
All templates come with categories built in, formulas that update automatically, and work immediately without setup.
Getting Started
Whether you build your own or use a template, the value comes from actually using it consistently. Start with whatever approach feels manageable - even tracking just expenses for a month provides useful visibility into where money goes.
The tracker itself is just a tool. What matters is developing the habit of recording transactions and reviewing your data periodically. Many people find that weekly reviews work well - frequent enough to catch issues, but not so often that it feels like a chore. Over time, the patterns in your data reveal insights that no amount of guessing could provide.