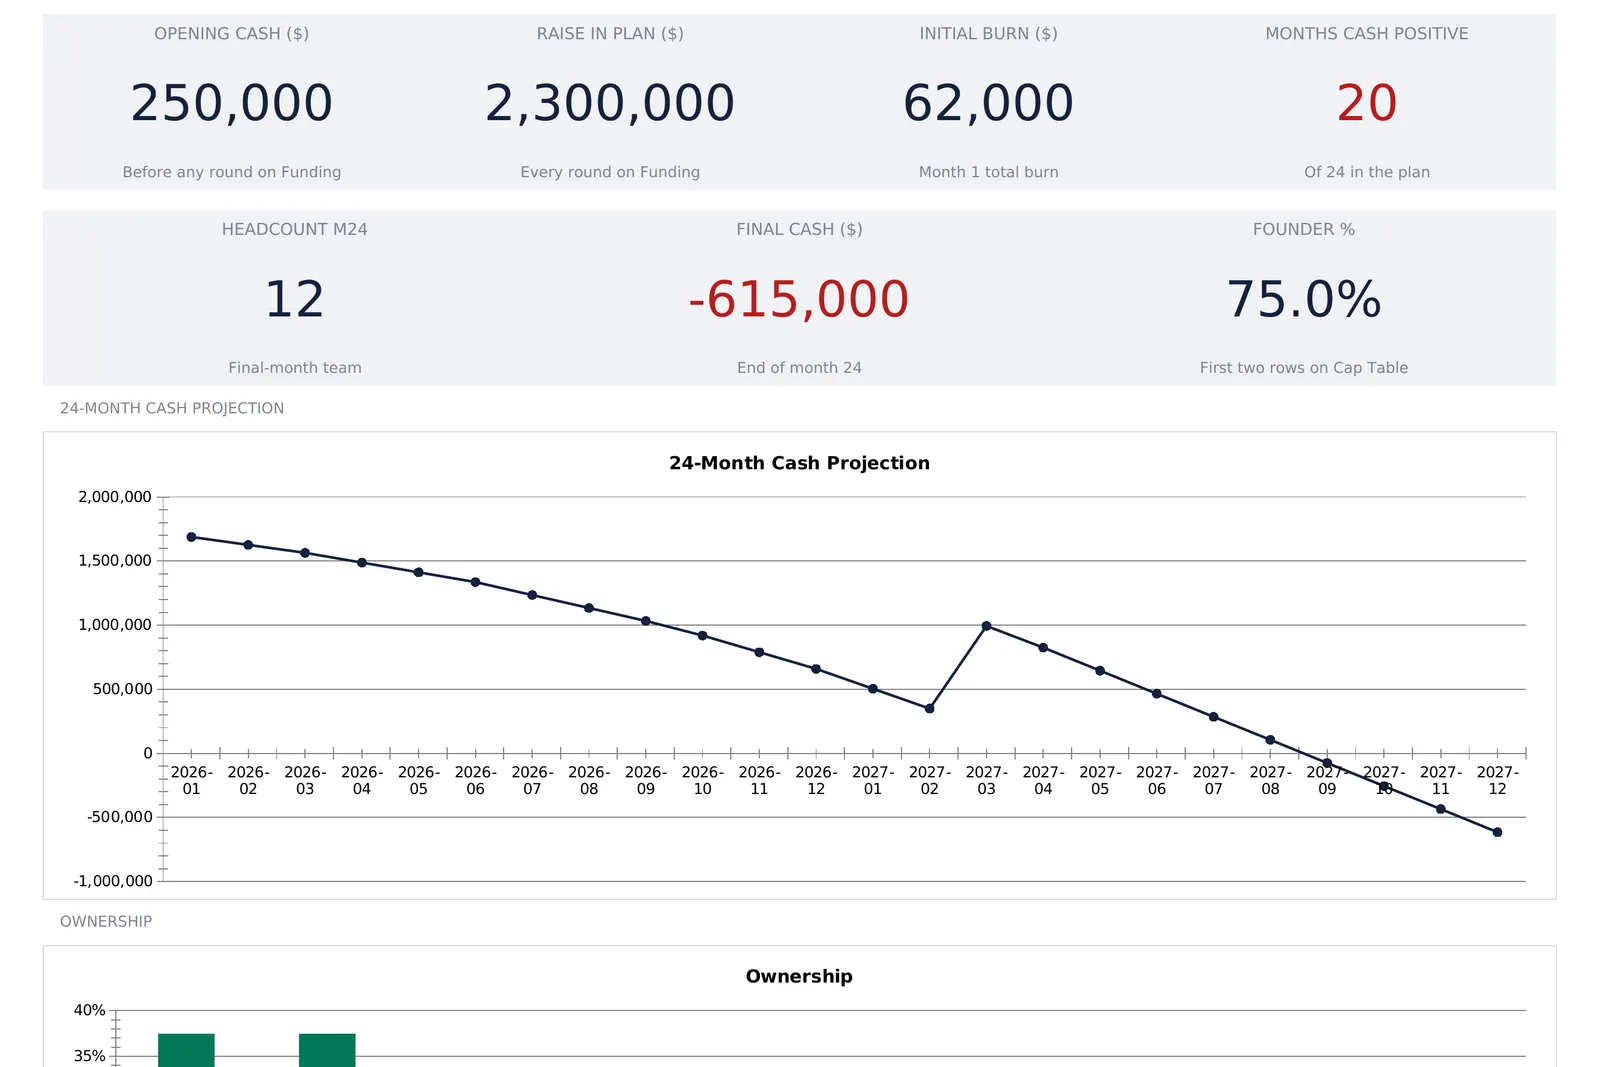
A startup financial model spreadsheet answers one narrow question precisely: given this hiring plan and this cost base, which month does the cash run out. Four small input sheets, funding rounds, planned hires, two cash constants, and a share register, drive a 24-month burn grid and a seven-tile dashboard. This walkthrough follows a worked example that raises $2.3 million, grows from 3 people to 12, and still ends month 24 at minus $615,000. Our Startup Financial Model template ($59) ships the same structure ready-made for Excel and Google Sheets.
A startup’s finances split cleanly in two. One half is knowable to the month: salaries, the software bill, the money already in the bank, and whatever a round put there. The other half is not knowable at all, because it depends on what the product sells next quarter. Plenty of early models blur the two together and end up defending a revenue curve nobody in the room believes.
A model built around the knowable half asks a narrower question and answers it precisely. Given this hiring plan and this cost base, which month does the cash run out, and what does a round do to that date?
That question needs four kinds of data: two cash constants, a list of funding events, a hiring plan, and a share register. Everything else, the monthly burn, the headcount curve, the cash line, the ownership percentages, is arithmetic on top. The examples below come from our Startup Financial Model Spreadsheet Template ($59), which ships the whole structure ready-made for Excel and Google Sheets. The sample company raises $2.3 million and still runs out of cash four months before the plan ends. That is deliberate, because a plan that finishes in the green teaches nothing about where the cliff sits.
What a startup financial model spreadsheet has to hold
Strip away the presentation and there are only four kinds of input:
- Cash constants. What is in the bank before any round, and what the company spends every month on things that are not people.
- Funding events. Each round as a name, a month, an amount, and how much of the company it costs.
- The hiring plan. Each role as a start month and a fully loaded monthly cost, because in an early-stage company headcount is the burn.
- The share register. Who holds how many shares today.
The template gives each group its own sheet. Settings holds the constants, Funding holds the rounds, Hiring Plan holds the roles, and Cap Table holds the register. Burn & Runway computes the 24-month grid, a Dashboard sits on top, and a How to Use sheet carries the definitions. Seven sheets, and across all of them exactly 110 shaded entry cells. Those 110 cells are the entire editable surface, so adapting the file to a real company is typing over them. Every other cell carrying a number is a formula. Each computed cell also holds a validation rule that only passes while it still contains one, so overtyping a formula raises a warning instead of breaking the chain behind it in silence.
Start with Settings: two numbers that set the floor
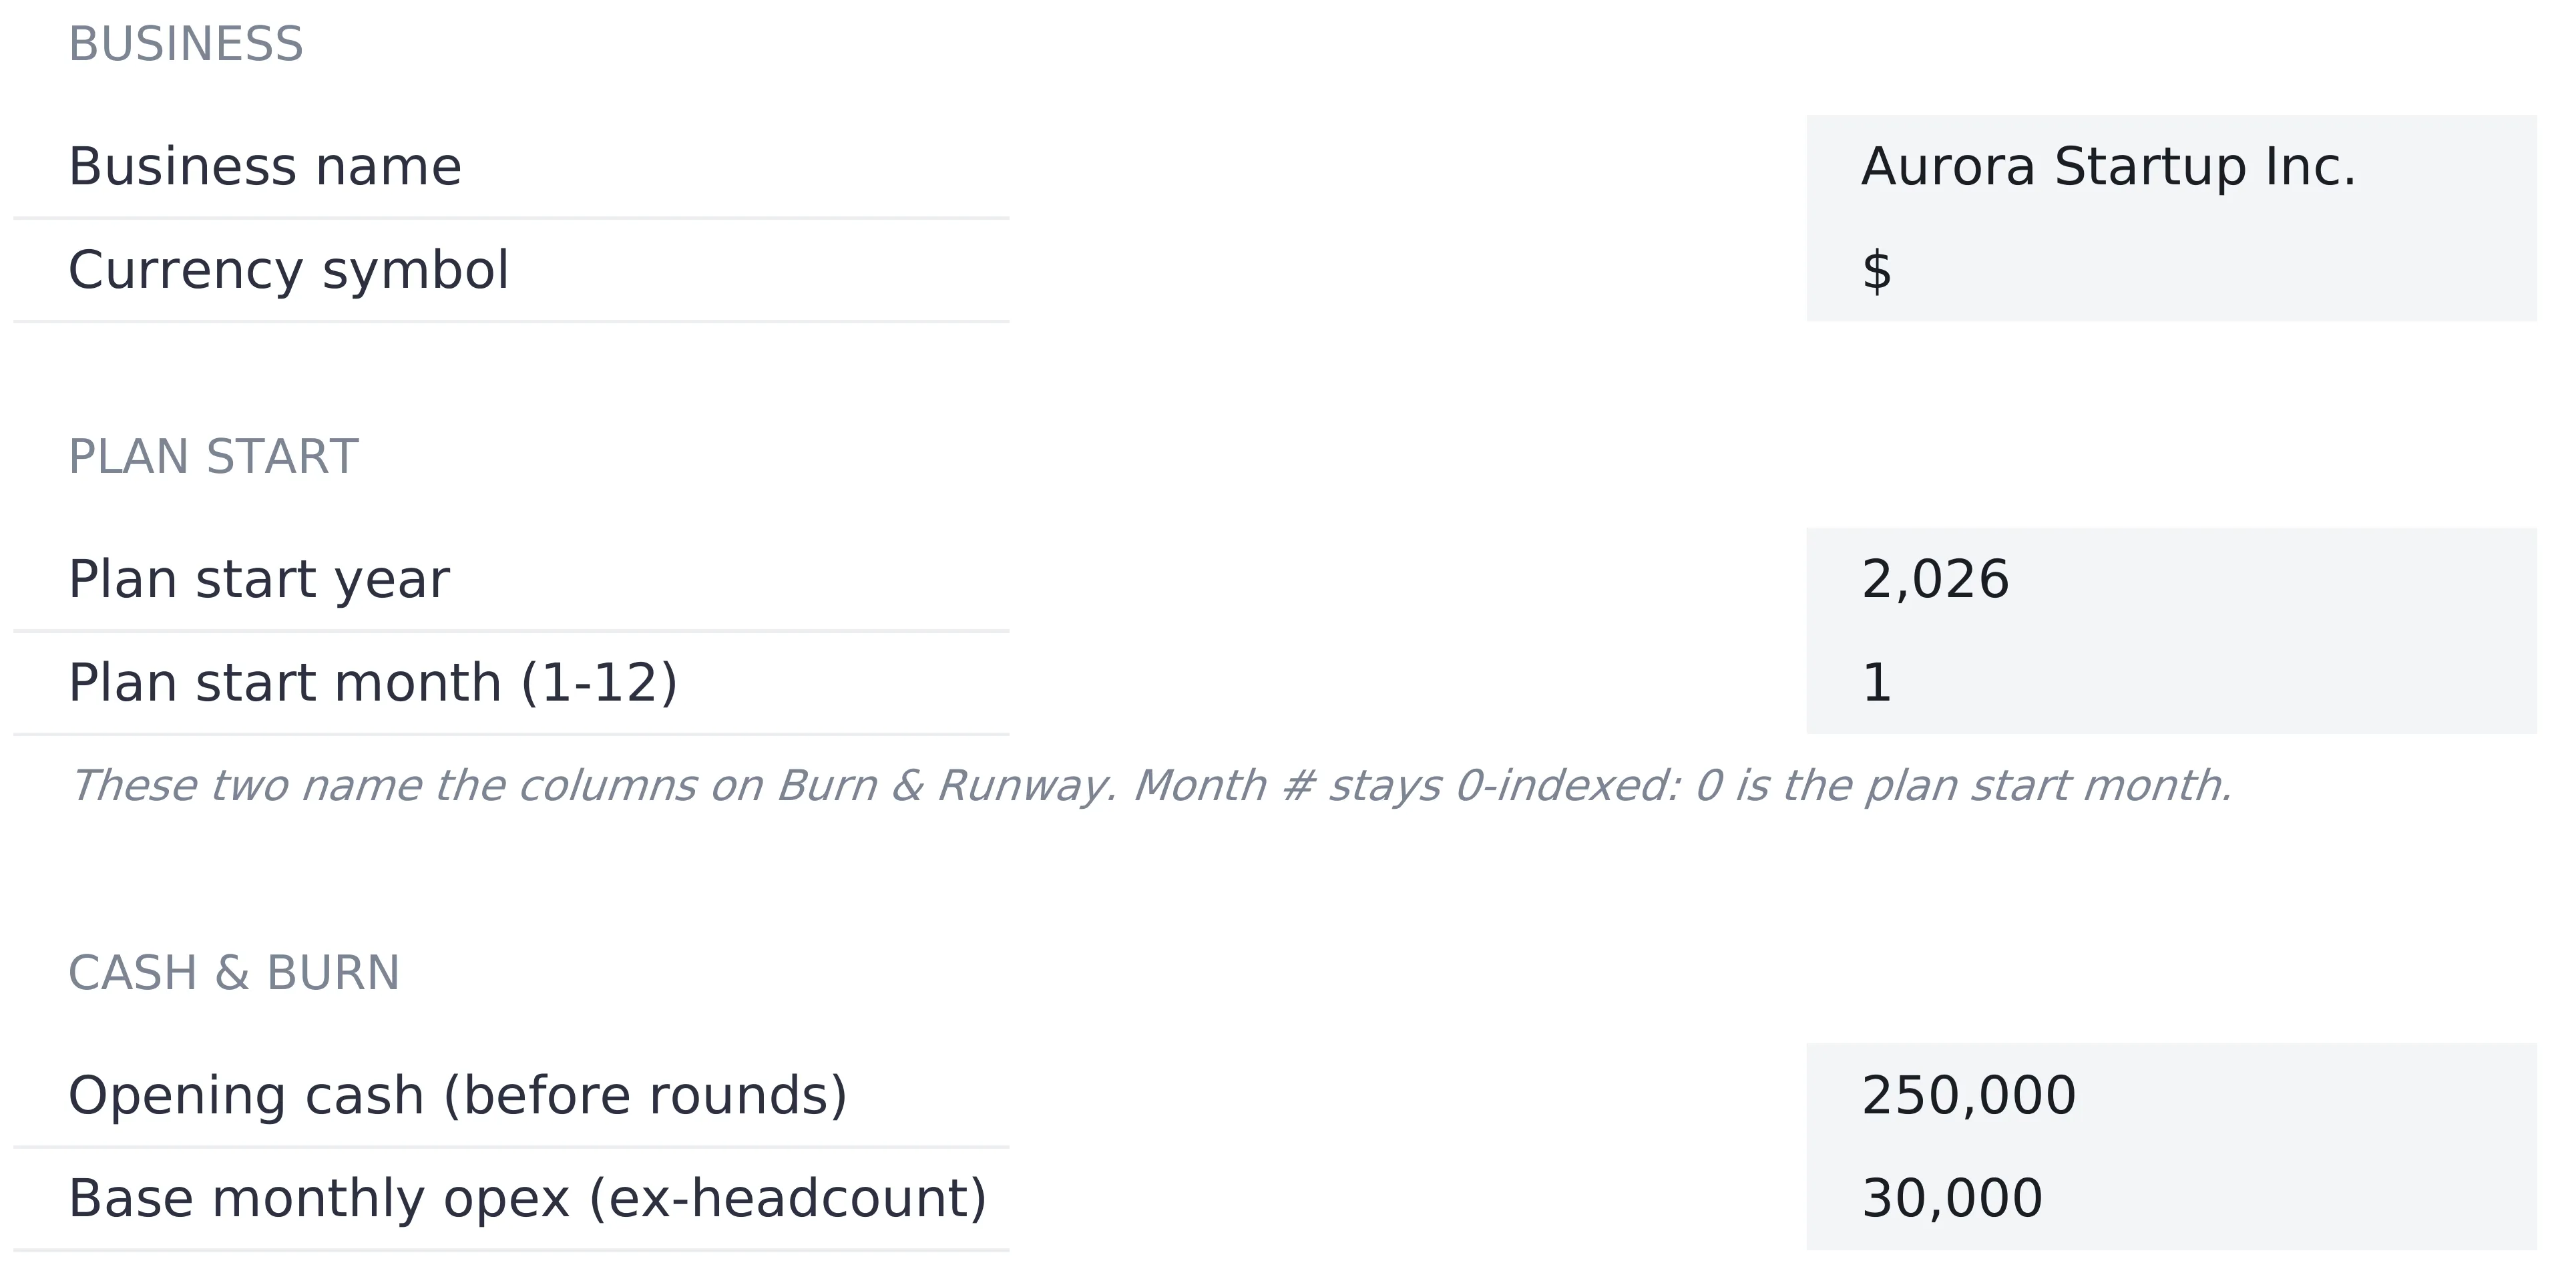
Six typed cells sit on the Settings sheet, and two of them decide the shape of everything downstream.
Opening cash, $250,000 in the sample, is the balance before any round lands. The distinction matters because the seed round on the Funding sheet also arrives in month 0, and counting it twice would inflate the whole cash line by $1.5 million.
Base monthly opex excluding headcount, $30,000, covers everything that is not a person: software, hosting, rent, legal, accounting. It is flat across all 24 months, so it does not inflate and it does not scale with the team.
Plan start year 2026 and plan start month 1 name the columns on the Burn & Runway grid and do nothing else. They produce the labels 2026-01 through 2027-12, and shifting them renames the columns without moving a single number.
The last two cells are the business name, Aurora Startup Inc. in the sample, which appears under the title on every sheet, and a currency symbol chosen from a dropdown of 35 options. Changing the symbol relabels every money column and KPI heading across the workbook. It relabels only, with no conversion of the underlying figures.
One convention runs through the whole file and causes trouble if it is missed: month numbers are 0-indexed. Month 0 is the plan start month, so a 24-month horizon runs from month 0 to month 23.
The Funding sheet: rounds as dated cash events
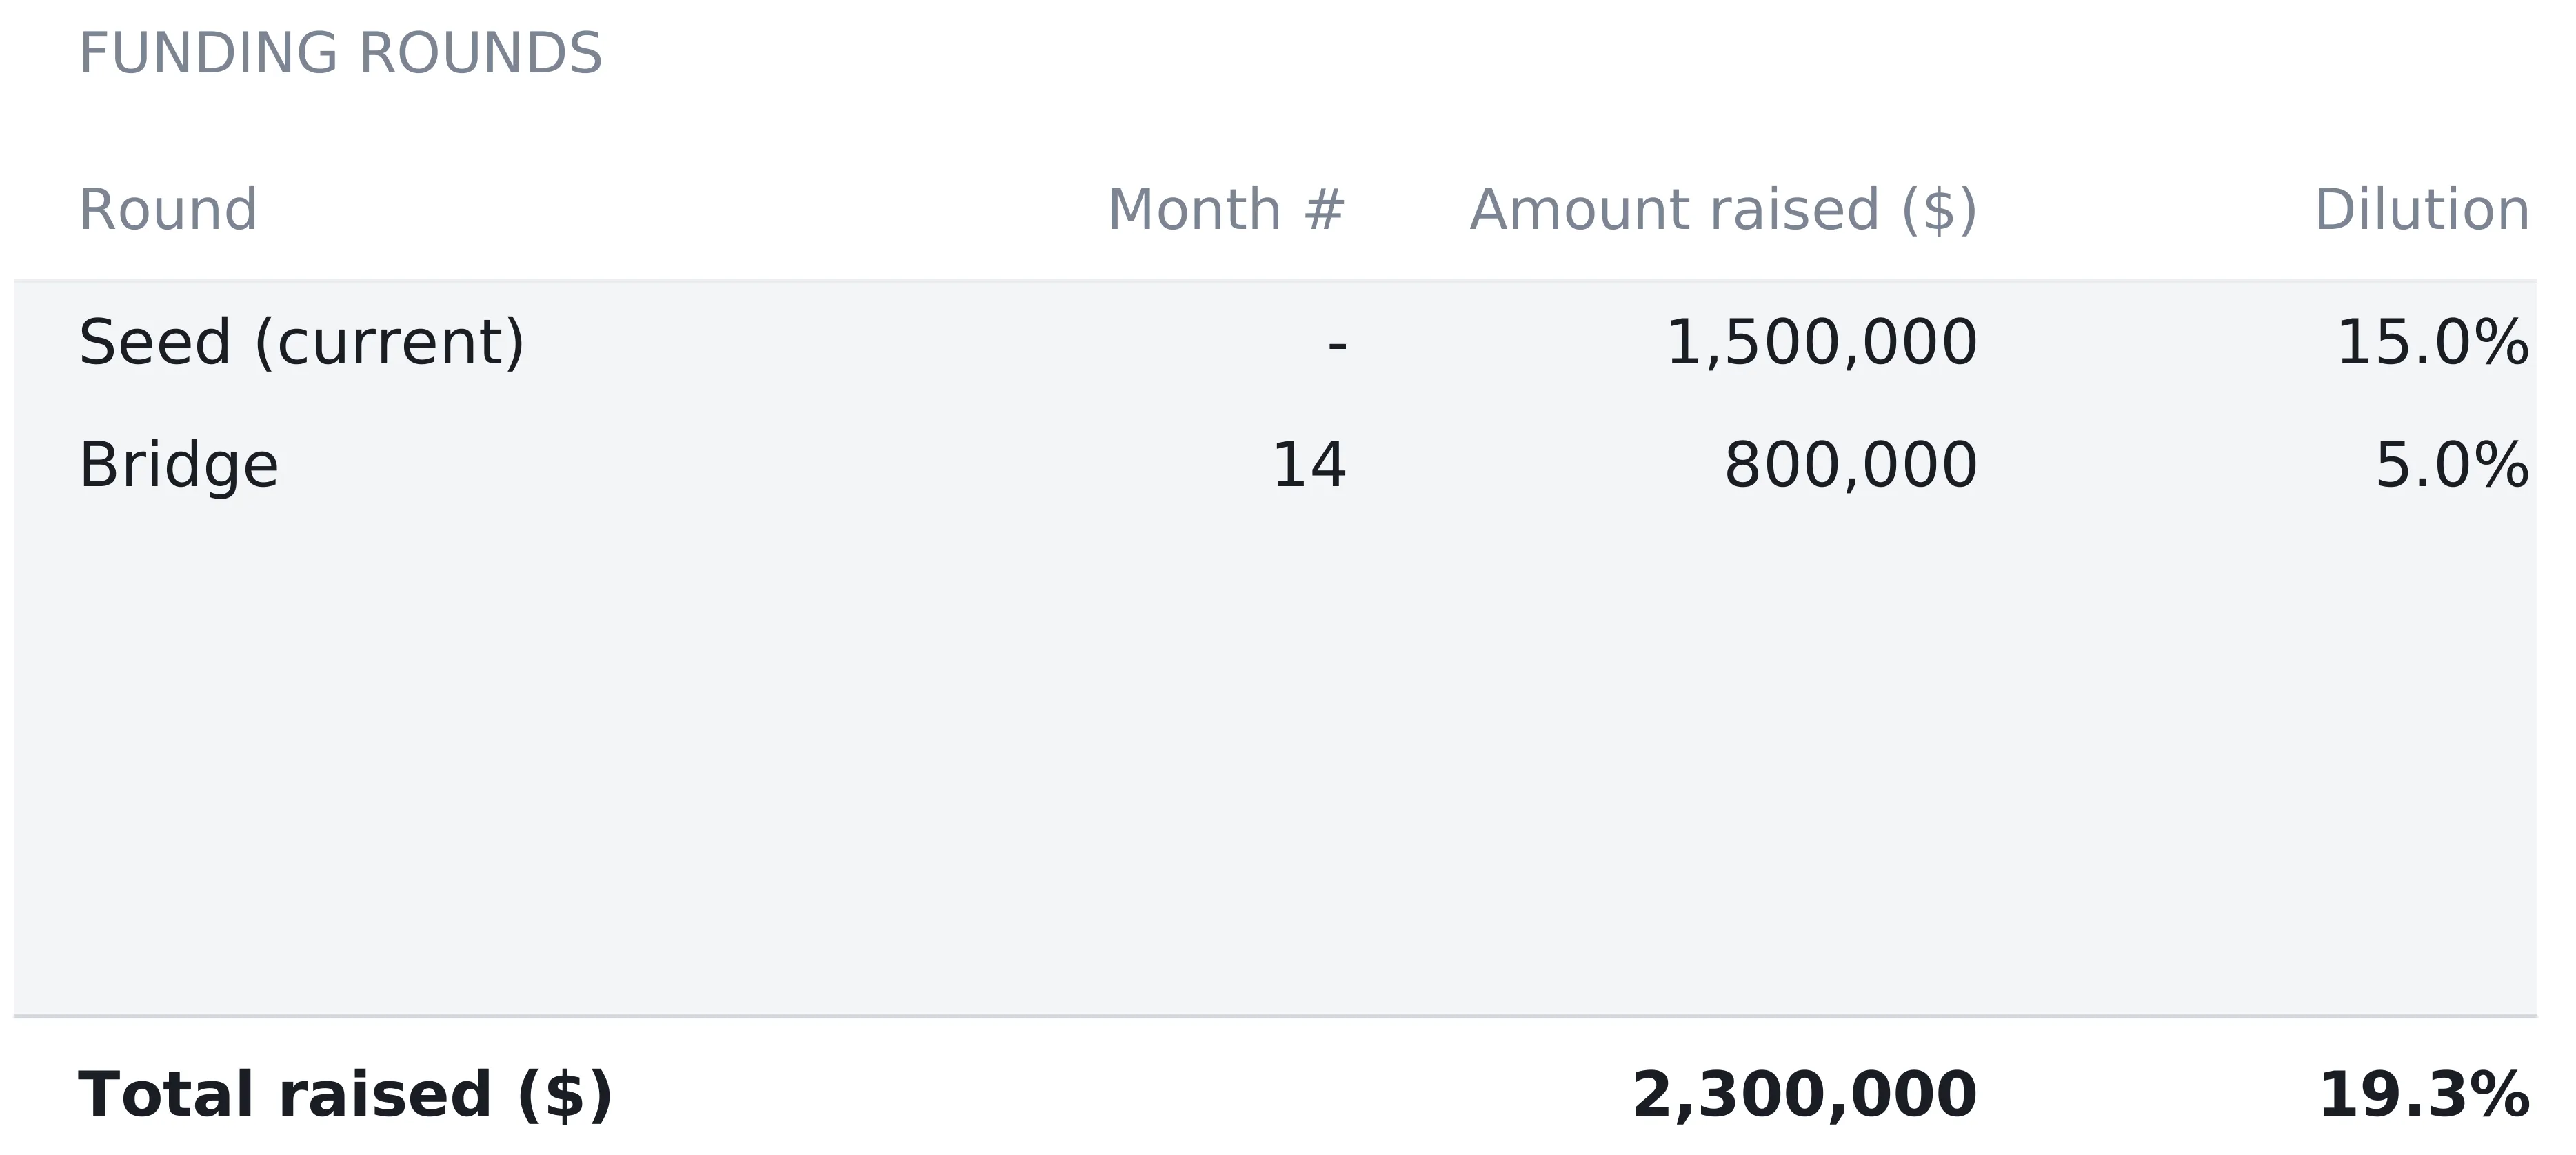
Six rows, four typed cells each: round name, month number, amount raised, and dilution. The sample uses two of them.
The seed round sits at month 0 for $1,500,000 at 15 percent dilution. A bridge sits at month 14 for $800,000 at 5 percent. Total raised comes to $2,300,000.
The total dilution cell is the one worth reading twice. It shows 19.3 percent, not the 20 percent that adding 15 and 5 would give, because the formula compounds the rounds instead:
Total dilution = 1 - (1 - 15%) × (1 - 5%) = 19.25%The bridge dilutes the 85 percent that survived the seed rather than the original whole, and each further round would dilute what is left after all the ones before it. Over four or five rounds that gap between adding and compounding grows into real percentage points of a founder’s stake.
The month number is where a round becomes a cash event. It feeds the raise row on Burn & Runway, so a round typed at month 14 lands in the 2027-03 column and nowhere else. Month 0 is included, which is how the seed reaches the opening balance.
Two things the sheet does not do deserve naming. Dilution is typed by hand, not derived, because the workbook holds no valuation, no price per share, and no pre-money or post-money figures. And the row here is a modelling record rather than a legal one. A US company relying on a Regulation D exemption files a Form D notice with the SEC after the first sale of securities in the offering, which is a separate exercise from anything in a spreadsheet.
Four rows are left spare, already inside the total and already covered by the cash row, so a new round goes on the next free line with no formula to extend.
The Hiring Plan: where the burn rate comes from
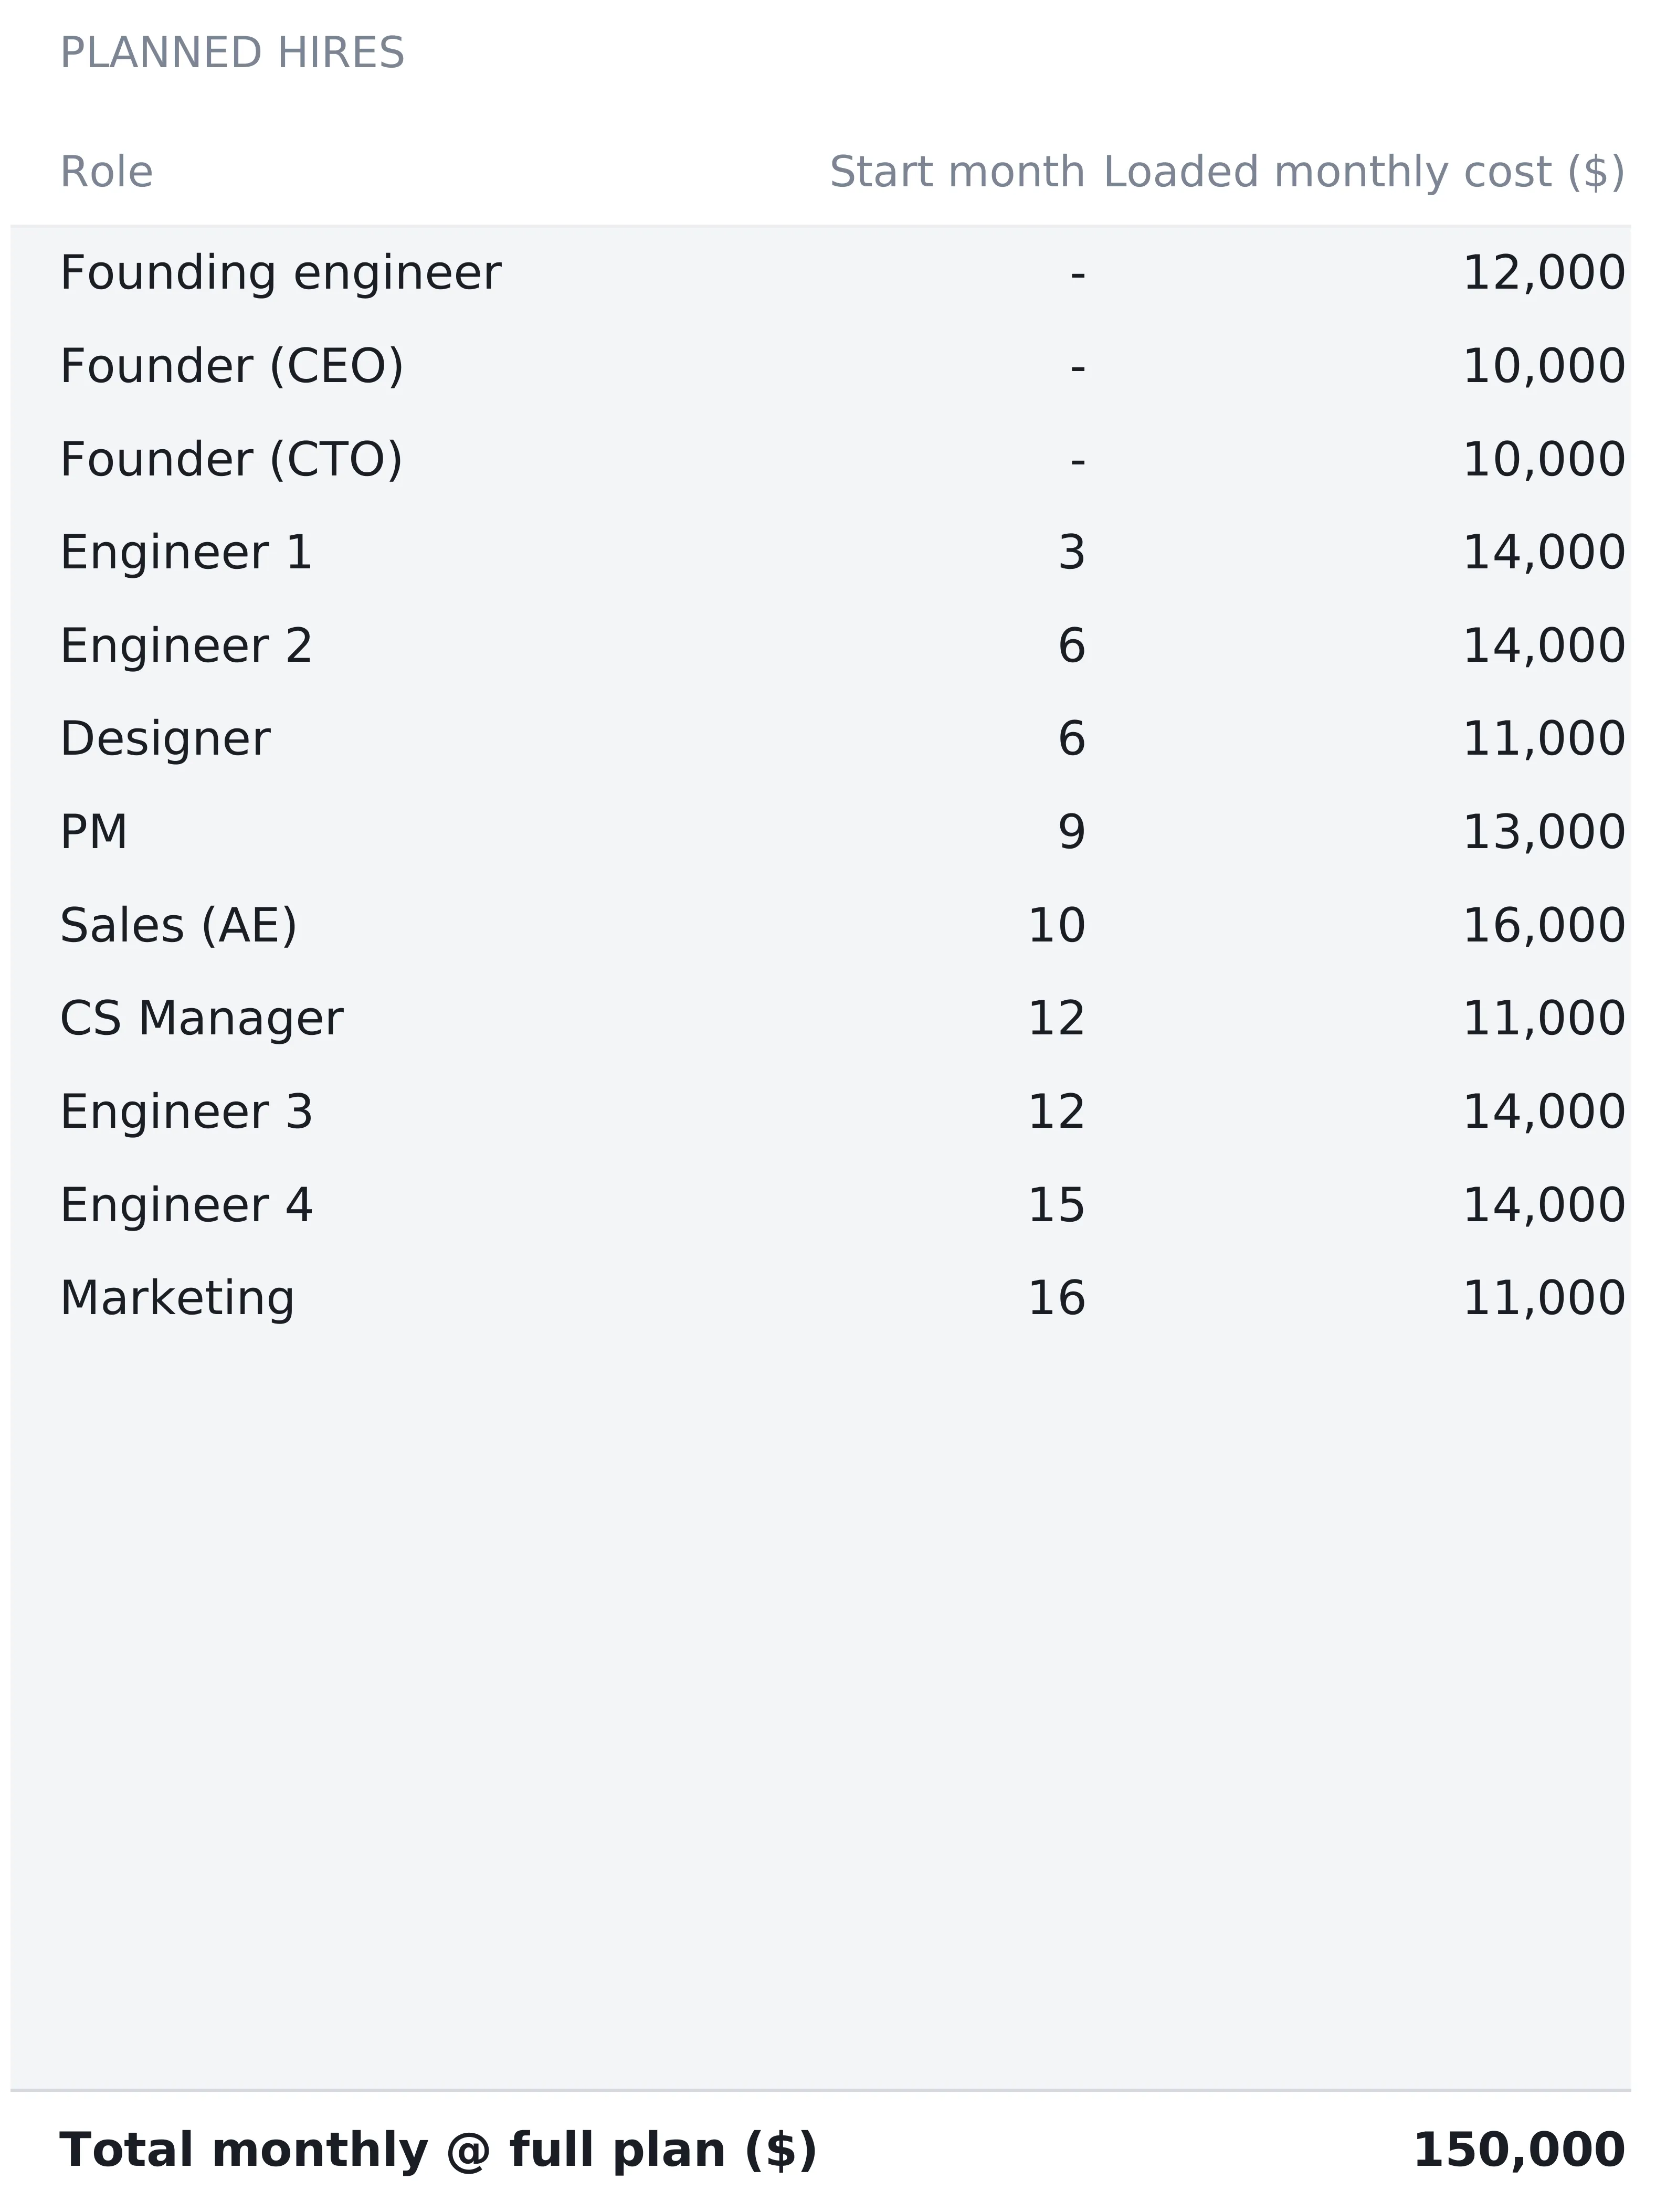
Twenty rows, three typed cells each: role, start month, and fully loaded monthly cost. Loaded means salary plus benefits, payroll tax, and anything else that arrives per head, which is the figure that hits the bank account rather than the one on the offer letter.
The sample plans twelve roles. Three start at month 0, a founding engineer at $12,000 and two founders at $10,000 each, which is $32,000 a month before a single other bill. From there the plan adds an engineer at month 3, a second engineer and a designer at month 6, and a PM at month 9. A sales AE follows at month 10, a CS manager and a third engineer at month 12, a fourth engineer at month 15, and marketing at month 16. At full plan the payroll line reads $150,000 a month.
Hires turn on in their start month and burn through the rest of the horizon. There is no end date column, no ramp, no attrition, and no raise schedule, so a role costs the same in month 23 as it did in month 6.
That single behaviour is what makes the sheet useful for planning. Because a hire runs to the end of the grid, the cost of a decision is the monthly figure multiplied by the months remaining. The engineer starting at month 3 at $14,000 is not a $14,000 decision, it is $294,000 across the 21 months left in the plan. The marketing hire at month 16 costs $88,000 over the same horizon at $11,000 a month. Two roles, one more than three times the other, largely because of when they start.
Eight rows are spare, and the total and every month on the grid already cover them.
Burn & Runway: the 24-month grid where it all lands
Nothing on this sheet is typed. Six computed rows run across 24 columns labelled 2026-01 through 2027-12.
Headcount counts the roles on the Hiring Plan whose start month has arrived. It runs 3, 3, 3, 4, 4, 4, 6, 6, 6, 7, 8, 8, then 10 from month 12, and settles at 12 by month 16.
Hire cost (cumulative) sums the loaded cost of those same roles, climbing from $32,000 to $150,000 in seven steps.
Base opex repeats the $30,000 from Settings in every column.
Total burn adds the two: $62,000 in the first month, $76,000 from month 3, $101,000 from month 6, $114,000, $130,000, $155,000, $169,000, and $180,000 from month 16 onward. Nearly three times the starting figure, and every step comes from a hire.
Raise pulls from the Funding sheet by month number, so it reads $1,500,000 in 2026-01, $800,000 in 2027-03, and zero in the other 22 columns.
Cash (EOM) carries the balance forward. Month 0 starts from opening cash on Settings, which is why $250,000 minus $62,000 plus $1,500,000 gives $1,688,000 in the first column.
Four formulas do the whole grid, and they are the same four in a hand-built version. Written against month number m, with the input lists as whole-column ranges so blank rows stay inside them:
Headcount[m]  = COUNTIFS(role names, "?*", start months, "<="&m)
Hire cost[m]  = SUMIFS(loaded costs, role names, "?*", start months, "<="&m)
Raise[m]      = SUMIFS(round amounts, round names, "?*", round months, m)
Cash[m]       = Cash[m-1] + Raise[m] - Burn[m]
The "?*" criterion is doing quiet work. It requires a role or round name to be present, so the spare rows sitting inside every range are never counted as a person or a round. Without it, a blank start month reads as zero and every empty row joins the headcount from month 0.
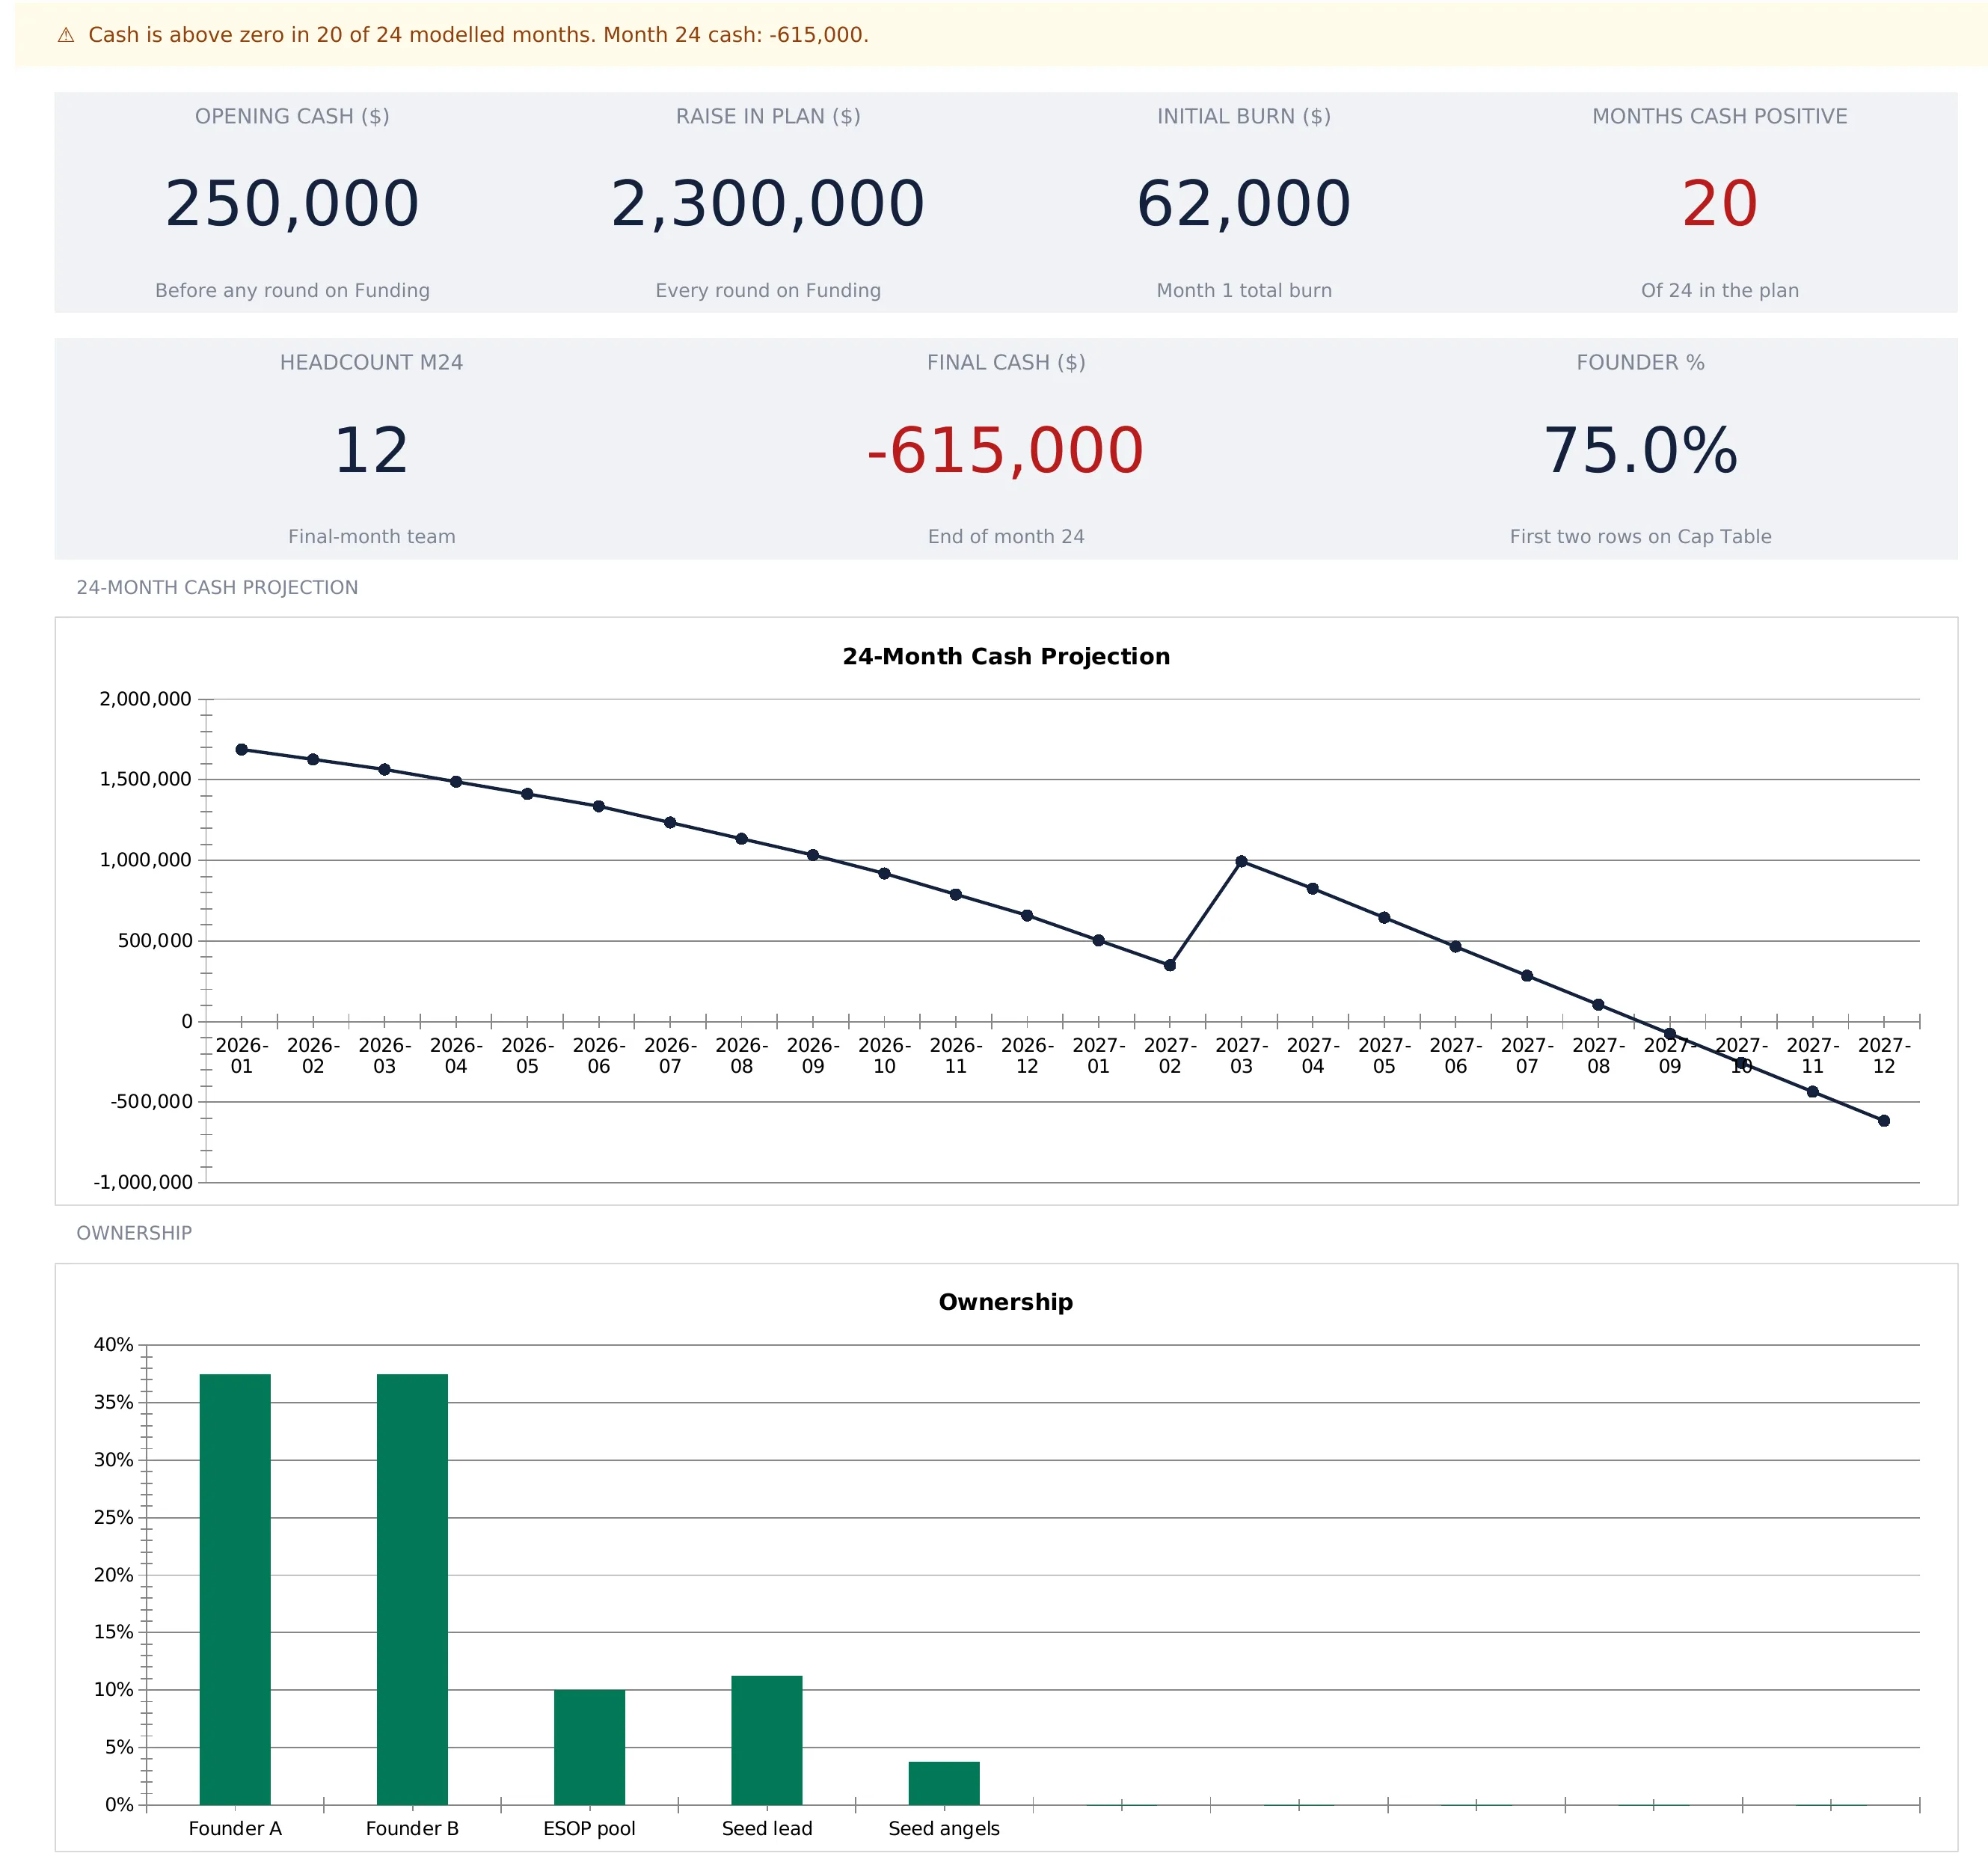
Read across, the sample year and a half tells a clear story. Cash slides from $1,688,000 down to $349,000 by 2027-02, the bridge lifts it back to $994,000 in 2027-03, and then it falls again on a burn that is now $180,000 a month. It crosses zero in 2027-09 at minus $75,000 and ends the horizon at minus $615,000.
The whole plan checks out in one line of arithmetic. Opening cash plus every round is $2,550,000. Total burn across all 24 months is $3,165,000. The difference is exactly the $615,000 the final column reports. A model this compact is easy to audit, which is most of the argument for a spreadsheet. The argument against one is just as plain. A dedicated planning tool syncs actuals from the accounting system, keeps several scenarios side by side, and stops two people editing the same plan into different answers. A spreadsheet does none of that, and the figures in it are only as current as the last time somebody typed.

The grid also puts a price on the bridge. Take that $800,000 out of the raise row and the same plan crosses zero in 2027-05 instead of 2027-09, because cash would have been $194,000 at the end of month 14 and $25,000 at the end of month 15. Four extra months, on a plan spending $180,000 a month by then. In the model, moving the bridge earlier moves where the dip sits without changing where the line ends, while a different hiring plan changes the slope itself. That is the comparison the sheet exists to make legible.
The Cap Table: shares, not rounds
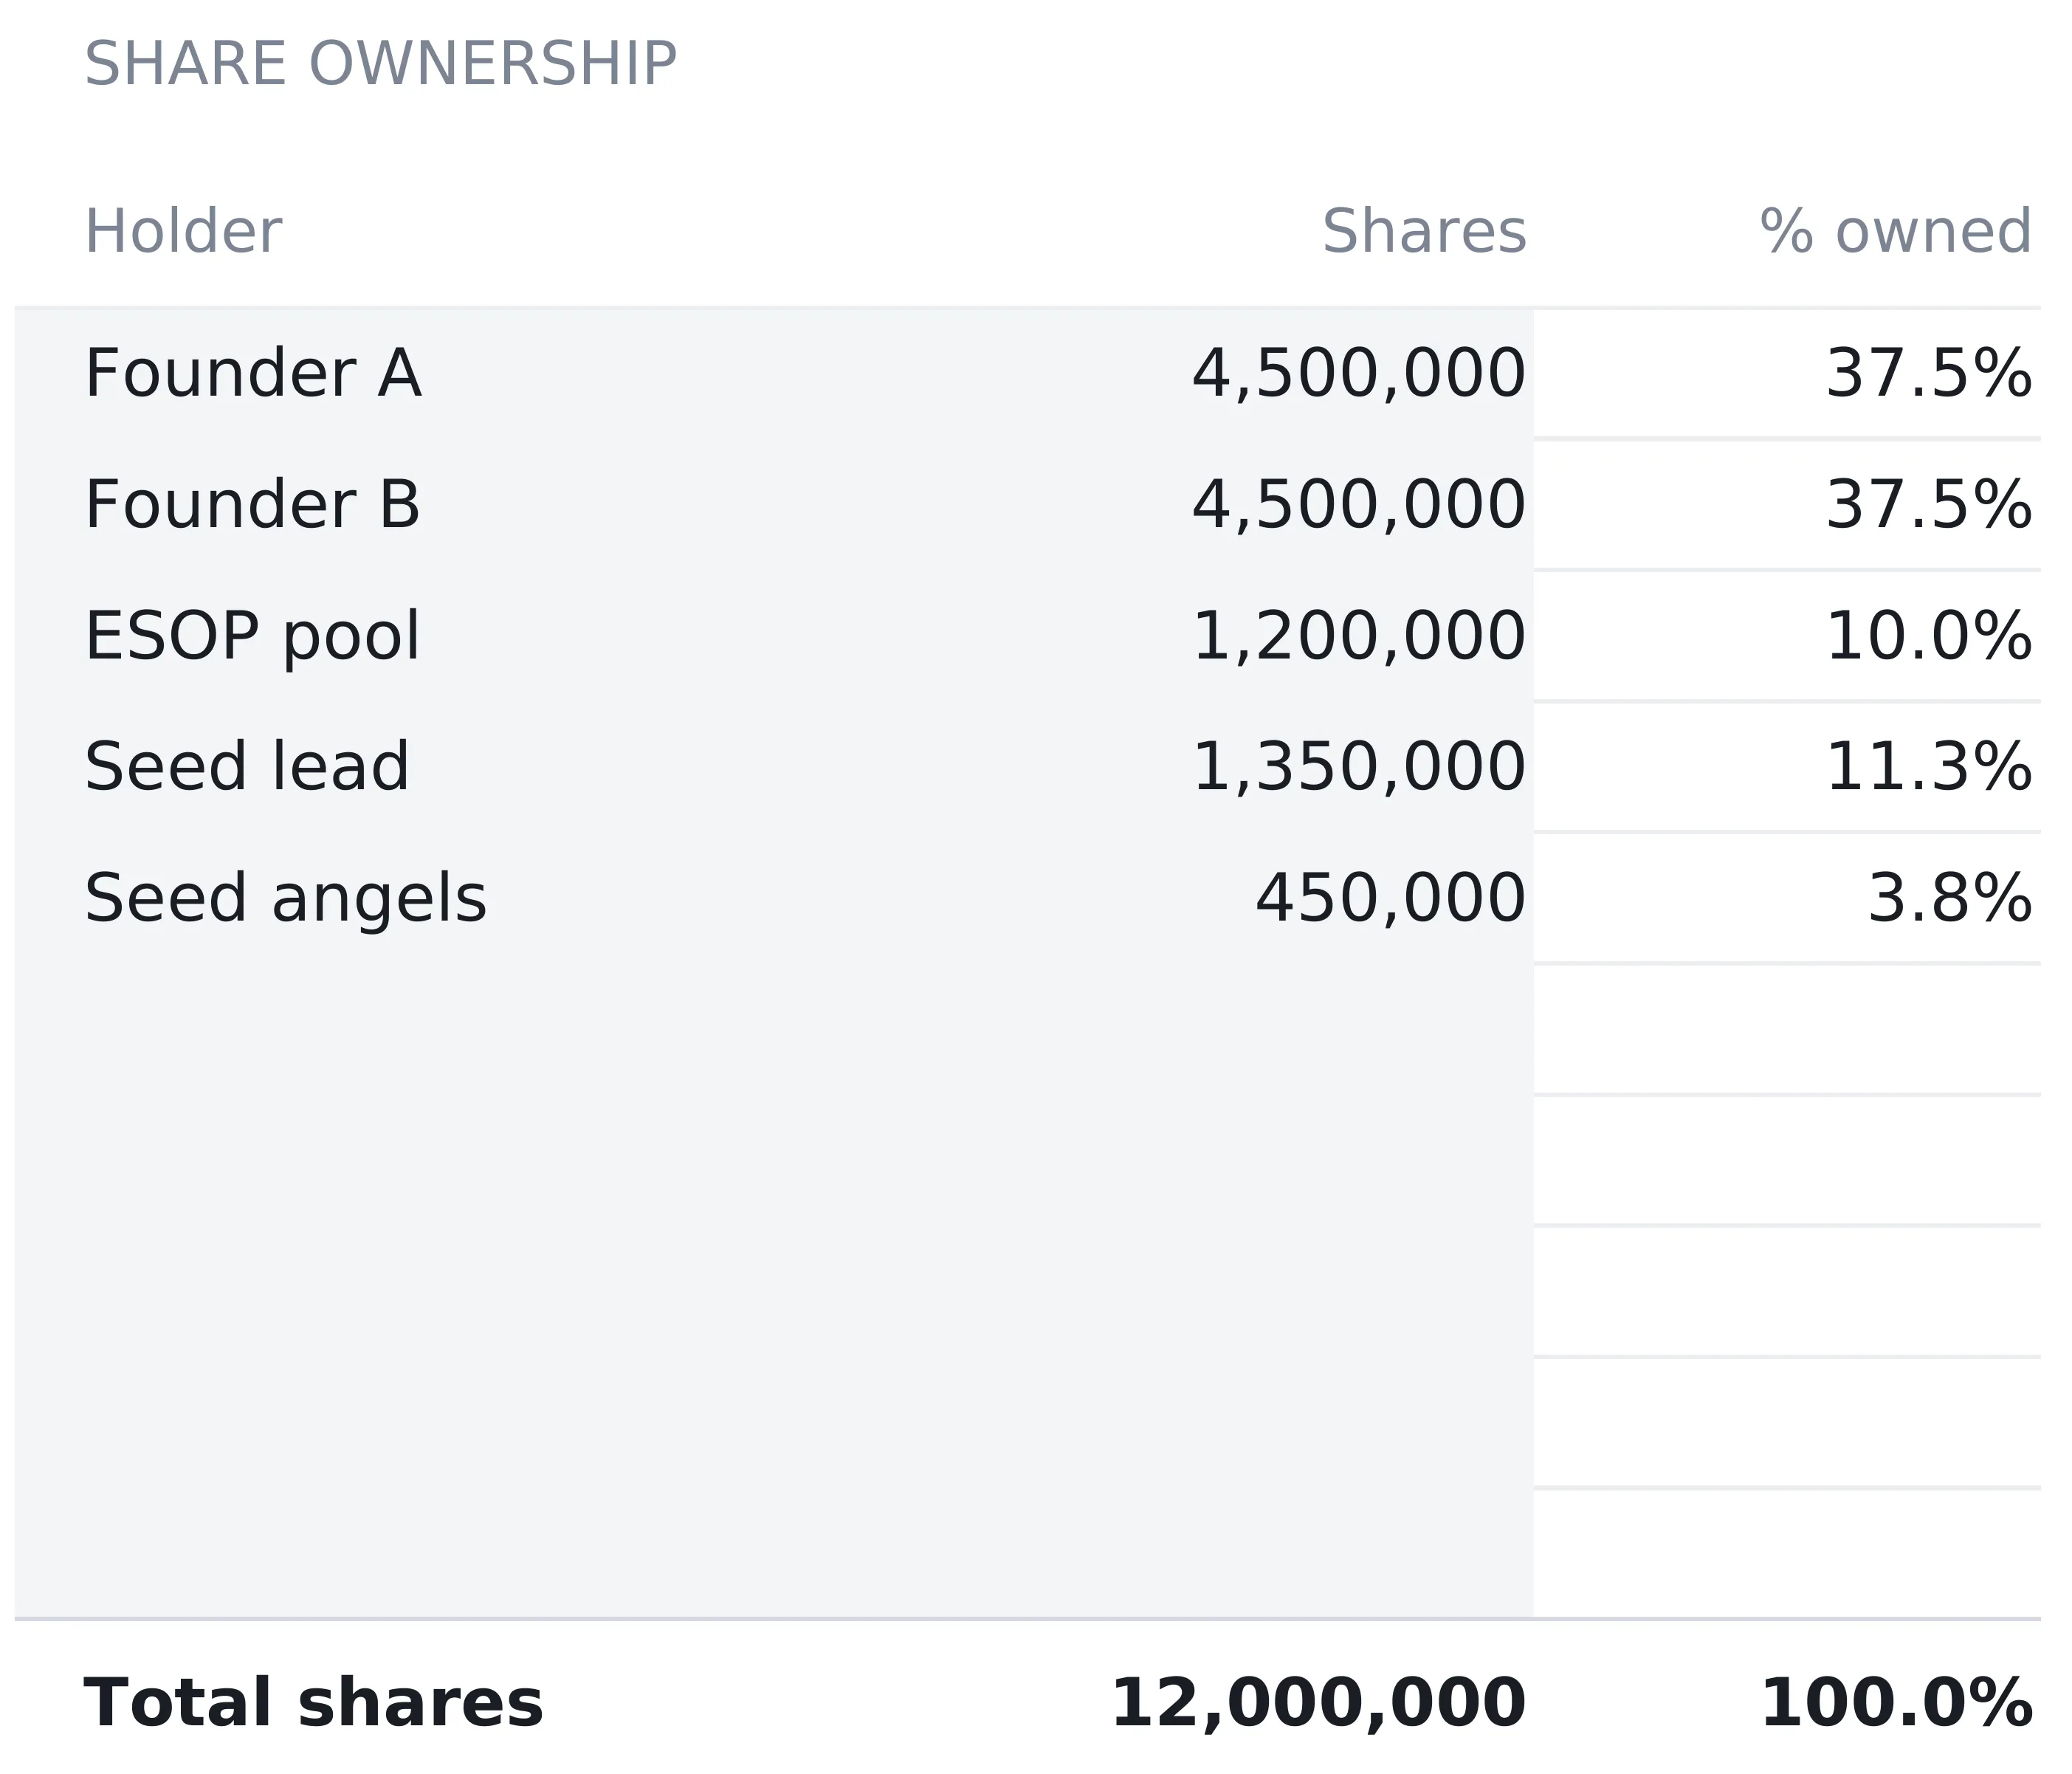
Ten rows with two typed cells each, holder and share count. The percentage column divides each holding by the total and is never typed.
The sample register holds 12,000,000 shares: Founder A and Founder B at 4,500,000 each for 37.5 percent apiece, an ESOP pool of 1,200,000 at 10 percent, a seed lead at 1,350,000 for 11.3 percent, and seed angels at 450,000 for 3.8 percent.
The last two lines are the interesting pair. The seed investors hold 1,800,000 shares between them, which is exactly 15 percent of the total and matches the dilution typed against the seed round on the Funding sheet. The two sheets agree, but they agree because someone made them agree. There is no formula connecting them.
The bridge round makes the same point in reverse. It carries a 5 percent dilution figure on the Funding sheet and has no holder on the Cap Table at all, so it does not touch the ownership chart or the founder percentage. This is documented behaviour rather than a gap. The sheet holds shares already issued, and a round still ahead in the plan joins it when its holder and share count are typed into one of the five spare rows.
What the register does not model is the machinery underneath a real cap table. There are no option grants or vesting schedules inside the ESOP line, no share classes or liquidation preferences, and no convertible notes or SAFEs waiting to convert. It is a snapshot of ownership by share count, which is enough to drive the chart and the founder tile and not enough to run a financing.
The dashboard: seven tiles and a status line
With the four input sheets filled, a status line across the top of the Dashboard states the plan in one sentence. In the sample it carries a warning icon and reads that cash is above zero in 20 of 24 modelled months, with month 24 cash at minus 615,000. It flips to a checkmark when all 24 months finish above zero, so a plan that survives its own horizon says so the moment the file opens.
| Tile | Sample value | Where it comes from |
|---|---|---|
| Opening cash | $250,000 | Settings, before any round |
| Raise in plan | $2,300,000 | Total of every round on Funding |
| Initial burn | $62,000 | Total burn in the first modelled month |
| Months cash positive | 20 | Count of the 24 columns where cash ends above zero |
| Headcount M24 | 12 | Headcount in the final column |
| Final cash | -$615,000 | Cash at the end of month 24 |
| Founder % | 75.0% | First two Cap Table rows ÷ total shares |
Two of those tiles read red in the sample, months cash positive and final cash, and both are pointing at the same fact from different angles.
The founder percentage is worth one caution. Its formula adds the first two rows of the Cap Table whatever they happen to be called, so it is positional rather than name-matched. Reordering the register so that an investor sits in row one changes what the tile reports.
Below the tiles, two charts do the reading for you. A 24-month cash projection line traces the slide, the bridge spike in 2027-03, and the crossing into negative territory in 2027-09. An ownership bar chart plots each holder’s percentage, with room for all ten register rows.
What this model deliberately leaves out
There is no revenue line anywhere in the workbook. Cash moves on burn and raises only. That is a real constraint rather than an omission to work around, and it defines the audience. A pre-revenue or early-revenue company gets a spending plan worth modelling, where a revenue curve would be invention. A company with real sales to forecast needs a structure with a revenue row, which is a different workbook and the subject of how to forecast cash flow for a small business.
Costs do not drift. Base opex stays at $30,000 for all 24 months with no inflation, and loaded costs stay flat, so nobody in the sample gets a raise across two years. Both are easy to adjust by hand and neither happens automatically.
The horizon is fixed at 24 months, one company per file, and the model is pre-tax throughout with no working capital, no receivables timing, and no capital expenditure.
The dashboard also reports months cash positive rather than a runway figure in months. Given a burn that runs from $62,000 to $180,000, dividing cash by burn would produce a different answer in every column. The sheet carries the balance forward month by month instead and counts what survives. The trade-off is that there is no single runway number to quote in a board update.
Excel or Google Sheets for a startup financial model
The template is an .xlsx file built on plain formulas, with no macros and no add-ons, so it behaves the same in Microsoft Excel and in Google Sheets after upload. Which one fits depends on how the model gets used rather than on the model itself. A file shared by link suits co-founders arguing about hire dates in the same document, while a local file suits keeping successive versions of a plan on one machine. Neither platform changes the four formulas above, which is why the structure described here is buildable by hand in either.
The one thing a hand-built version tends to skip is the validation guard described above. Typing a hard-coded number over a computed cell is a common way a model stops adding up without anyone noticing, and the guard turns that into a visible warning.
Which startup spreadsheet template fits which job
- Startup Financial Model Spreadsheet Template ($59) is the workbook this walkthrough follows: funding rounds, a hiring plan, the 24-month burn and runway grid, a simplified cap table, and the seven-tile dashboard, for one company on the spending side.
- SaaS Metrics & Financial Model Spreadsheet Template ($59) is the subscription-business counterpart, built around a 12-month MRR waterfall, cohort retention, and unit economics such as LTV to CAC and payback, alongside spending and runway.
- 5-Year Financial Projections Spreadsheet Template ($49) covers the case where the revenue line is the point. It runs a three-statement five-year forecast from per-year assumptions, with a P&L, a simplified balance sheet, and a cash flow that tie out across years.
- The Startup Founder Bundle collects this model with the 5-year projections and Business Valuation ($49), listed at $89 against $157 for the three bought separately.
Related
- How to Forecast Cash Flow for a Small Business - the same carry-forward arithmetic applied to a business with revenue coming in
- Cash Flow Forecast Templates for Small Business - what free forecast templates cover and where they stop
- Google Sheets vs Excel for Business Cash Flow - the trade-offs between the two platforms for a working model
Frequently asked questions
What is the difference between burn rate and runway in this model?
Burn rate is a row and runway is what the cash row does with it. Total burn is computed for every one of the 24 months, and in the sample it starts at $62,000 and ends at $180,000. A single division of cash by burn would therefore give a different answer in every column. The workbook does not print a runway-in-months figure. It carries cash forward month by month instead, and the dashboard reports how many of the 24 months finish above zero, which is 20 in the sample.
Why does total dilution read 19.3 percent when the two rounds are 15 percent and 5 percent?
Because the Funding sheet compounds the rounds rather than adding them. The formula multiplies what survives each round, so 0.85 times 0.95 leaves 80.75 percent and the dilution is 19.25 percent, which displays as 19.3 percent. Adding the two would give 20 percent. The difference is the 5 percent bridge diluting the 85 percent that survived the seed rather than the original 100 percent.
Does the cap table update when a funding round is added?
No, and that is by design. The Cap Table sheet holds shares already issued, and its percentages are share counts divided by the total. The bridge round sitting at month 14 on the Funding sheet carries a 5 percent dilution figure but has no holder or share count on the Cap Table. It does not move the ownership chart until one of the five spare rows is filled in. The sample keeps the two consistent by hand: the seed lead and seed angels hold 1,800,000 shares between them, which is 15 percent of the 12,000,000 total, matching the seed round's dilution entry.
Can the model include revenue?
Not in this workbook. The Burn & Runway grid has six rows, headcount, cumulative hire cost, base opex, total burn, raises, and cash at end of month, and cash moves only on burn and raises. It models the spending side of an early-stage company where revenue is still an open question. A model that needs a revenue line is a different structure, either a three-statement forecast or a metrics-driven operating model.
Can the horizon be longer than 24 months?
The horizon is fixed at 24 months. The Burn & Runway grid is 24 columns wide, every sheet header reads 24-mo horizon, and the dashboard counts months cash positive out of 24. The plan start year and month on Settings move which calendar months those columns are named after, running 2026-01 to 2027-12 in the sample. They do not change how many columns there are.
Sources
- Form D - U.S. Securities and Exchange Commission (Investor.gov)
About this article
Every figure, sheet name, formula, and feature description verified against the published Startup Financial Model Pro workbook (the exact file customers download). Form D reference checked against the live SEC Investor.gov glossary page at writing time. Last reviewed August 2026.