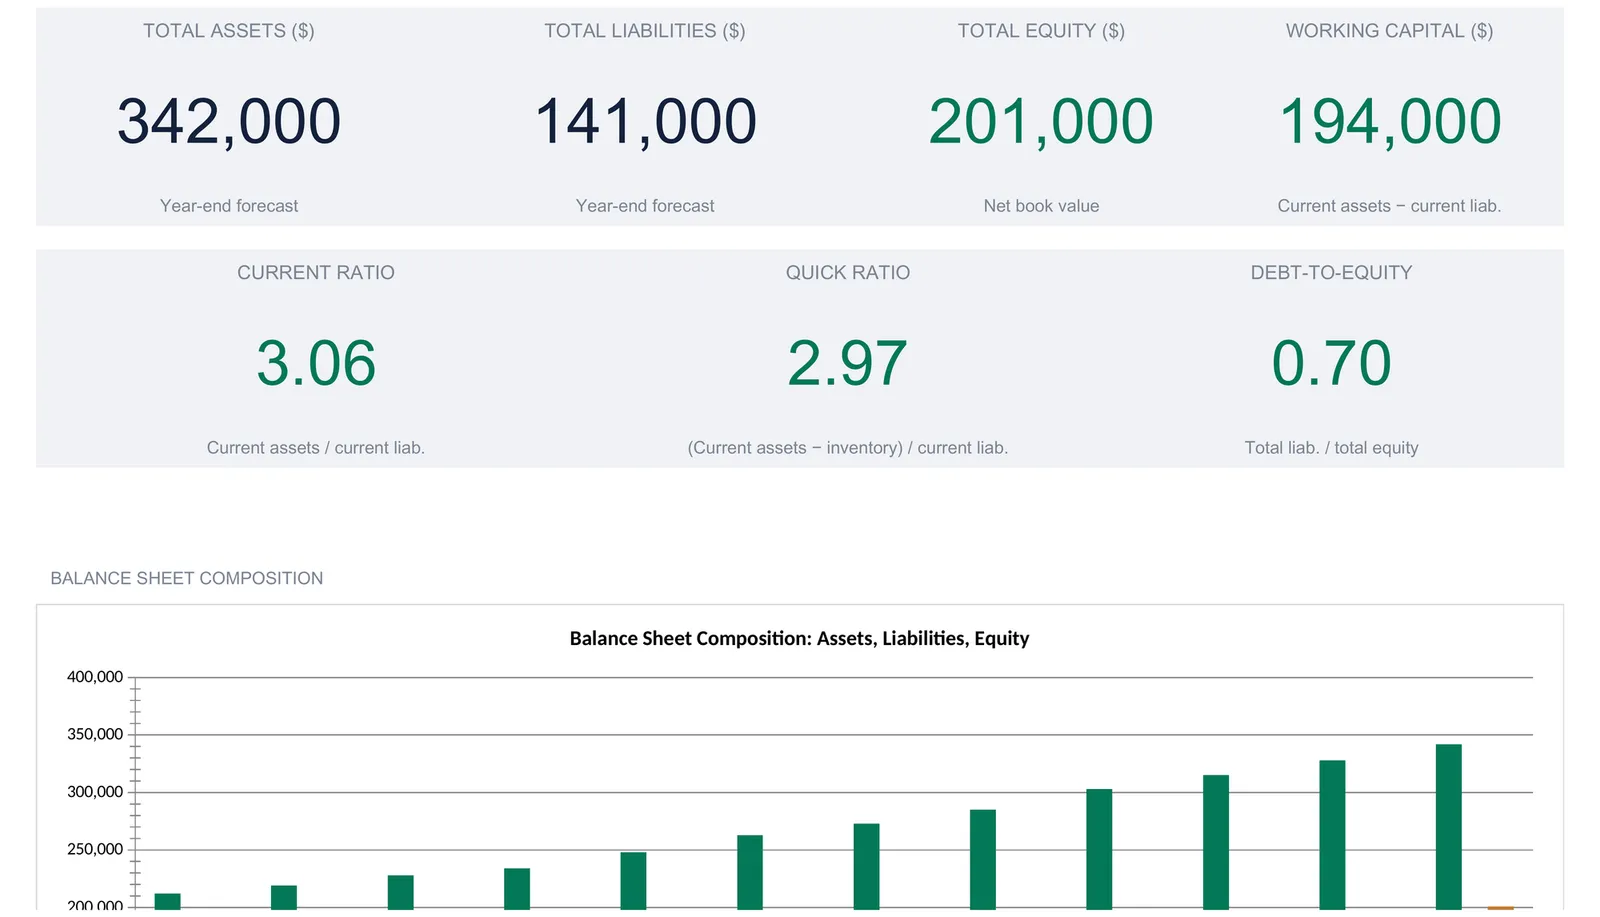
A business balance sheet is one identity repeated every month: assets equal liabilities plus equity. This walkthrough builds it in a spreadsheet the way the Balance Sheet Spreadsheet Template ($29) does, with a forecast sheet and a matching actual sheet of twelve month-end columns, a variance comparison, and liquidity and solvency ratios. The worked example runs a company to a year-end 342,000 in assets against 141,000 in liabilities and 201,000 in equity, with a 3.06 current ratio and 194,000 of working capital.
Most business owners can read their bank balance and their sales figure without help. The balance sheet is the statement that trips them up, because it does not describe money moving. It describes money sitting still. A balance sheet is a photograph of what a company owns and what it owes on one specific date. The U.S. Small Business Administration calls it “the foundation of managing your finances,” a snapshot that tracks assets, liabilities, and equity together. The trouble is that a photograph taken once a year tells you almost nothing about the direction things are heading.
The fix is to take the photograph every month, in a place where the underlying numbers stay editable and the ratios update themselves. A spreadsheet does that well. The structure below comes from our Balance Sheet Spreadsheet Template ($29), which lays out a full fiscal year of monthly snapshots for Excel and Google Sheets, plus a plan-versus-reality comparison and a set of liquidity and solvency ratios. The whole thing is reproducible by hand if you would rather build your own, and the walkthrough follows the sheets in the order the template itself tells you to work through them.
The one identity a balance sheet is built on
Everything on a balance sheet obeys a single equation:
Assets = Liabilities + Equity
Read plainly, it says that everything a business owns was paid for one of two ways: with money it borrowed or owes (liabilities) or with money the owners put in and left in (equity). The two sides are not independent totals that happen to be close. They are the same value described from two directions, so they must match to the penny on every date. That is why the document is called a balance sheet, and it is why a workbook version can check itself: if the two sides ever disagree, a number was typed wrong.
Two further ideas shape how the numbers are grouped:
- Snapshot, not flow. A balance sheet has no “for the month of March” about it. Each column is a balance at one instant, the last day of a month. Nothing accumulates across columns the way revenue accumulates on an income statement. The SEC lists the balance sheet alongside the income statement and the cash flow statement as one of the core statements precisely because it answers a different question from the other two: position, not activity.
- Current versus long-term. Both assets and liabilities are split by timing. Current items are the ones expected to convert to cash or fall due within a year; non-current items sit beyond that horizon. This split is not bookkeeping fussiness. It is what makes the liquidity ratios possible, because those ratios compare short-term assets against short-term bills.
The template gives each part of this its own space: a Settings sheet for the constants, a Forecast sheet and a matching Actual sheet that each hold the twelve monthly snapshots, a Variance sheet that compares the two, a Ratios sheet, and a Dashboard on top. A How to Use sheet carries the instructions.
Start with the constants: the Settings sheet
Three fields on the Settings sheet feed the rest of the workbook, so they come first and take about a minute.
Business name. Typed once, it appears as the heading on the Dashboard and on each of the data sheets.
Currency symbol. A dropdown offers 35 symbols, from the dollar and euro through the rupee, real, zloty, and dirham. Choosing one relabels every money column and KPI across the workbook. As the How to Use sheet is careful to state, this changes the label only and does not convert the underlying numbers, so a figure of 342,000 stays 342,000 whether it is shown with a dollar sign or a euro sign.
Fiscal year. A single year, 2026 in the sample, which prints in the header strip next to the currency symbol so a saved copy is dated.
The sheet also explains the two ways to reshape the line items. Asset, liability, and equity labels are renamed directly on the Forecast and Actual sheets rather than through a settings table. And because current assets and current liabilities each end with a blank Other line that already sits inside the subtotal, a one-off extra category needs no setup at all; you type into the spare line and the totals absorb it.

Build the plan: the Forecast sheet
The Forecast sheet is where a balance sheet template earns its keep, because it is not a single snapshot but twelve of them side by side, January through December, with a year-end column at the right. Each column is a complete balance sheet for that month-end, and the sections stack in the standard order.
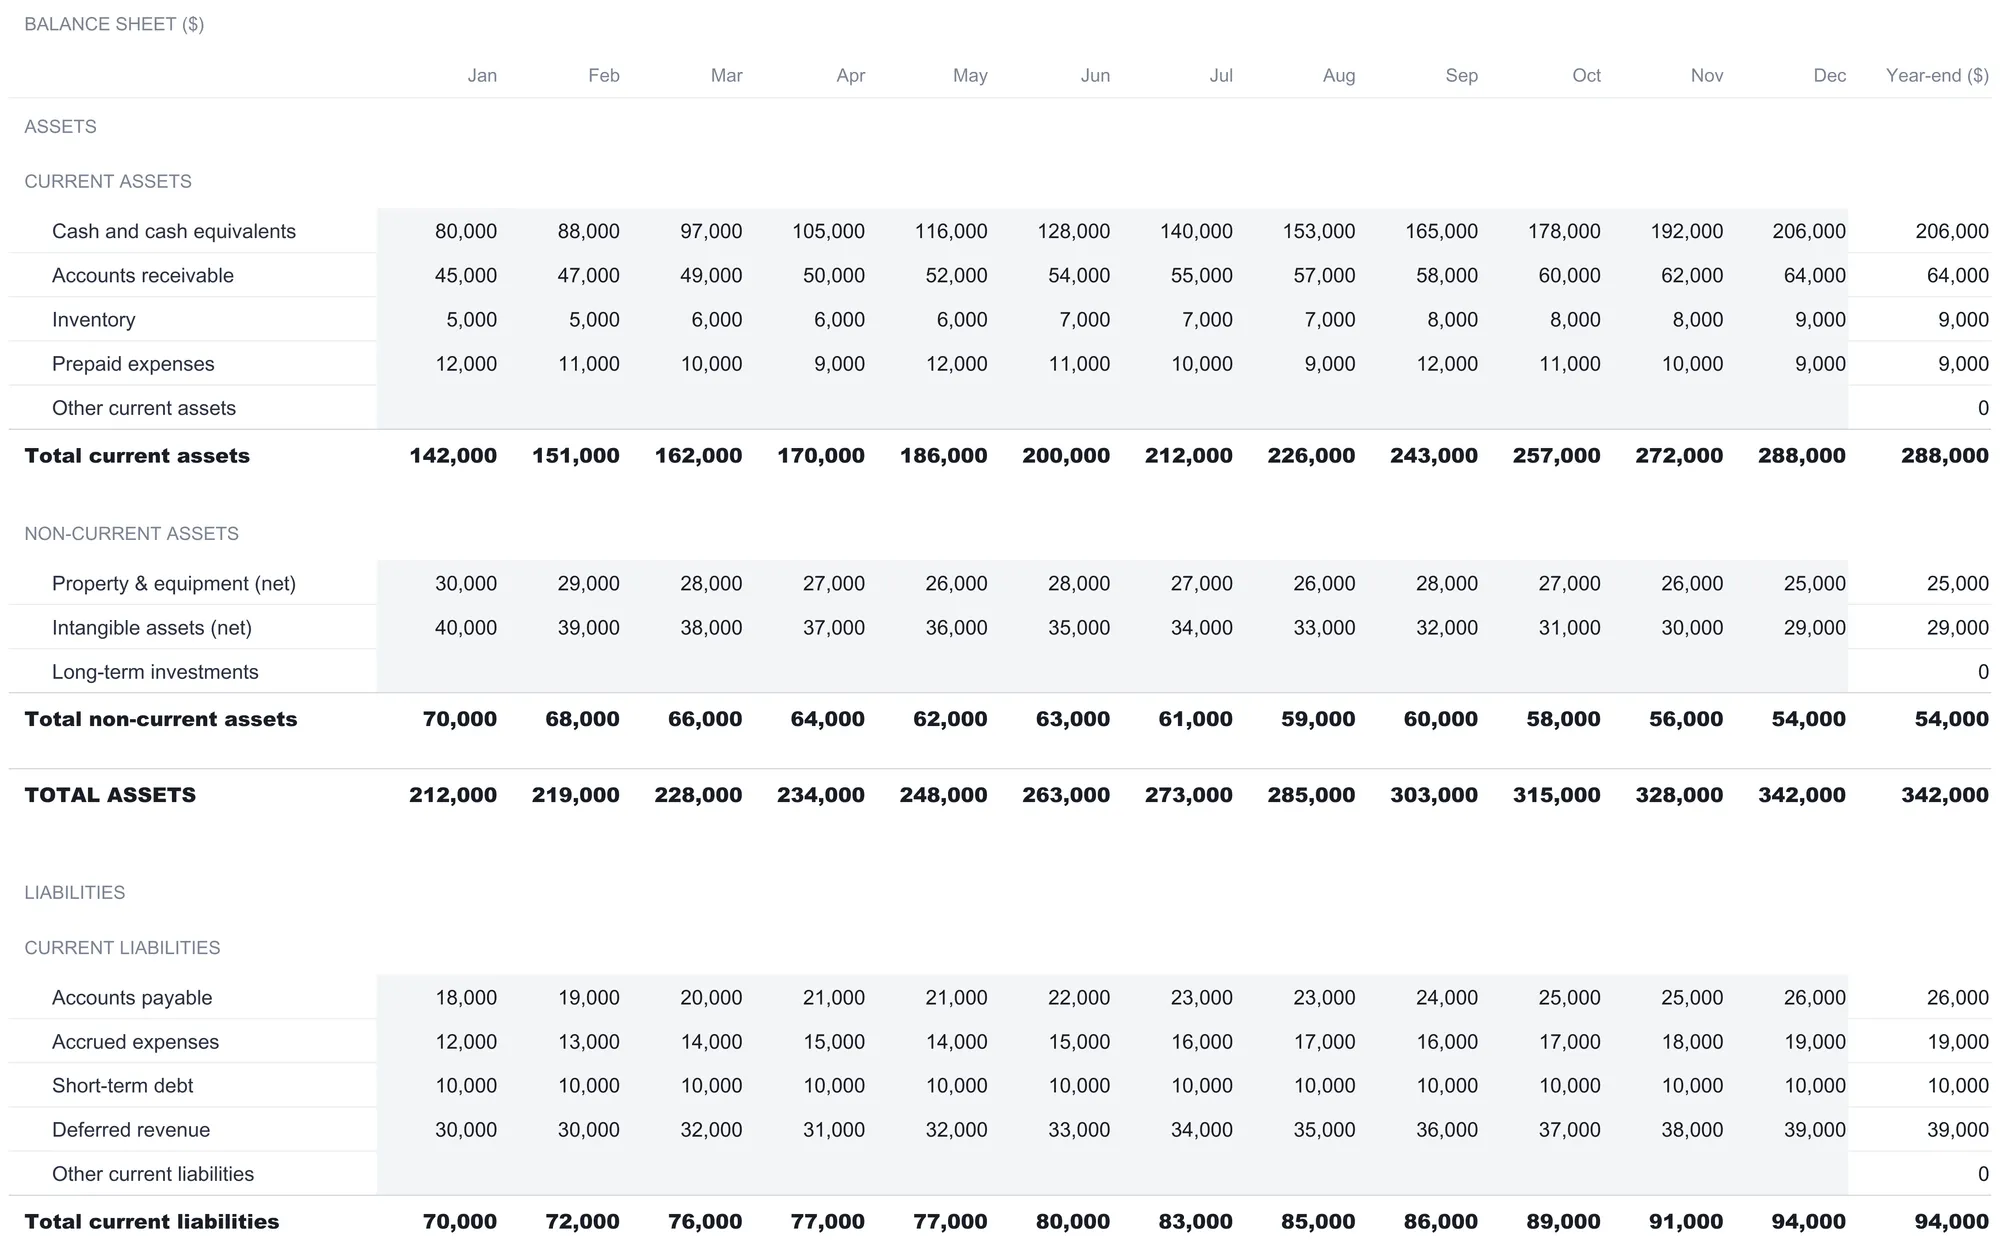
Under assets, the current assets block lists cash and cash equivalents, accounts receivable, inventory, prepaid expenses, and the spare Other line, and a formula sums them into total current assets. Below it, the non-current assets block lists property and equipment (net), intangible assets (net), and long-term investments, summing to total non-current assets. Adding the two subtotals gives total assets.
Under liabilities, the same shape repeats. Current liabilities gather accounts payable, accrued expenses, short-term debt, and deferred revenue; non-current liabilities gather long-term debt and deferred tax liability. The two subtotals add to total liabilities.
Under equity sit paid-in capital and retained earnings, summing to total equity. A final line adds total liabilities and total equity together, and this is the number that must equal total assets.
The cells you type into are the input lines: the individual assets, liabilities, and equity accounts. Every subtotal and total is a formula, so you never type a sum. That matters more here than on a simpler sheet, because a balance sheet has subtotals nested inside subtotals, and hand-keying any of them is how the two sides drift apart.
One row at the bottom of the sheet does the self-checking. Labelled “Balance check (should be 0),” it subtracts total liabilities plus equity from total assets in every column. When the books balance, the whole row reads zero. If any month is off, that column shows the gap in red, and the How to Use sheet flags a non-zero balance check as a data entry error to fix before going further. It is a small thing that quietly rules out the most common mistake in a hand-built balance sheet.
A worked year-end column
Take December in the sample, which doubles as the year-end snapshot. On the asset side, current assets total 288,000: cash of 206,000, receivables of 64,000, inventory of 9,000, and prepaid expenses of 9,000. Non-current assets total 54,000, from property and equipment of 25,000 and intangibles of 29,000. Total assets come to 288,000 + 54,000 = 342,000.
On the other side, current liabilities total 94,000: payables of 26,000, accrued expenses of 19,000, short-term debt of 10,000, and deferred revenue of 39,000. Non-current liabilities add long-term debt of 39,000 and deferred tax of 8,000 for 47,000, so total liabilities are 141,000. Equity is paid-in capital of 25,000 plus retained earnings of 176,000, which is 201,000.
Now the identity closes: 141,000 in liabilities plus 201,000 in equity equals 342,000, exactly the total assets figure. The balance check row reads zero. That is the entire discipline of a balance sheet in one column, and the sample walks it up month by month from a January position of 212,000 in total assets to the December 342,000.
What each line actually means
The section headings do a lot of work, but the individual lines are where a balance sheet is read, so it helps to know what each one holds before filling it in. The template ships with the standard set, and every one of them is a line you can rename on the Forecast and Actual sheets to match how your own books are kept.
On the current asset side, cash and cash equivalents is the most liquid line, covering bank balances and anything a step away from cash. Accounts receivable is money already earned but not yet collected, the invoices customers still owe. Inventory is goods bought or made and not yet sold, and it is the line the quick ratio later sets aside because it can be the slowest to convert. Prepaid expenses are bills paid ahead, such as an insurance premium covering months still to come, which count as an asset until the coverage is used up. In the sample these four move differently over the year: cash climbs steadily from 80,000 to 206,000 while inventory stays small, ending the year at 9,000, which is the kind of divergence a per-line monthly layout is meant to show.
Among non-current assets, property and equipment (net) is the book value of physical assets after depreciation, and the word net matters, since the figure falls as depreciation accumulates rather than tracking what the gear would sell for. Intangible assets (net) covers non-physical holdings such as software or goodwill, again net of amortization. Long-term investments are holdings not expected to be sold within the year, left at zero in the sample.
On the current liability side, accounts payable is the mirror of receivables, money owed to suppliers for goods and services already received. Accrued expenses are costs incurred but not yet billed or paid, such as wages earned in the last days of a month. Short-term debt is borrowing due within the year. Deferred revenue is the one that surprises people: it is cash a customer has already paid for work not yet delivered, and it sits as a liability because the business still owes the delivery. Among non-current liabilities, long-term debt is borrowing due beyond a year, and deferred tax liability is tax owed in future periods rather than now.
Equity carries two lines. Paid-in capital is what owners or shareholders put in directly and is static in the sample at 25,000. Retained earnings is the profit the business has kept rather than distributed, and it is the line that grows as the company earns; in the sample it rises from 62,000 in January to 176,000 by December. That single line is the bridge to the income statement, because the profit a profit and loss statement measures is what flows into retained earnings here.
Record reality: the Actual sheet
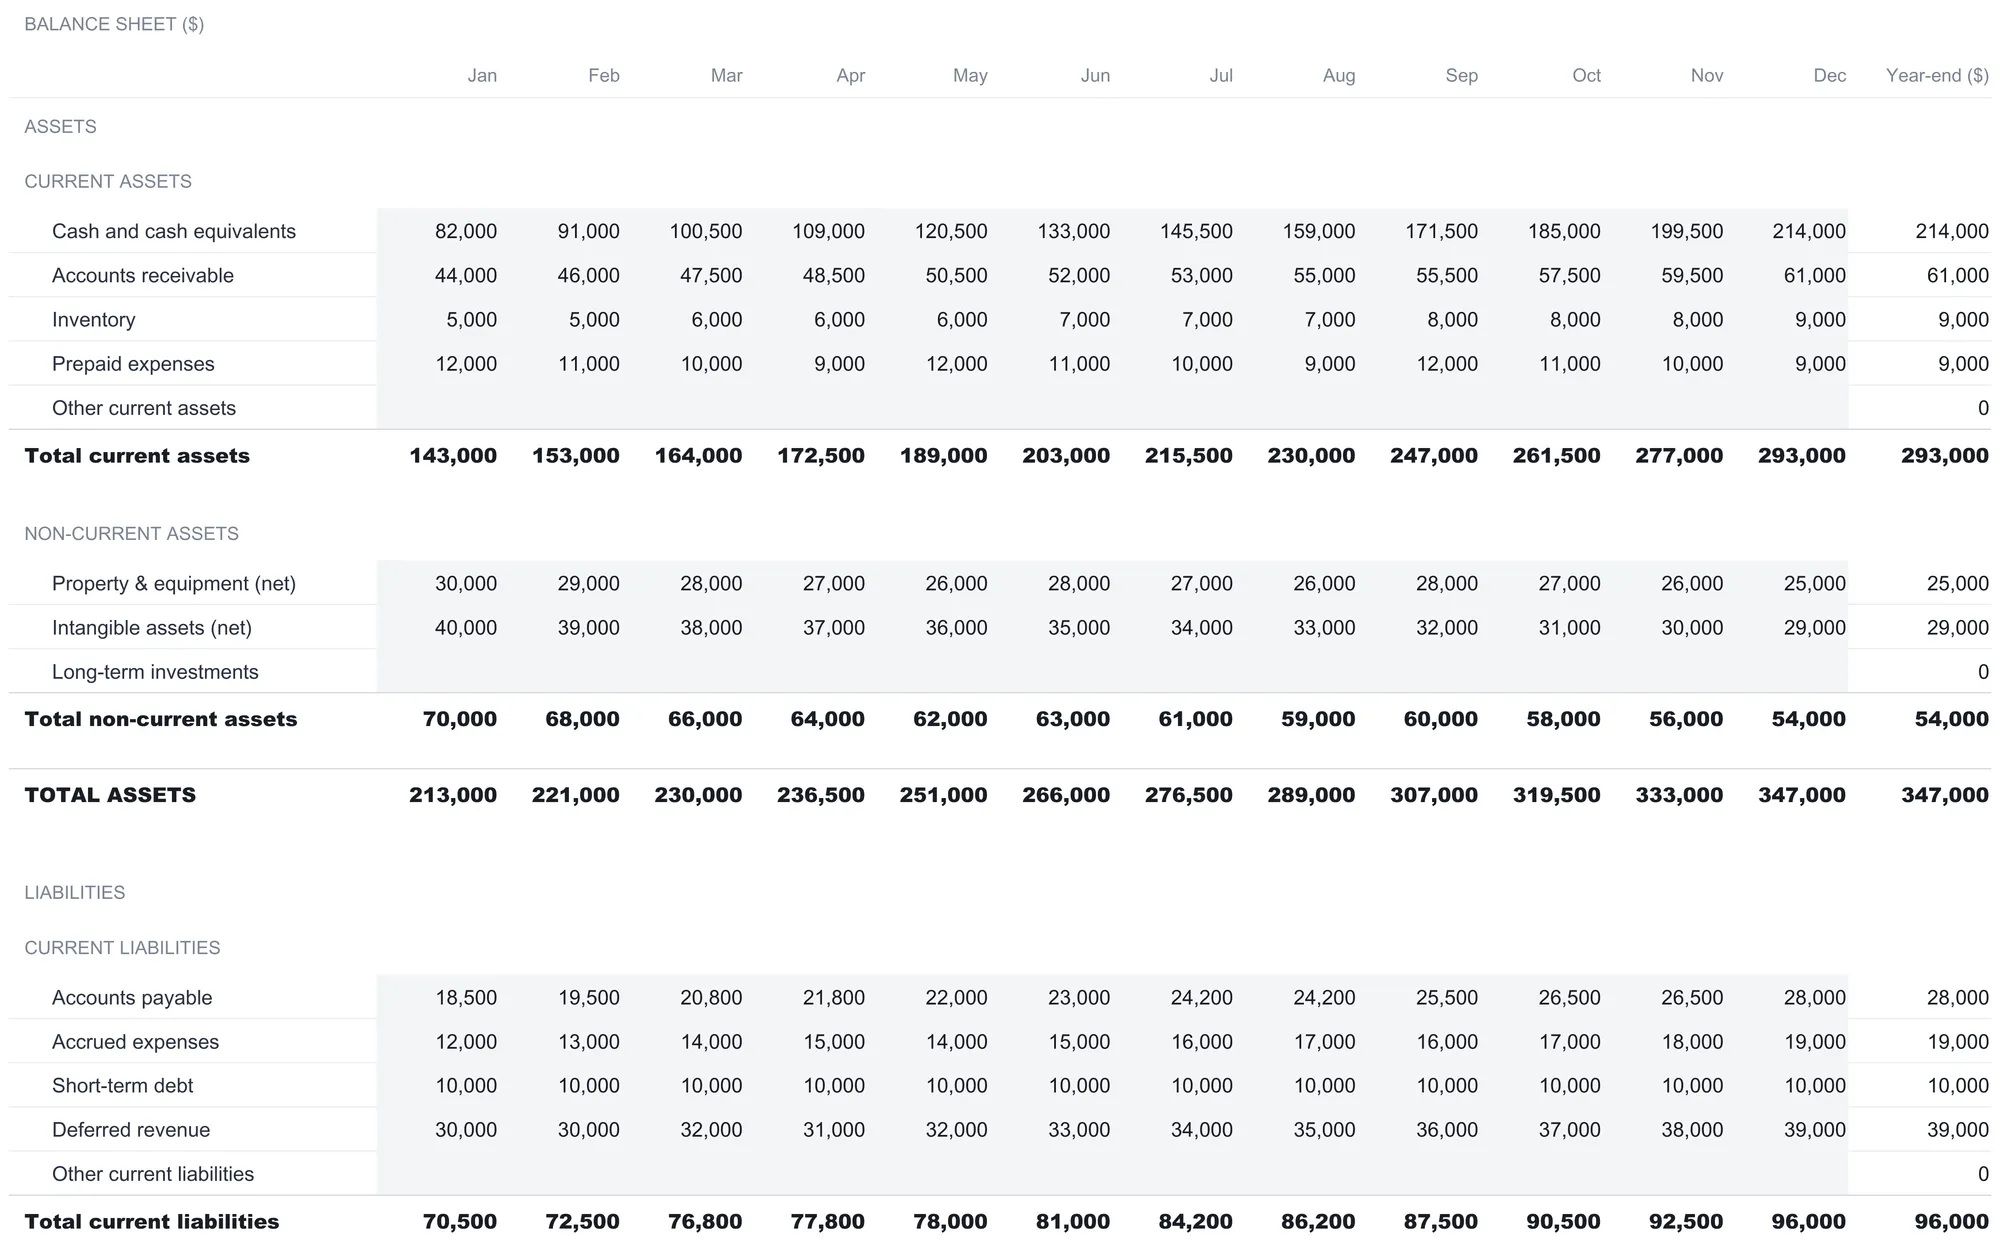
The Actual sheet is a mirror image of the Forecast sheet, identical in layout, and it holds the real month-end balances as each month closes. Keeping the plan and the record on separate sheets rather than overwriting the forecast is what preserves the comparison; the target stays visible next to the outcome all year.
In the sample, the actuals run a touch ahead of plan. December closes at 293,000 in current assets and 347,000 in total assets, against forecasts of 288,000 and 342,000. Cash lands at 214,000 rather than the projected 206,000, while receivables come in at 61,000 rather than 64,000. Total liabilities finish at 143,000 and equity at 204,000. Each Actual column carries its own balance check row, so the recorded snapshots have to balance just as the forecast ones do.
The reason to fill this in every month rather than once at year-end is that a balance sheet taken annually can hide a swing that opened and closed inside the year. A receivables balance that ballooned in the summer and was collected by December leaves no trace in a single December photograph, yet it may have been the tightest cash moment of the year. Twelve columns catch it; one does not. The monthly cadence is also what makes the comparison views legible later, since the actual line on each trend chart, the Variance table, and the actual working-capital line on the Ratios sheet are all built from these month-end balances. Entering the actuals as each month closes, while the numbers are fresh, turns the year-end review into a read of a finished record rather than a scramble to reconstruct one.
Compare plan to reality: the Variance sheet
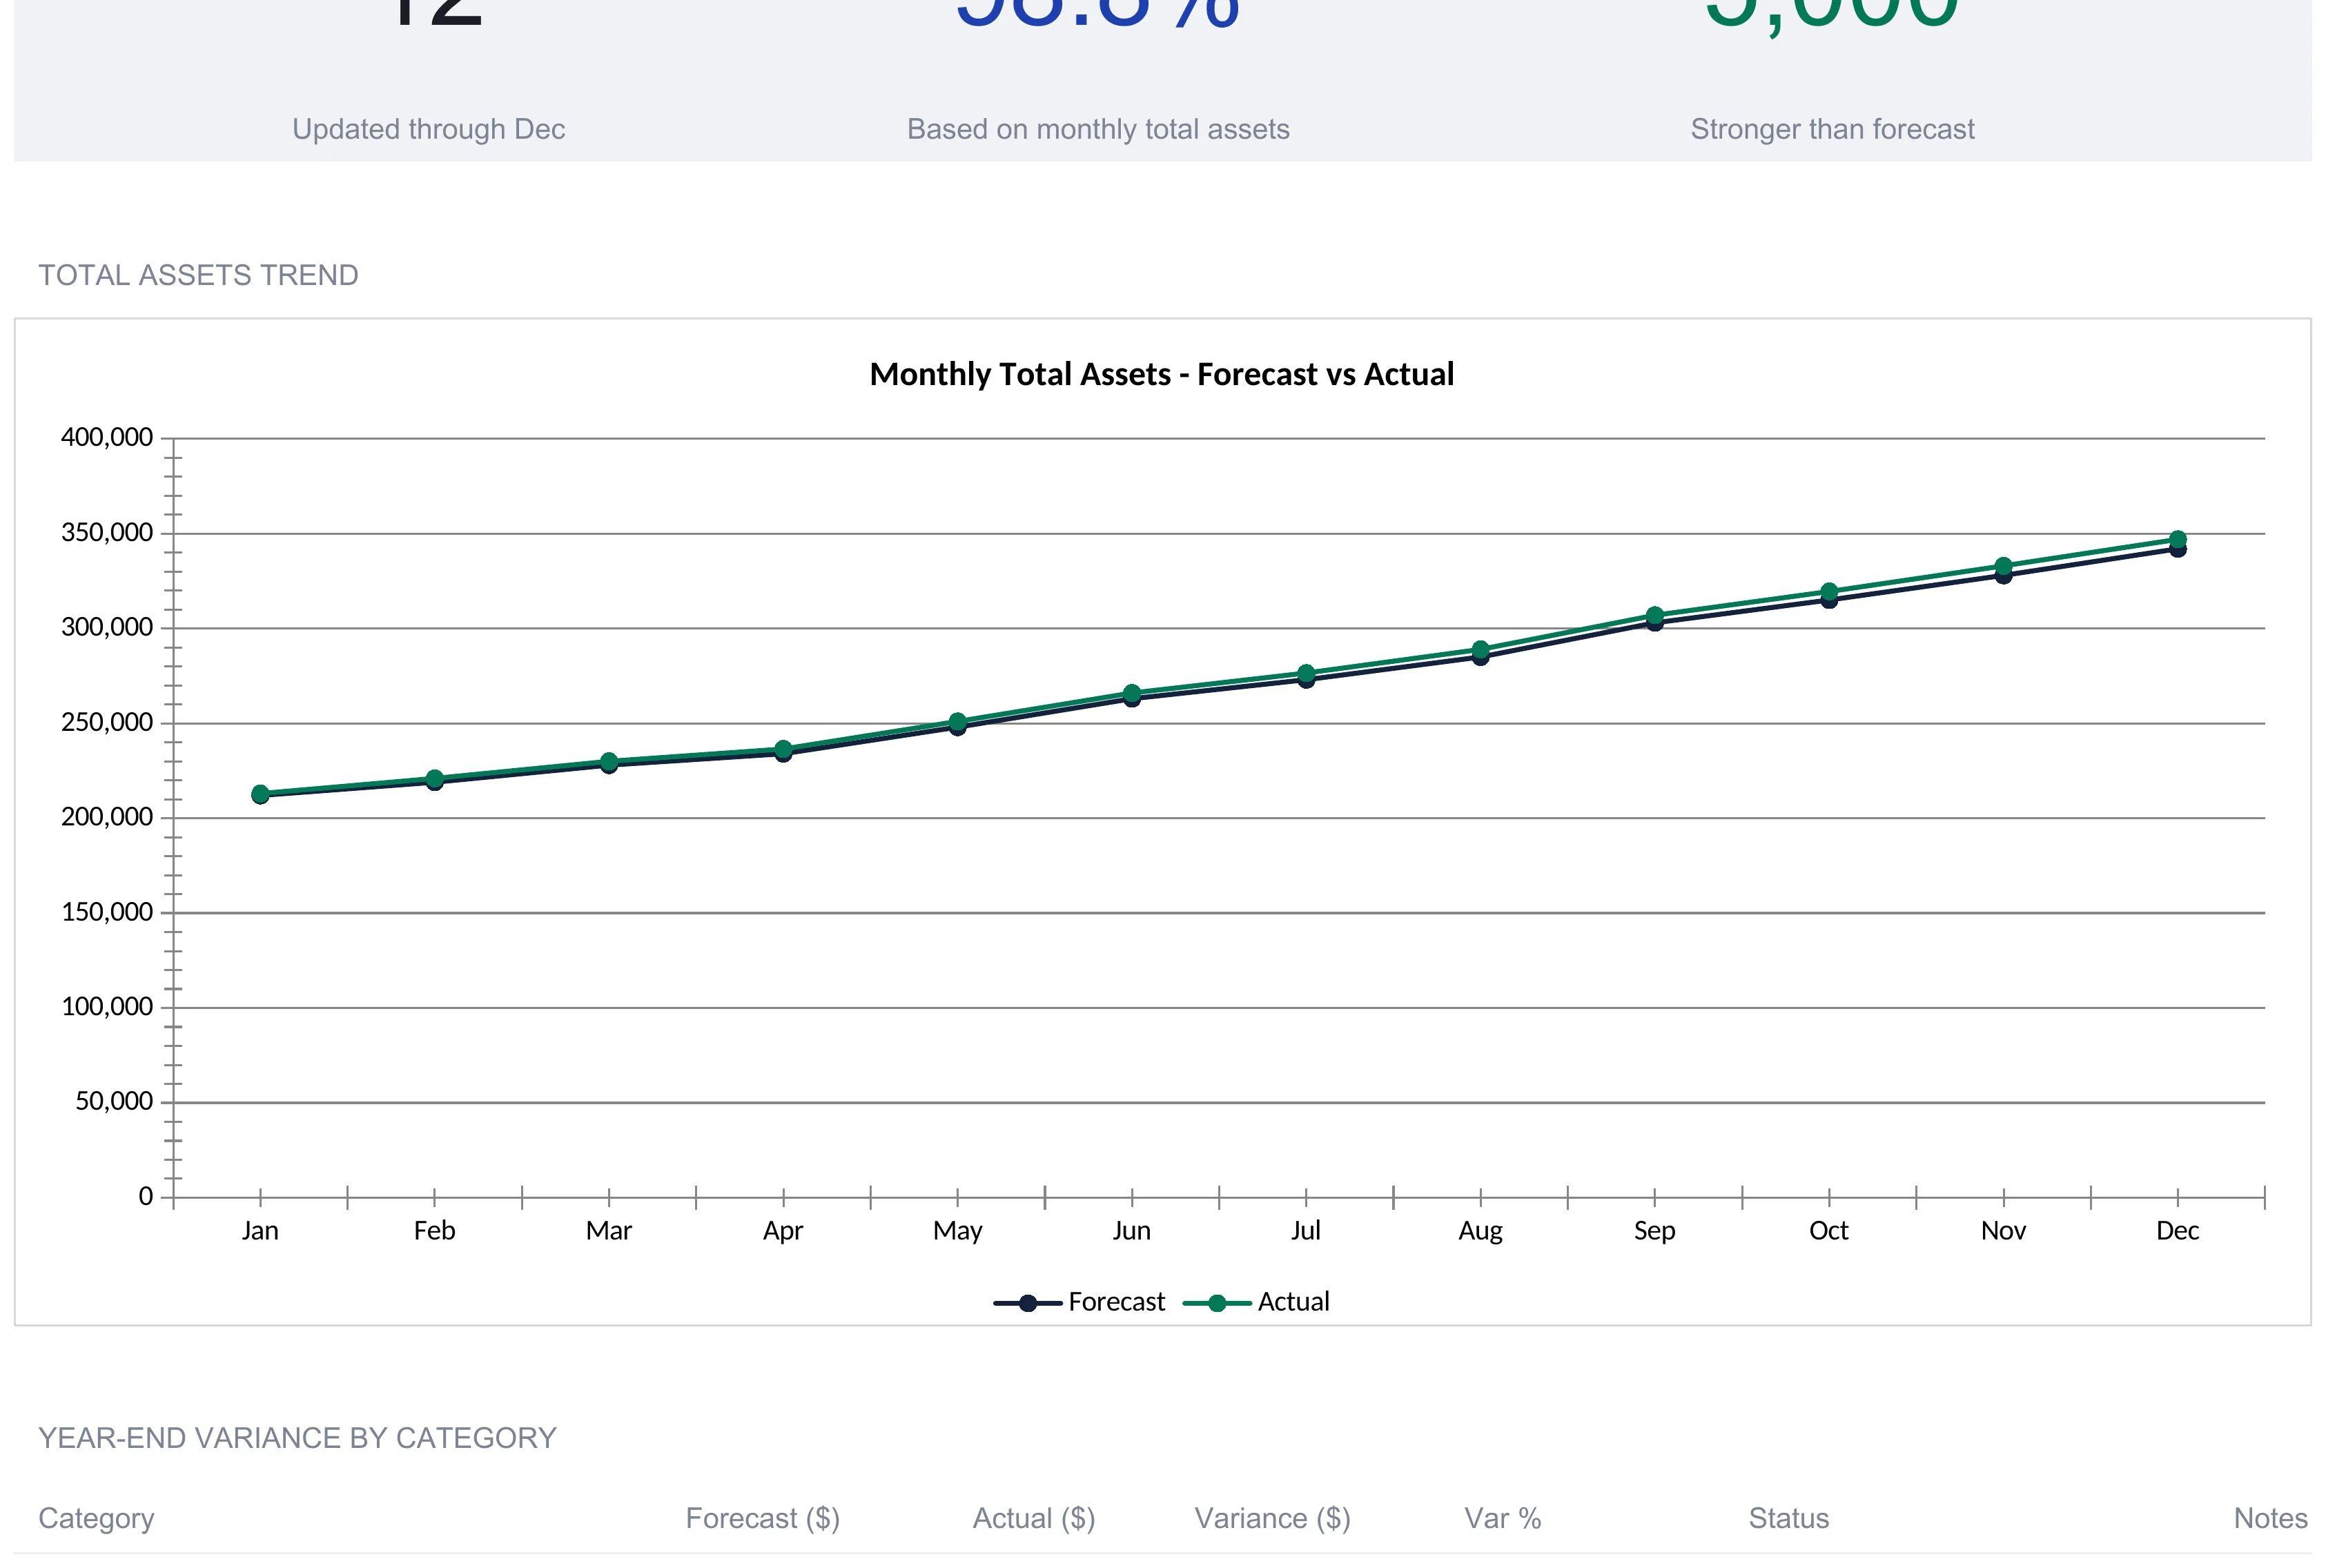
With both sides filled, the Variance sheet does the arithmetic of holding the year to account. A status line at the top reads the whole picture in one sentence; in the sample it reports “Stronger than forecast: total assets +5,000 at year-end (1.5%).” Three summary figures sit below it: twelve months recorded, an average forecast accuracy of 98.8 percent across the monthly total-assets figures, and a year-end total-assets difference of +5,000. A trend chart plots forecast against actual total assets across the twelve months, the two lines running close together all year.
The heart of the sheet is a line-by-line table that lays every category’s forecast next to its actual, with the difference in currency and in percent, a plain-language status, and a notes column. In the sample, cash comes in above plan by 8,000 (+3.9 percent) while receivables land below plan by 3,000 (-4.7 percent). Total assets finish 5,000 above plan, total liabilities 2,000 above, and retained earnings 3,000 above.
A note at the foot of the sheet points out the one subtlety in reading these signs: for assets and equity, a positive variance is favorable, but for liabilities a negative variance is favorable, because owing less than planned is the good outcome. That is why the sheet labels a liability that comes in higher than forecast as “over plan” rather than dressing it up. The same note repeats the rule that the balance check must read zero every month, since a variance table built on an unbalanced sheet would only spread the error.
Read the health: the Ratios sheet
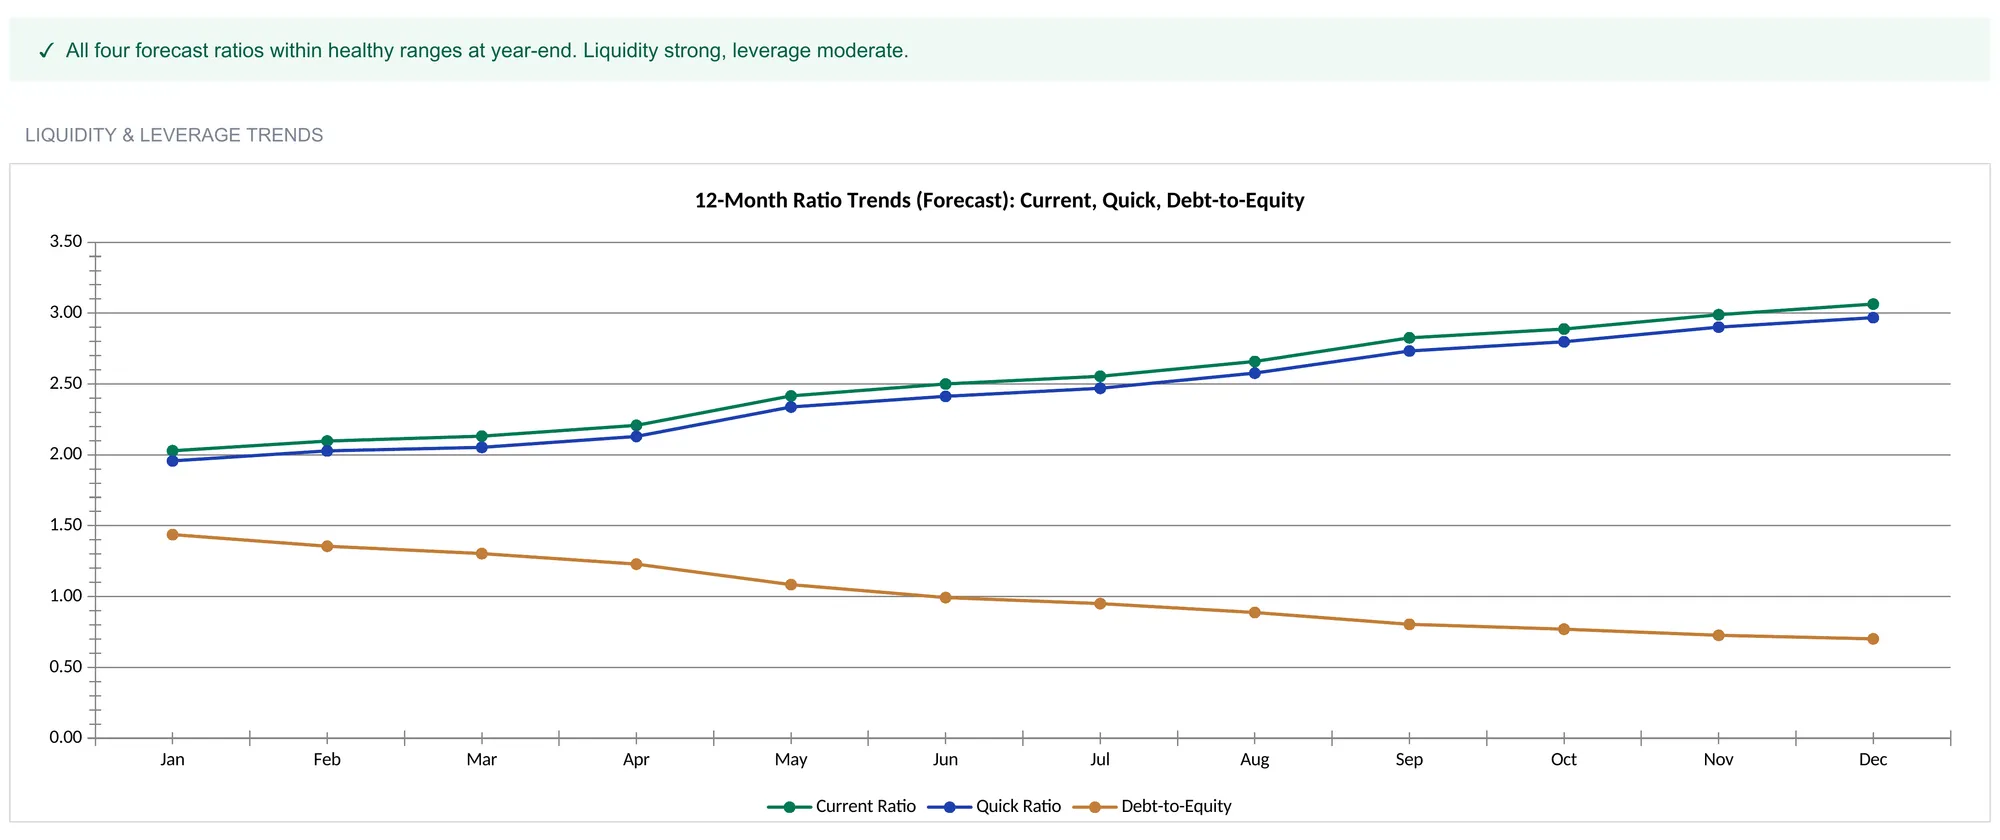
Totals tell you the size of a business. Ratios tell you its condition, and the Ratios sheet turns the monthly balances into four measures, each plotted across the twelve months and each graded against a plain threshold. A status line summarizes the verdict; in the sample it reads “All four forecast ratios within healthy ranges at year-end. Liquidity strong, leverage moderate.”
Here is what each one means, in ordinary terms, with the sample’s year-end forecast figures.
Current ratio is current assets divided by current liabilities, and it asks a blunt question: could the business cover everything due within a year using the assets that turn to cash within a year? At year-end the sample holds 288,000 in current assets against 94,000 in current liabilities, a ratio of 3.06. The template treats anything at or above 1.5 as healthy. A ratio under 1 would mean short-term bills outrun short-term assets.
Quick ratio is the same idea with inventory stripped out of the numerator, on the reasoning that inventory can be the slowest current asset to sell. That single exclusion is the entire difference between the two. Removing the 9,000 of inventory leaves 279,000 over 94,000, a quick ratio of 2.97, comfortably above the template’s threshold of 1.
Debt-to-equity compares total liabilities against total equity, or what a business owes against what the owners hold. At 141,000 over 201,000 the sample sits at 0.70, meaning liabilities are about seven-tenths the size of equity. The template flags this as healthy below 1. A notes line adds the important caveat that a figure above 1 is not automatically bad, since capital-intensive industries such as manufacturing and real estate routinely run higher; healthy ranges are conservative defaults, not universal rules.
Working capital is the plainest of the four, current assets minus current liabilities: 288,000 - 94,000 = 194,000. It is the cushion left over after every short-term bill is paid, and the template notes that the trend matters more than the absolute number, because a working-capital line that is drifting down signals cash being tied up even while it stays positive.
The chart shows the direction those ratios travel over the year. The sample’s current and quick ratios climb from around 2.0 in January to roughly 3.0 by December, while debt-to-equity falls from about 1.44 to 0.70 as retained earnings build and equity grows faster than debt. A second chart on the sheet plots working capital, forecast against actual, both rising steadily through the year. Reading a ratio as a moving line rather than a single year-end value is most of what makes the sheet useful, because a healthy number that is quietly deteriorating is a different story from a healthy number holding steady.
The Dashboard: the year on one screen
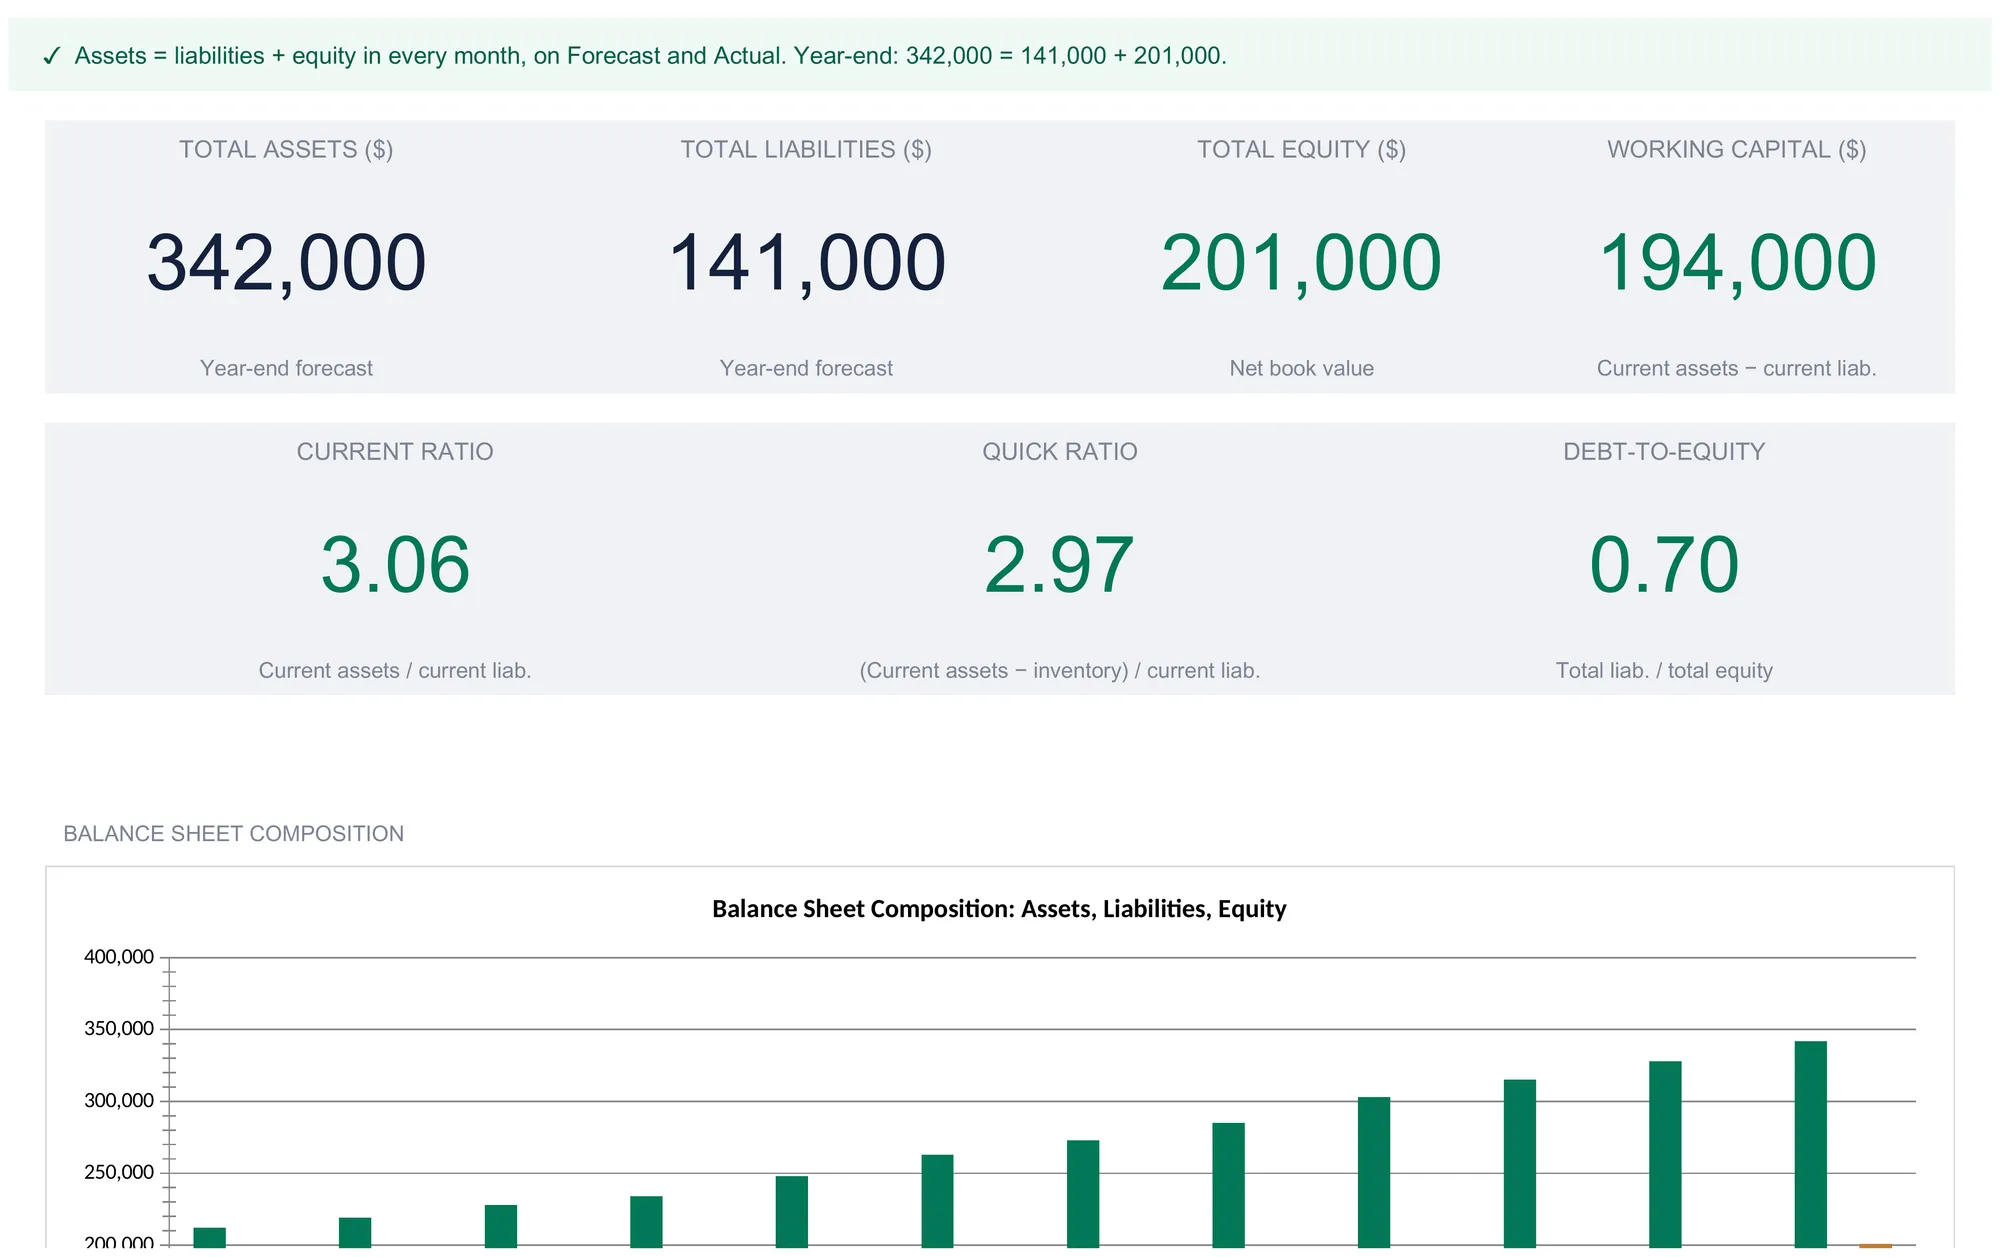
The Dashboard pulls the year into a single view. Four headline tiles show total assets of 342,000, total liabilities of 141,000, total equity of 201,000 (labelled net book value), and working capital of 194,000. Three ratio tiles below repeat the current ratio of 3.06, quick ratio of 2.97, and debt-to-equity of 0.70. These read the Forecast sheet, so the dashboard presents the planned year-end position as the headline, with the actuals living on the trend charts and the Variance sheet.
Above the tiles runs a self-checking status line that confirms the identity held all year. In the sample it reads that assets equal liabilities plus equity in every month on both the Forecast and Actual sheets, and states the year-end as 342,000 = 141,000 + 201,000; if any month fell out of balance, the line would switch to a warning and name the size of the gap. Below the tiles, a composition chart stacks assets, liabilities, and equity month by month, a trend chart tracks total assets, and a monthly summary table lists total assets, liabilities, equity, working capital, and the current ratio for every month plus year-end. It is the same data as the input sheets, arranged so a glance answers whether the position is strengthening. Nothing on the dashboard is typed; every tile, chart, and summary row reads from the sheets already filled, which is why it stays correct as the year’s actuals arrive.
Excel or Google Sheets for a balance sheet
The template is a plain .xlsx workbook with no macros and no add-ons, so it behaves the same in Microsoft Excel and in Google Sheets after an upload. The formulas are ordinary sums, subtractions, and divisions of the kind both applications have handled for years. Google Sheets suits an owner who wants the file reachable from any browser and easy to share with a bookkeeper; Excel suits one who prefers a local file and heavier formatting. The structure described here builds identically in either, so the choice is about where you like to work rather than what the balance sheet can do.
Which template fits the job
- Balance Sheet Spreadsheet Template ($29) is the workbook this walkthrough follows: twelve monthly snapshots on a Forecast sheet and a matching Actual sheet, a Variance comparison, the four liquidity and solvency ratios, and a self-checking dashboard, ready for a single fiscal year of assets and liabilities.
- Profit & Loss Statement Spreadsheet Template ($29) is the natural companion, because the balance sheet reports position while the P&L reports the flow of revenue and expenses that produces it. Profit from the P&L is what feeds the retained-earnings line that grew the sample’s equity from 87,000 to 201,000 across the year, so the two statements read most clearly side by side.
- For an individual rather than a business, the same identity drives a much simpler layout. Our walkthrough on how to build a personal balance sheet in Google Sheets covers the assets-minus-liabilities net worth version, without the current-versus-non-current sections or the company ratios.
Related
- How to Build a Profit and Loss Statement in a Spreadsheet - the flow statement that pairs with this snapshot
- How to Do Bookkeeping in a Spreadsheet - where the account balances that fill a balance sheet come from
Frequently asked questions
What is the difference between a balance sheet and a profit and loss statement?
They answer different questions. A profit and loss statement covers a span of time and measures flow: revenue in, expenses out, profit left over across a month or a year. A balance sheet is a single-date snapshot of position: what the business owns and owes at that moment. Profit from the P&L feeds one line on the balance sheet, retained earnings, which is why the two statements are usually kept together rather than one replacing the other.
Do the dashboard ratios show the forecast or the actual figures?
In this template the Dashboard KPIs and ratios read the Forecast sheet, so the current ratio, quick ratio, and debt-to-equity tiles report the planned year-end position. The actual month-end balances you enter appear separately: on the trend charts as a second line against the forecast, and on the Variance sheet line by line. That split lets the dashboard stay a stable plan-of-record while the comparison sheets track how the real numbers land against it.
What counts as a current versus a non-current item?
Current means expected to turn into cash or come due within twelve months. On the asset side that is cash, accounts receivable, inventory, and prepaid expenses; on the liability side, accounts payable, accrued expenses, short-term debt, and deferred revenue. Non-current items sit beyond a year: property and equipment, intangible assets, and long-term investments among assets, and long-term debt and deferred tax among liabilities. The template groups every line under one of those four headings so the subtotals feed the liquidity ratios correctly.
How do I add a line item the template does not have?
Current assets and current liabilities each end with a blank Other line that already sits inside the subtotal, so a single extra category goes there with no other change. For more lines, the Settings sheet notes that you insert a row inside the section, between the section label and the subtotal, and the totals expand to include it automatically. Asset, liability, and equity labels are renamed directly on the Forecast and Actual sheets.
Can I use this to track a personal balance sheet?
The math is the same identity, but the layout here is built for a business, with current versus non-current sections, deferred revenue, paid-in capital, and liquidity ratios that assume a company. For an individual measuring net worth as assets minus liabilities, the simpler personal build is a closer fit; our walkthrough on how to build a personal balance sheet in Google Sheets covers that structure.
Sources
- Manage your finances - U.S. Small Business Administration
- How to Read a 10-K/10-Q - U.S. Securities and Exchange Commission (Investor.gov)
About this article
Template sheets, inputs, formulas and sample figures checked on 2026-09-10 against the shipped Balance Sheet Spreadsheet Template workbook balance-sheet-pro-7f48c6fcf04f.xlsx (Dashboard, Forecast, Actual, Variance, Ratios, Settings, How to Use). The balance sheet as a point-in-time snapshot of assets, liabilities, and equity was checked against the live SBA and SEC Investor.gov pages at writing time. Last reviewed September 2026.