Free Break-Even Analysis Spreadsheet Template
Calculate the break-even point where revenue covers all costs. Enter fixed costs, variable costs, and pricing to see the required sales volume.
What's Included
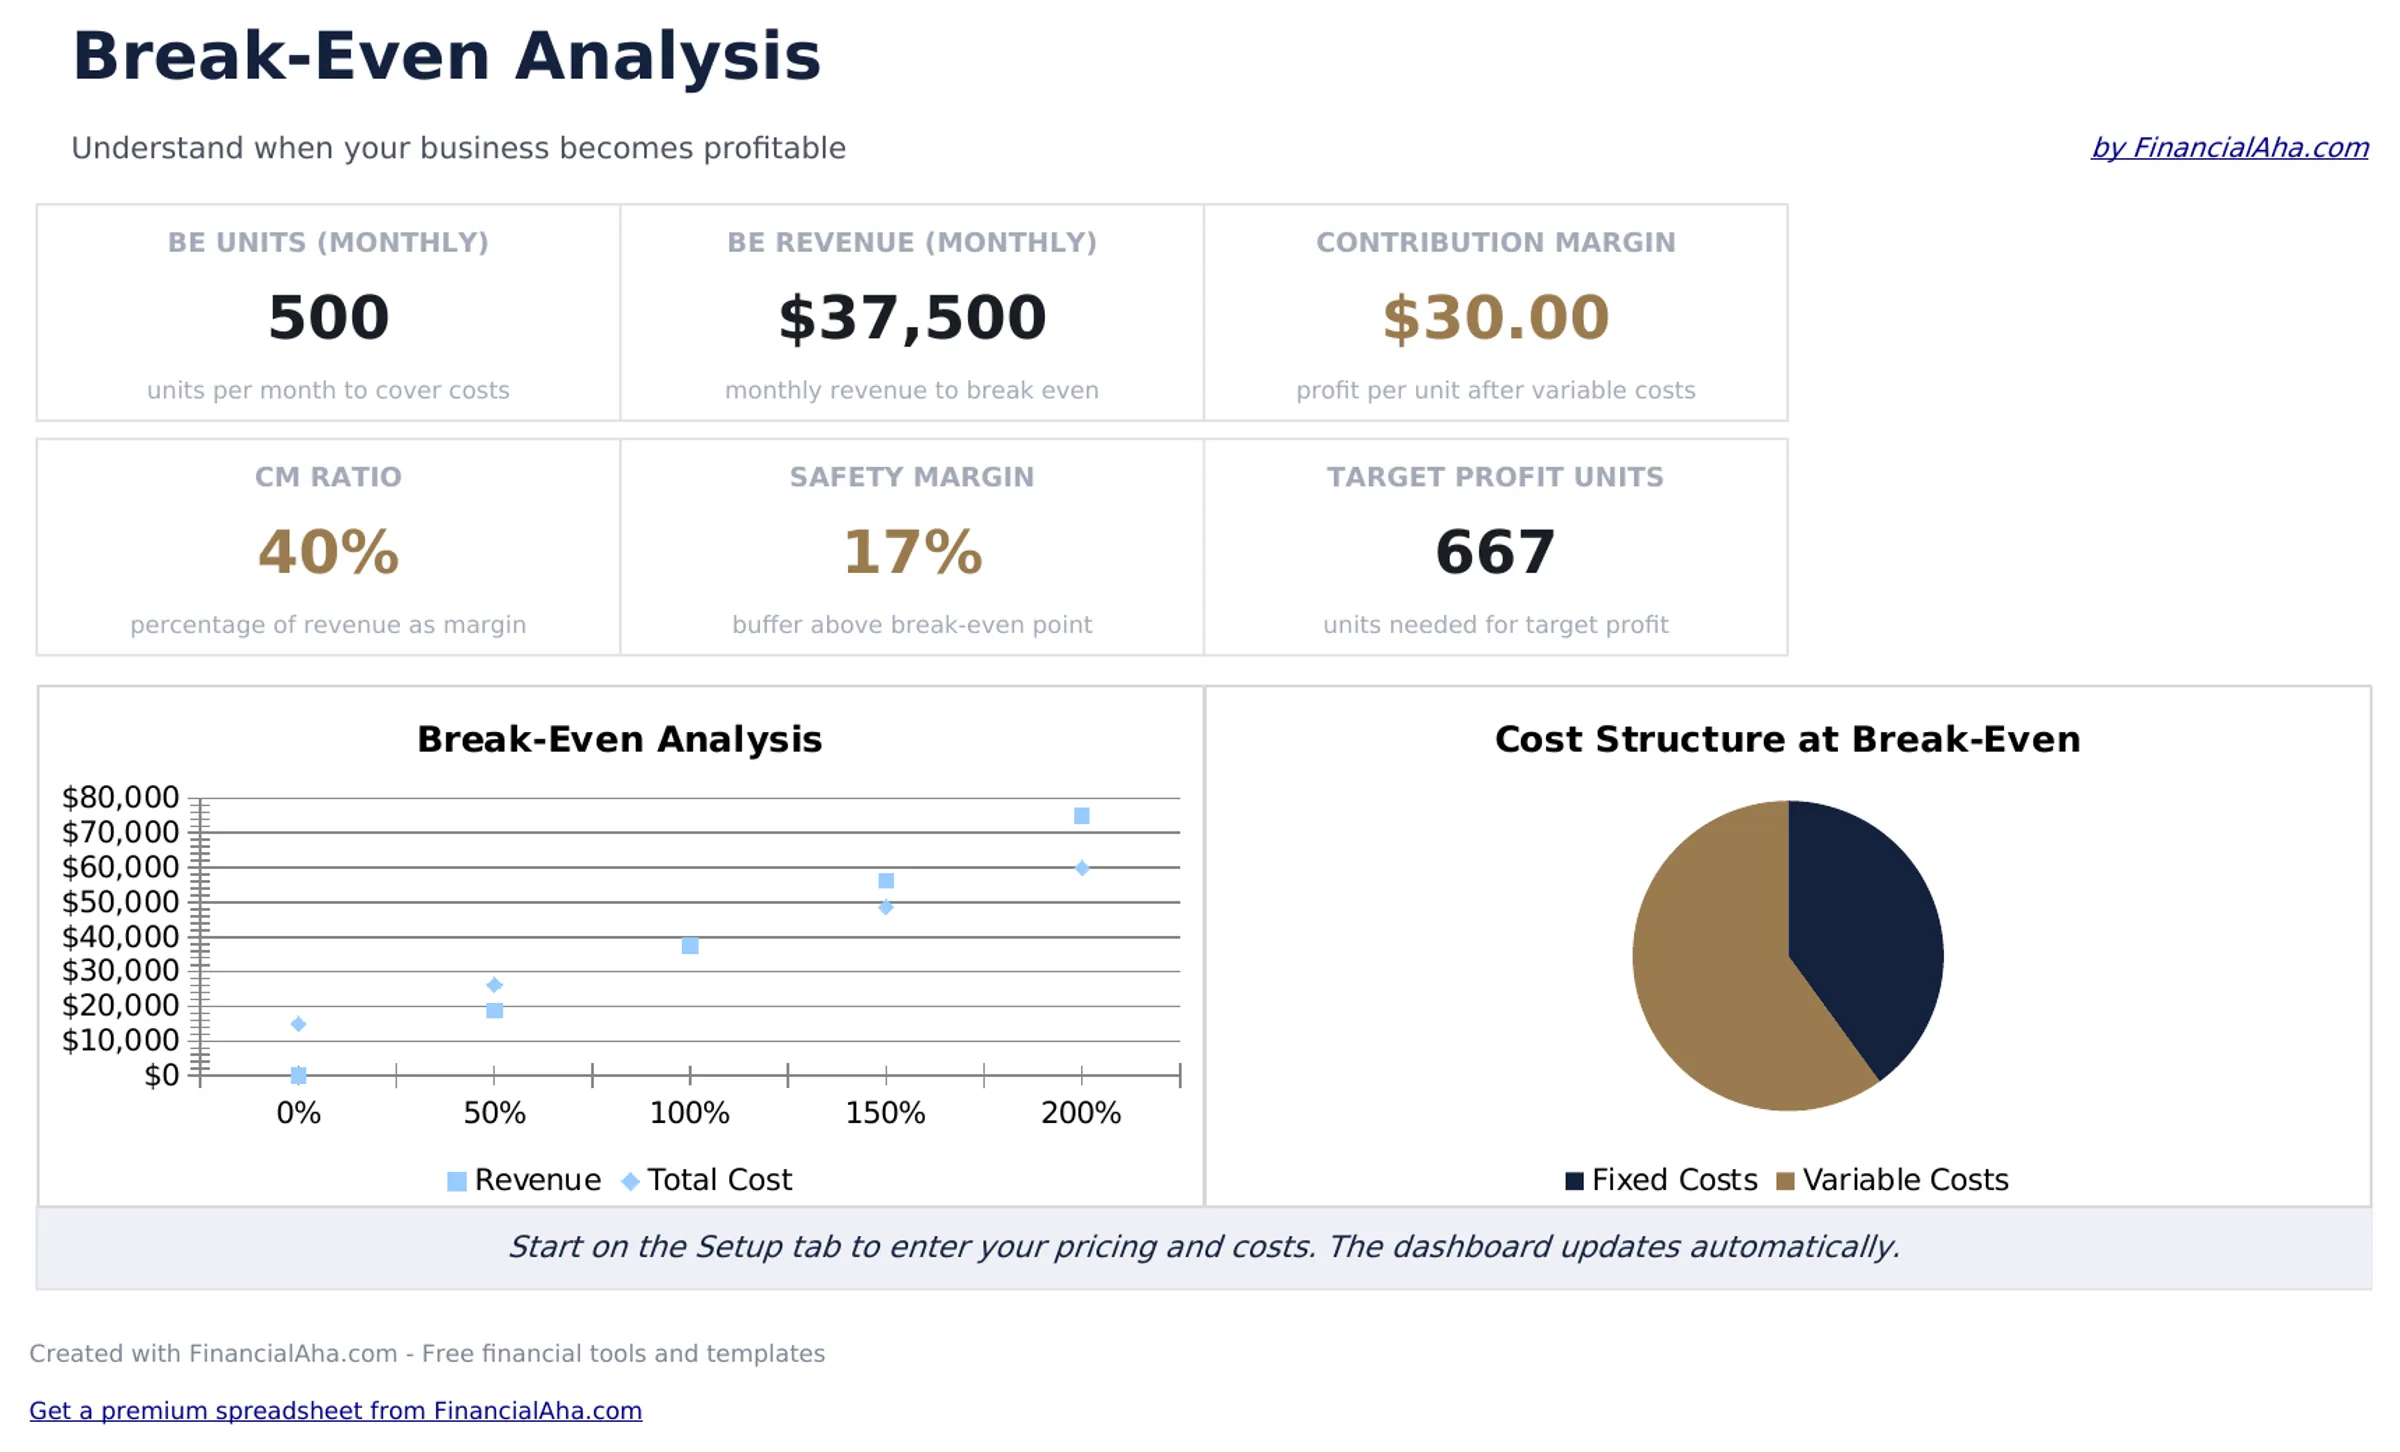
- Dashboard with break-even point display showing the exact number of units and dollar amount needed to cover all costs
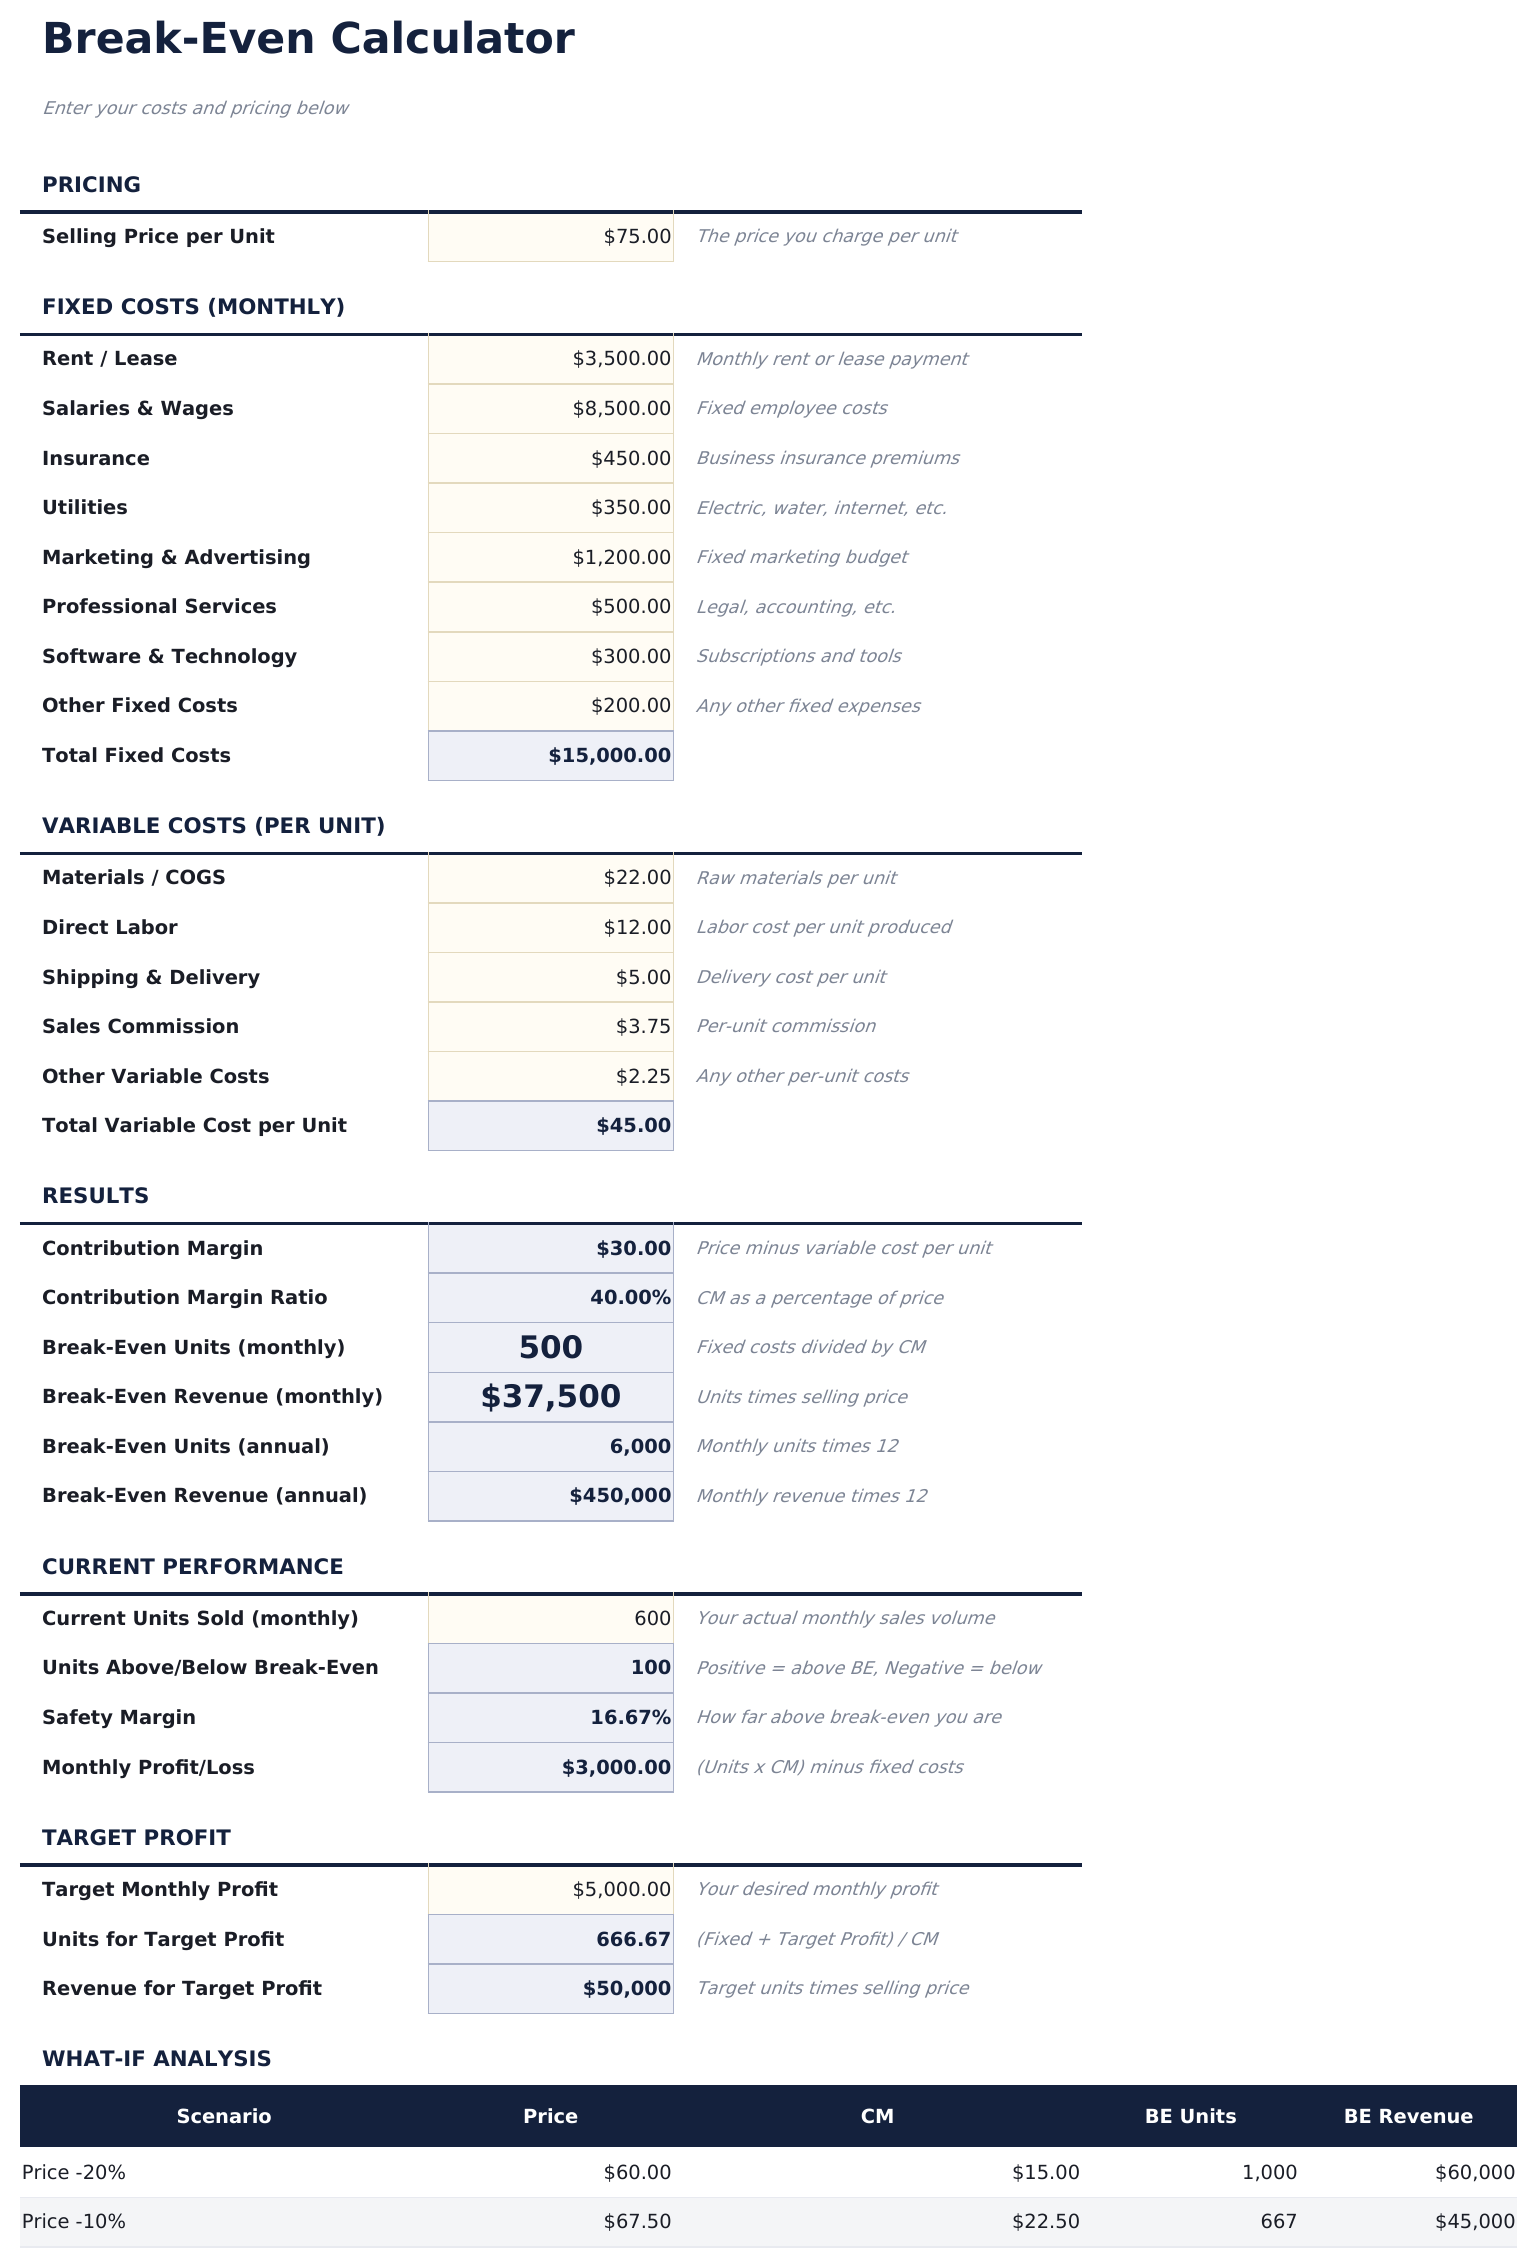
- Setup sheet with inputs for total fixed costs, variable cost per unit, and selling price per unit
- Break-even unit and revenue calculations that update automatically whenever you adjust cost or pricing inputs
- Contribution margin analysis showing the per-unit margin and how each sale contributes to covering fixed costs
- Sensitivity analysis for price changes with color-coded input cells showing break-even at different price points
- Works in Microsoft Excel, Google Sheets, and LibreOffice Calc with no setup required
Preview
See what's inside this template

How to Use This Break-Even Analysis Template
Enter fixed costs
Input total fixed costs - rent, salaries, insurance, and other expenses that do not change with sales volume.
Enter variable costs
Add the variable cost per unit - materials, labor, and other costs that increase with each unit sold.
Set selling price
Enter the selling price per unit. The contribution margin (price minus variable cost) calculates automatically.
Read the break-even point
The dashboard shows the break-even in units and dollars - the exact sales volume needed to cover all fixed and variable costs.
Built by Claude AI. Perfected by us.
We use Claude AI to draft each free template, after a deep research. Then our team steps in. We refine the layout, stress-test every formula, fix edge cases, and polish the design until it feels like something we would actually use ourselves. The AI gets us 80% there. The last 20% is all human judgment.
Frequently Asked Questions
What is the contribution margin?
Contribution margin is selling price minus variable cost per unit. It represents how much each sale contributes toward covering fixed costs.
What if I sell multiple products?
Use a weighted average selling price and variable cost across your product mix. The break-even point applies to the blended product.
How do I use the sensitivity analysis?
Change the selling price input to see how the break-even point shifts at different price levels. Lower prices require more units to break even.
Does this account for taxes?
No. Break-even analysis covers costs only. The break-even point is where revenue equals total costs before any tax considerations.
How do I open this in Google Sheets?
Upload the .xlsx file to Google Drive, then open it with Google Sheets. All formulas and formatting will be preserved.
What license is this template under?
All free templates are released under CC BY 4.0 (Creative Commons Attribution). You can use, modify, and share them freely - including for commercial purposes - as long as you credit FinancialAha.com. They are provided as-is and do not constitute financial advice.
More Free Business Finance Templates
Looking for premium spreadsheet templates?
Our paid templates include advanced multi-sheet dashboards, native Excel charts, and ongoing updates.