
Mid-2026 US personal finance in five numbers: the personal saving rate is 3.6% (March 2026), credit card balances fell $25 billion to $1.25 trillion in Q1 2026, CPI-U ran 3.8% year over year in April 2026, 63% of adults could cover a $400 expense from cash or savings, and median household net worth was $192,900 in the 2022 Survey of Consumer Finances (about $215,000 in 2026 dollars). Figures come from the Federal Reserve, BLS, and BEA, with both averages and medians reported where they diverge.
This is a half-year round-up, not a forecast. The numbers come from public Federal Reserve, BLS, and BEA sources, cited inline in each section. Where averages and medians diverge, both are reported. Where survey questions changed wording between years, the comparison is noted.
A note on what this article does not try to do: it does not call the readings good or bad. Inflation at 3.8 percent reads differently depending on whether someone is renting, owning, near retirement, or saving for a down payment. Credit card balances down does not automatically mean households are healthier; balances can fall through paydowns or through charge-offs. Where interpretation matters, we point at the data that disambiguates and stop there.
The headline table
Mid-2026 snapshot for embedding. Source links sit in the right column; cite the originals when you reuse it.
| Metric | Latest reading | Period | Source |
|---|---|---|---|
| Personal saving rate | 3.6% | March 2026 | BEA Personal Income |
| Total household debt | $18.8 trillion | Q4 2025 | NY Fed HHDC |
| Credit card balances | $1.25 trillion | Q1 2026 | NY Fed HHDC |
| Mortgage balances | $13.17 trillion | Q4 2025 | NY Fed HHDC |
| CPI-U all items, YoY | 3.8% | April 2026 | BLS CPI |
| Shelter CPI, YoY | 3.3% | April 2026 | BLS CPI |
| Energy CPI, YoY | +17.9% | April 2026 | BLS CPI |
| Cover $400 from cash/savings/card | 63% of adults | 2024 | Federal Reserve SHED |
| Doing at least okay financially | 73% of adults | 2024 | Federal Reserve SHED |
| Median household net worth | $192,900 (2022 $) | 2022 | Federal Reserve SCF |
Source: FinancialAha, mid-2026 round-up from FRED, NY Fed, BLS, BEA, and Federal Reserve SHED/SCF. Numbers are as published at the listed source as of the article date.
Personal saving rate
The personal saving rate measures personal saving as a percentage of disposable personal income (after-tax income minus mandatory spending). It is one of the most-watched single-number indicators of household financial behavior in aggregate.
For March 2026, the BEA reported a saving rate of 3.6 percent. Personal saving in dollar terms was $857.3 billion.
For context, a longer arc:
| Period | Personal saving rate |
|---|---|
| 2019 average | ~7.6% |
| April 2020 (pandemic spike) | ~32% |
| 2022 average | ~3.3% |
| 2024 average | ~4.5% |
| 2025 average | ~4.0% |
| March 2026 | 3.6% |
The rate ran above 7 percent for most of the 2010s, spiked above 30 percent during the 2020 lockdowns, fell sharply through 2022, and has hovered between 3 and 5 percent since. The March 2026 reading sits on the lower side of that recent range.
The rate is aggregate after-tax inflows minus aggregate outflows, divided by inflows. The distribution underneath is what it cannot show. A 3.6 percent national average can coexist with a top-quintile rate near 15 percent and a bottom-quintile rate at zero or negative. The FRED series PSAVERT is the canonical monthly series.
Household debt and credit card balances
The New York Fed Household Debt and Credit Report is the standard quarterly read. The Q1 2026 release landed in mid-May 2026 and covers data through March 31, 2026.
Total household debt was $18.8 trillion at the end of Q4 2025, up $191 billion (1.0%) from Q3. The Q1 2026 report showed credit card balances fell by $25 billion to $1.25 trillion, a seasonal pattern that often follows the Q4 holiday peak.
| Debt category | Balance | Period |
|---|---|---|
| Mortgage debt | $13.17 trillion | Q4 2025 |
| Credit card debt | $1.25 trillion | Q1 2026 |
| Auto loans | ~$1.66 trillion | Q4 2025 |
| Student loans | ~$1.63 trillion | Q4 2025 |
| HELOC | ~$0.40 trillion | Q4 2025 |
| Total household debt | $18.8 trillion | Q4 2025 |
Sources: NY Fed HHDC, Q4 2025 release and Q1 2026 release.
The average APR for all credit cards in Q1 2026 was 21.00 percent, with accounts that carry a balance averaging 21.52 percent (NY Fed). About 7.1 percent of credit card balances transitioned into serious delinquency (90+ days past due) over the trailing four quarters as of Q4 2025, elevated relative to the 4 to 5 percent range typical pre-pandemic.
Aggregates flatten who is holding the balance. NY Fed analysis flags that borrowers aged 18-29 transition into 90-day credit card delinquency at roughly three times the rate of borrowers in their 60s. The headline trillion-dollar number is the same; the underlying distribution is not.
Mortgage payment burden
Housing is the largest line item in most household budgets, so the mortgage-as-percent-of-income number gets disproportionate attention.
The NAR Housing Affordability Index reads 100 when a family at the national median income earns exactly enough to qualify for a mortgage on the median-priced home. Early 2026 readings have been near or just under 100 nationally, with wide regional variance.
Recent NAR data points:
| Metric | Value | Period |
|---|---|---|
| National median existing home sale price | ~$408,800 | March 2026 |
| Median monthly mortgage payment | ~$2,061 | February 2026 |
| 30-year fixed mortgage rate | ~6.12% | February 2026 |
| Qualifying income (national) | ~$111,000 | early 2026 |
Source: NAR Housing Statistics and NAR Metropolitan Median Area Prices and Affordability.
The regional split (Q1 2026, NAR): West $2,962/month (29.6% of median income), Northeast $2,411 (23.7%), South $1,760 (20.6%), Midwest $1,479 (16.6%). The same income produces very different housing burdens depending on metro.
The affordability index is built on the marginal buyer at today’s prices and rates. It says nothing about the owner sitting on a 3.25 percent rate locked in during 2020. For the burden across all owners (new and locked-in), the FRED series MDSP, Mortgage Debt Service Payments as a Percent of Disposable Personal Income, is the cleaner read.
Median retirement balances by age
The Federal Reserve’s Survey of Consumer Finances is the most-cited source on this. The current published vintage is 2022 data, released October 2023. The next wave (2025 data) is expected to publish in late 2026.
Median retirement account balances for households that have any retirement account, 2022 dollars:
| Age of household head | Median retirement balance | Share with any retirement account |
|---|---|---|
| Under 35 | $18,880 | ~50% |
| 35-44 | $45,000 | ~64% |
| 45-54 | $115,000 | ~63% |
| 55-64 | $185,000 | ~58% |
| 65-74 | $200,000 | ~50% |
| 75+ | $130,000 | ~31% |
Source: Federal Reserve 2022 SCF Bulletin and Center for Retirement Research analysis of 2022 SCF. Figures are for households that hold any retirement account; the medians across all households (including the zero-balance group) are substantially lower.
The deeper article on this site, Net Worth by Age: What the Numbers Say and How to Track Yours, unpacks the median-vs-mean gap for total net worth. For retirement accounts specifically, the same skew applies: a few very large balances pull the mean far above the median.
What the SCF captures: defined-contribution accounts (401(k), 403(b), IRA, Keogh), reported by household. What it does not: full present value of defined-benefit pensions, Social Security claims, or home equity. For households relying primarily on Social Security and a paid-off home, low retirement-account balances can still pair with adequate retirement income.
Emergency savings
Two questions from the 2024 SHED (released May 2025) anchor the emergency-savings picture.
The “$400 unexpected expense” question asks how a respondent would pay an unexpected $400 bill. In 2024, 63 percent of adults said they would cover it exclusively with cash, savings, or a credit card paid off at the next statement. That figure was unchanged from 2022 and 2023, and down from the 2021 peak of 68 percent.
A second question asks the largest expense someone could pay from current savings alone:
| Largest expense coverable from savings | Share of adults |
|---|---|
| Less than $100 | 18% |
| $100 - $499 | 13% |
| $500 - $999 | 10% |
| $1,000 - $1,999 | 10% |
| $2,000 or more | 48% |
Source: Federal Reserve SHED 2024.
Roughly 31 percent of adults said they could not cover a $500 expense from savings alone in 2024. Coverage of three months of expenses was reported by 55 percent of adults, ranging from 24 percent in the under-$25,000 income group to 75 percent in the $100,000-plus group.
For the income-bracket detail, see Average Emergency Fund by Income Bracket (2026 Data), which builds dollar targets for each quintile.
What SHED captures: liquid, penalty-free savings (excludes retirement accounts and home equity). What it does not: access to family support, credit lines, or other contingent resources that some respondents would draw on first.
Inflation and its uneven category effects
The BLS Consumer Price Index reported CPI-U up 3.8 percent over the 12 months ending April 2026 (BLS CPI release). Core CPI (excluding food and energy) was up 2.8 percent.
The category split matters because households spend on a different mix than the CPI weights. April 2026 year-over-year changes:
| Category | YoY change |
|---|---|
| All items | +3.8% |
| Food | +3.2% |
| Energy | +17.9% |
| Gasoline | +28.4% |
| Shelter | +3.3% |
| Core (ex food and energy) | +2.8% |
Source: BLS CPI April 2026 release.
A renter in a major metro will feel shelter inflation differently than the national 3.3 percent. A long-commute household is more exposed to the 28.4 percent gasoline print than to the 3.8 percent all-items figure. A two-earner household with paid-off housing and a short commute can run a personal rate near 2 percent in the same month BLS reports 3.8.
CPI-U is the average urban basket, not any one household’s basket. BLS publishes research CPIs for the elderly and several other subgroups for exactly that reason. The headline number is one read among several.
Net worth distribution
Aggregate household net worth keeps climbing in absolute terms. The distribution does not move much. The 2022 SCF reported the largest three-year increase in median net worth in the modern history of the survey: median household net worth rose from about $141,100 in 2019 to about $192,900 in 2022 (2022 dollars). Adjusted for CPI through Q1 2026, that is roughly $215,000 in current dollars.
Percentile snapshot, 2022 dollars (carry-forward to 2026 dollars adds roughly 11 to 12 percent across the column):
| Percentile | 2022 household net worth | Rough 2026-dollar equivalent |
|---|---|---|
| 25th | ~$27,100 | ~$30,300 |
| 50th (median) | $192,900 | ~$215,000 |
| 75th | ~$659,000 | ~$735,000 |
| 90th | ~$1,938,000 | ~$2,160,000 |
Source: Federal Reserve SCF 2022 bulletin. 2026-dollar equivalents are FinancialAha estimates using BLS CPI-U through Q1 2026; they are illustrative, not Fed-published.
To place a specific figure against this distribution, the net worth percentile calculator returns the percentile for a given amount:
Mean US household net worth was about $1.06 million in 2022, more than five times the median. The top decile pulls the mean; the median is the much closer read on a typical household. The two numbers describe the same country and almost two different economies.
What shifted since 2025
Comparing the mid-2026 readings to a year ago, three patterns are visible.
Saving rate slightly lower. The saving rate ran near 4 percent for much of 2025 and printed 3.6 percent in March 2026. Modest move, still inside the post-pandemic range.
Credit card balances down in Q1 2026, flow into delinquency still elevated. Total credit card balances fell $25 billion in Q1 2026, partly seasonal. Transitions into serious delinquency remained near 7 percent, above the pre-pandemic 4-5 percent norm. Younger borrowers continue to show higher delinquency entry than older borrowers.
Inflation re-accelerated in early 2026 versus late 2025. Late 2025 readings were in the 2.7-3.0 percent CPI-U range. April 2026 came in at 3.8 percent, with energy doing most of the work (gasoline +28.4 percent). Core CPI moved less, from about 3.0 to 2.8 percent over the same span.
Housing affordability slightly better than 2024, still constrained. The NAR index has hovered near 100 in early 2026 versus the 90-95 range in 2024. Rate moves and price moves have partly offset, with median payments still near the upper edge of “affordable” by the index’s 25-percent-of-income definition.
What this does not capture: distributional shifts within the period. National averages can be flat while the gap between the top and bottom quartiles widens or narrows. Quartile-level data from the Federal Reserve Distributional Financial Accounts is the place to look for that.
What individuals can take from aggregate data
Three uses for this kind of round-up at the household level.
Calibration. Knowing the national median household net worth was $192,900 in 2022 (around $215,000 in 2026 dollars) or that 63 percent of adults can cover a $400 expense from savings tells you where the middle is. Where you sit relative to the middle is data, not identity.
Direction over level. A household at $72,000 in net worth adding $7,500 a year is on a different trajectory than a household at $185,000 going flat. The aggregate numbers are levels; your own series adds direction. Small, steady changes are what bend that trajectory over time, which is the case the compound effect of minor budget tweaks lays out.
Decoupling lived rate from headline rate. The 3.8 percent CPI-U applies to the national basket. Your own essentials-only inflation, weighted by your actual spending, can be higher or lower. Logging your own categories is what makes that comparison possible.
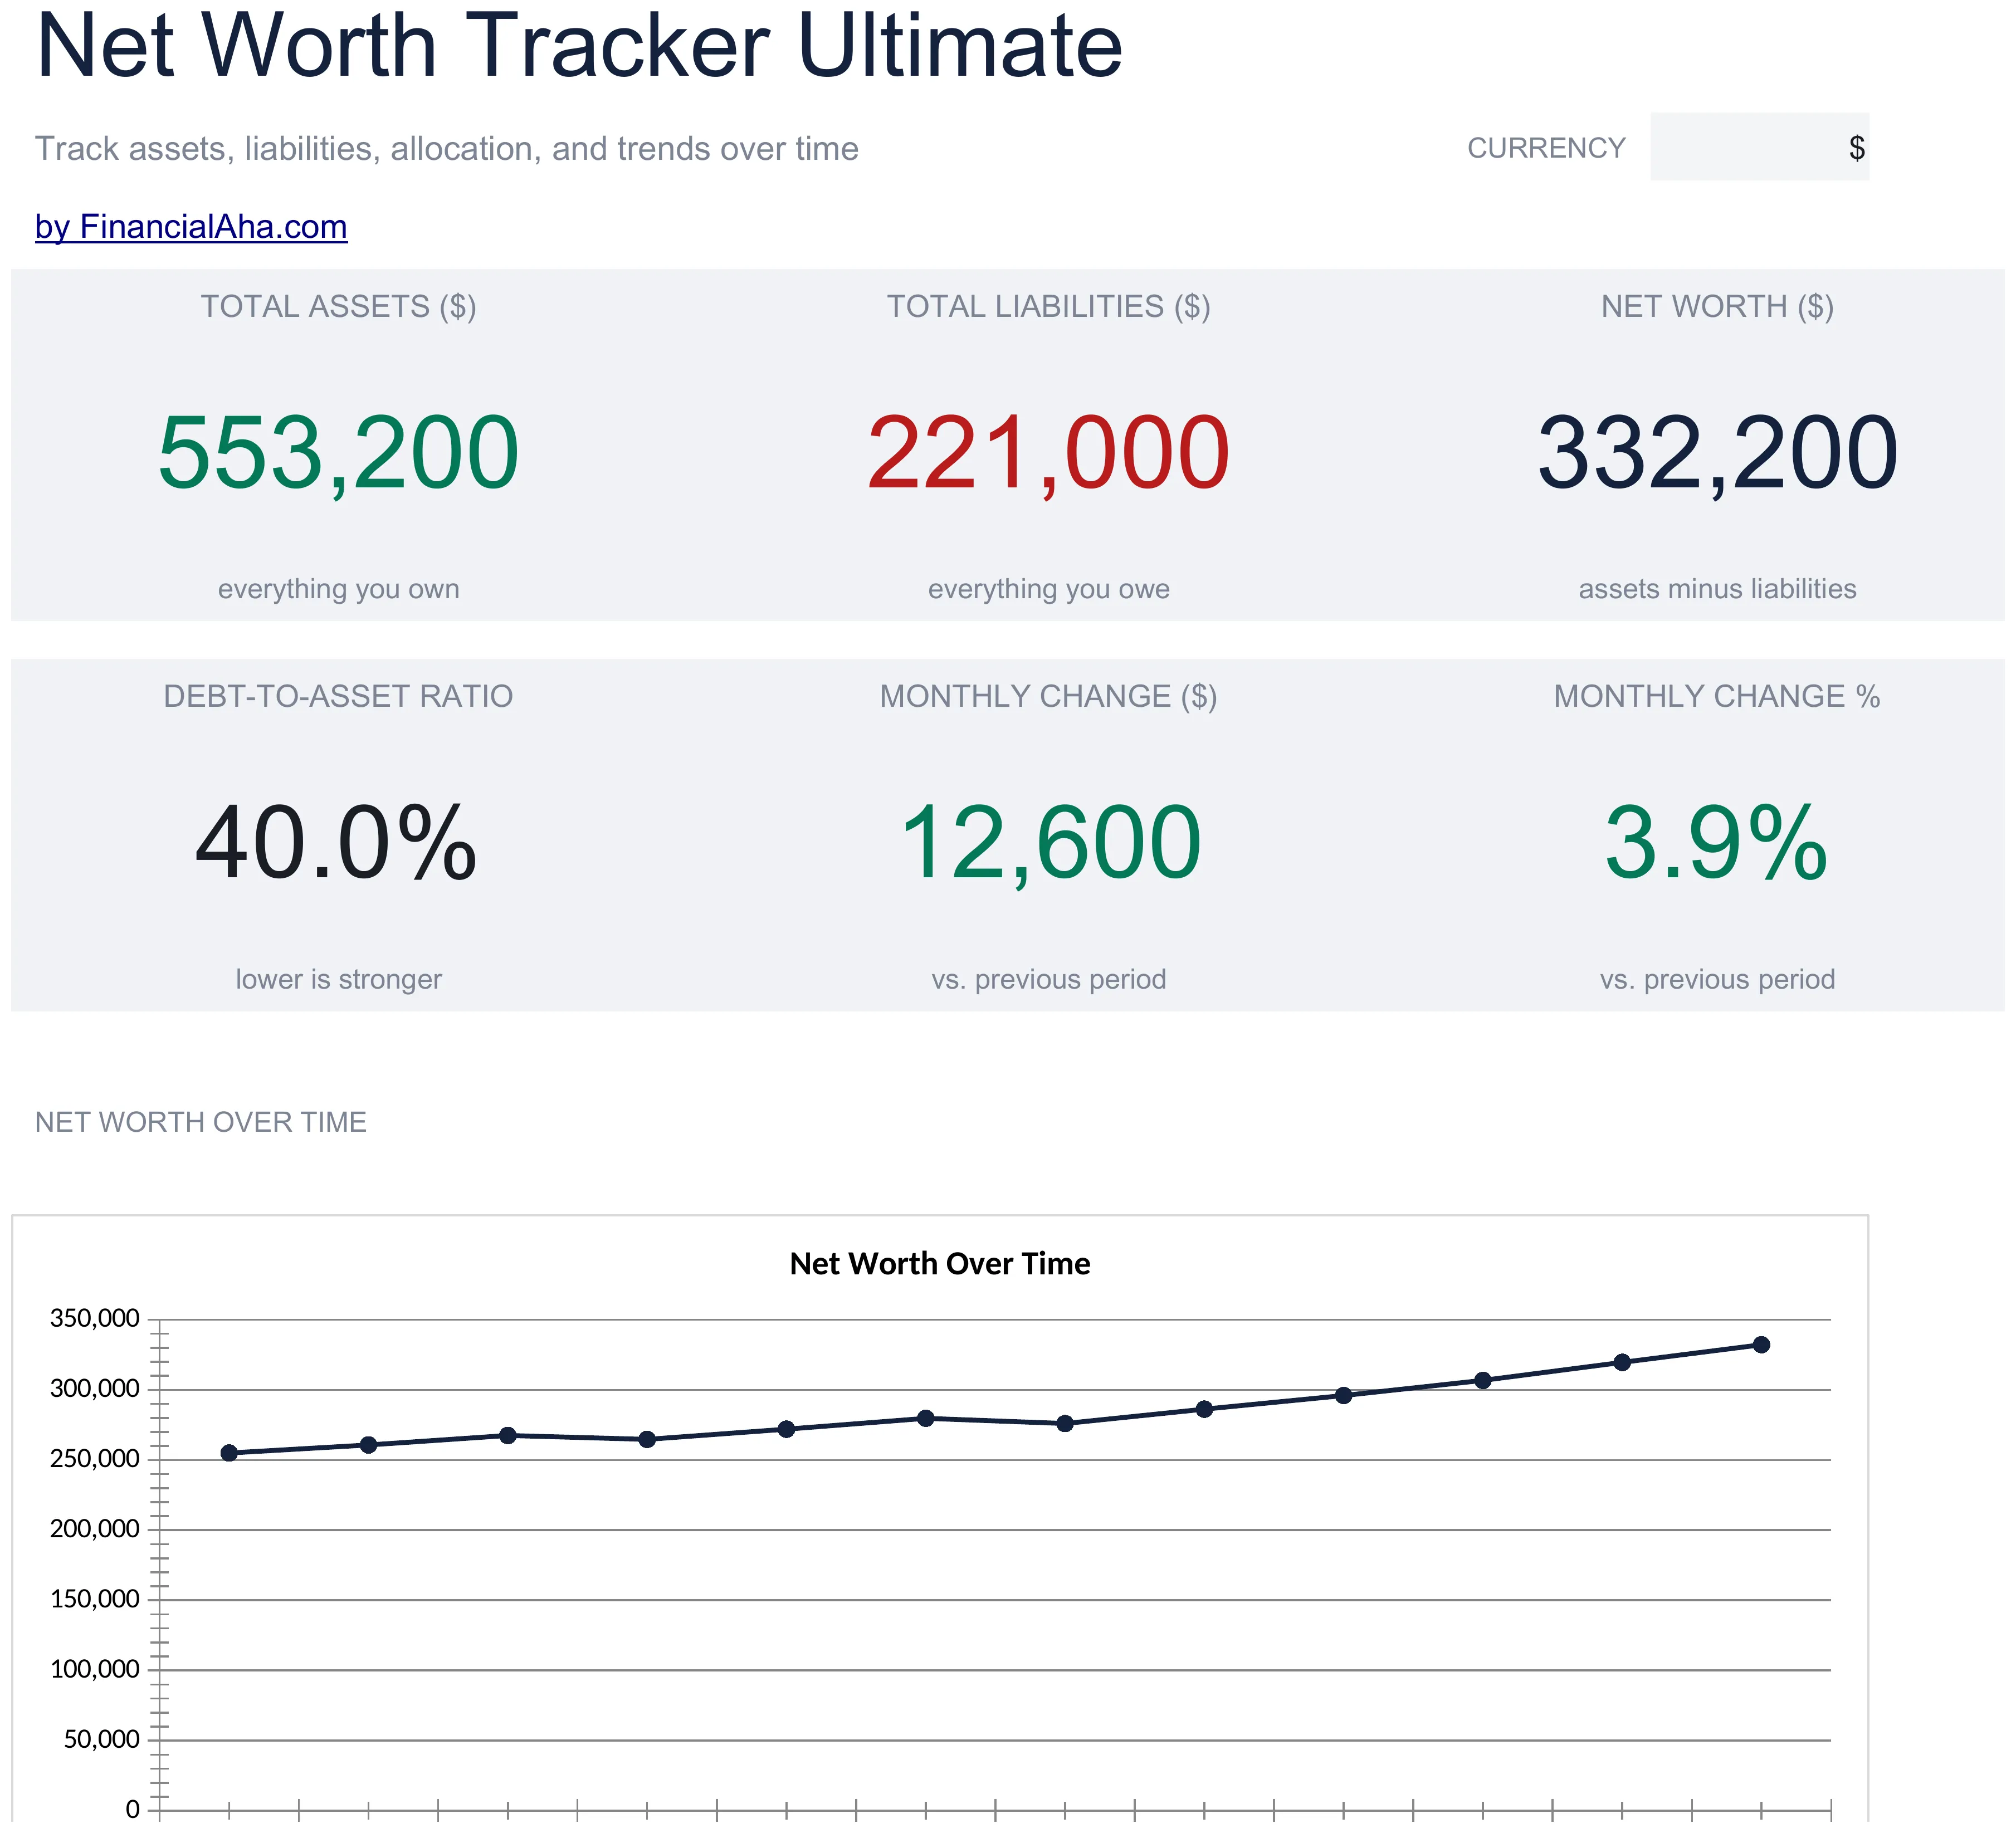
The Net Worth Tracker (Ultimate tier) logs assets and liabilities each month and plots the trend, which is the “direction over level” read the aggregate medians cannot give you.
The Financial Planning Spreadsheet holds the long view in one file: net worth measured against goals you set, a cash flow sheet with one row per month, and a projection that runs to an end year you choose from growth, yield, debt-change and inflation assumptions. For people who want the monthly view first, the Monthly Budget Template covers a single month, with budget, actual and difference on every category.
Turning a number into a plan is a separate step. A year-start financial reset is one on-ramp, and the case for making 2026 the year to finally master your finances is another.
Source notes and methodology
A short methodology note for anyone embedding or citing the tables.
The personal saving rate is from BEA Personal Income and Outlays, released monthly. The series shown in tables is PSAVERT on FRED, which mirrors the BEA release.
Household debt totals are from the New York Fed Household Debt and Credit Report, released quarterly. The data is drawn from the New York Fed Consumer Credit Panel, a nationally representative anonymized sample from Equifax credit data. Q1 2026 numbers reflect the May 12, 2026 release covering data through March 31, 2026.
CPI figures are from the BLS Consumer Price Index, released monthly. The April 2026 release is the most recent at article date; the May 2026 release is scheduled for June 10, 2026.
Net worth and retirement balance distributions are from the Federal Reserve Survey of Consumer Finances, released every three years. The 2022 wave is the most recent; 2025 SCF data publishes in late 2026. Inflation adjustments to 2026 dollars use the BLS CPI-U.
SHED figures are from the Federal Reserve Survey of Household Economics and Decisionmaking, fielded each October. The 2024 wave (released May 2025) is the most recent; the 2025 wave publishes in May 2026.
Numbers are rounded only where the original source rounds. Where two sources report a similar metric with different methods (e.g. SHED coverage rate vs Bankrate behavioral survey on emergency savings), we cite each separately rather than averaging.
Templates for comparing your numbers to the aggregate
Three templates that take the aggregate picture and let you compare it to your own numbers.
- Financial Planning Spreadsheet - Net worth, assets, debt, monthly cash flow, and a projection that runs to an end year you set. For people who want the full picture in one file.
- Monthly Budget Template - Planned-vs-actual by category for a single month, with a savings rate tile on the summary. For people who want to see where their saving rate lands.
- Net Worth Tracker - Monthly asset and liability log with a net-worth-over-time chart and debt-to-asset ratio. For tracking direction over time against the percentile figures above.
Related
Frequently asked questions
Where does the data come from?
Federal Reserve (FRED, SHED, Survey of Consumer Finances), Bureau of Labor Statistics (CES, CPI), New York Fed Household Debt and Credit Report, and Census Bureau. Specific sources are linked in each section.
Why mid-year for a state-of-finance article?
Q2 economic data lands in late June, so July is when a half-year picture is most reliable. Year-end data lags into Q1 of the following year, making 'mid-year' the moment of most fresh information.
How is this different from your other data analyses?
The data-analysis pages on the site (FIRE numbers, net worth by generation) go deep on single questions. This is a breadth round-up - 8 to 10 metrics in one place for the half-year snapshot.
What does the data NOT tell us?
Distributional reality. Averages and medians hide the gap between high and low percentiles. Where possible, the article reports both. Census income and Fed wealth quintiles fill in some of the distribution picture.
Why is the net worth figure from 2022 and not 2026?
The Survey of Consumer Finances is fielded every three years, and the 2022 wave (released October 2023) is the most recent published vintage. The 2025 SCF data is expected in late 2026. To bridge the gap, the article shows a rough 2026-dollar equivalent using BLS CPI-U, which adjusts for inflation but not for real changes in the distribution.
Do credit card balances falling mean households are in better shape?
Not on its own. Balances can drop through paydowns or through charge-offs, and the two point in opposite directions. The article pairs the balance change with the transition-into-delinquency rate, which stayed near 7 percent, above the pre-pandemic 4 to 5 percent range, so the fuller picture is mixed rather than clearly improving.
Sources
- Personal Saving Rate - U.S. Bureau of Economic Analysis
- Consumer Price Index News Release - U.S. Bureau of Labor Statistics
- Economic Well-Being of U.S. Households in 2024 (SHED) - Federal Reserve
- Survey of Consumer Finances - Federal Reserve
- Changes in U.S. Family Finances from 2019 to 2022 - Federal Reserve
- Personal Income and Outlays, March 2026 - U.S. Bureau of Economic Analysis
- Household Debt and Credit Report - Federal Reserve Bank of New York
- Housing Affordability Index - National Association of Realtors
About this article
Every figure is drawn from the linked Federal Reserve, BLS, BEA, New York Fed, and NAR releases. The 2026-dollar equivalents are our own CPI-U adjustments and are labelled as such where they appear. Figures checked against the linked releases. Template features checked on 2026-09-10 against the shipped Financial Planning (Summary, Goals, Assets, Debt, Cashflow, Projection), Monthly Budgeting (Summary, Budget Plan, Transactions, Goals) and Net Worth Tracker Google Sheets. Last reviewed September 2026.