A tax deduction tracker keeps every deductible expense in one log and derives everything else from it: category totals, an IRS-schedule breakdown, month-by-month quarterly totals, and a simplified tax-impact estimate. This walkthrough follows the real workbook sheet by sheet using its sample year, 32 entries totaling $35,244 across eight categories. Whether any expense is actually deductible depends on your situation, so the sheet totals and estimates rather than advises. The Tax Deduction Tracker Ultimate ($29) ships the whole structure ready-made for Excel and Google Sheets.
Deductions are easy to spend and hard to reconstruct. A crown at the dentist in February, a conference registration in March, four quarters of mileage, a year of state estimated payments, a December charity run: individually they are receipts in a drawer, and collectively they are the difference between a return built from records and a return built from guesswork. The gap between those two is not effort so much as structure, and a spreadsheet closes it well.
The structure is one log and a set of views that read from it. You type each deductible expense once, tag it with a category and an IRS schedule, and everything else, the category totals, the schedule breakdown, the month-by-month grid, and a simplified tax-impact estimate, falls out as calculation. The examples below come from our Tax Deduction Tracker Ultimate Spreadsheet Template ($29), which ships the whole thing ready-made for Excel and Google Sheets. The layout is reproducible by hand if you would rather build your own.
One thing this walkthrough does not do is tell you what is deductible. Whether a specific expense counts, and on which form, depends on facts the spreadsheet never sees, and the workbook is explicit that it is a tracking and estimation tool rather than tax advice. Everything below describes what the sheet records and computes from a sample year, not a ruling on what qualifies.
What a tax deduction tracker has to hold
Strip away the tax software and there are only a few kinds of data:
- Per-expense records. A date, a description, an amount, and two tags for every deductible expense. This is the raw material for everything else.
- A category dropdown. A fixed list of expense types so the same kind of cost always lands in the same bucket. The workbook uses eight: Business Expense, Home Office, Vehicle, Medical, Charitable, Education, State Tax, and Other.
- A schedule dropdown. Which IRS form the expense reports on: Schedule A for itemized deductions, Schedule C for self-employment, Schedule E for passive income, and Other.
- Derived views. Category totals, a schedule breakdown, a monthly and quarterly rollup, and a tax-impact estimate. These are calculations, not entries; in a well-built sheet, nothing here is ever typed.
The tracker gives each of these its own sheet. A Deduction Log holds the raw entries, a Category Summary and a Schedule Breakdown roll them up two different ways, a Quarterly Summary buckets them by month, a Tax Impact Calculator models the year, and a Dashboard sits on top. A How to Use sheet carries the instructions.
Log each expense once: the Deduction Log
The log is the only place an expense is ever typed. It carries up to 150 entries across seven columns: date, description, category, schedule, amount, a receipt flag, and notes. Two of those, the category and schedule tags, are what make the sheet more than a list, because every summary on the workbook reads back from them.
All seven columns are yours to fill. The date sets when the expense falls, which matters because the Quarterly Summary buckets entries by month and an entry with no date lands in no month. The description is plain language for future you. The category and schedule come from dropdowns, so the same choice is available on every row and nothing gets mistyped. The amount is the number that carries through to every total. The receipt column is a simple Yes or No, a running record of which entries you can document, and the notes column holds the detail a single line cannot.
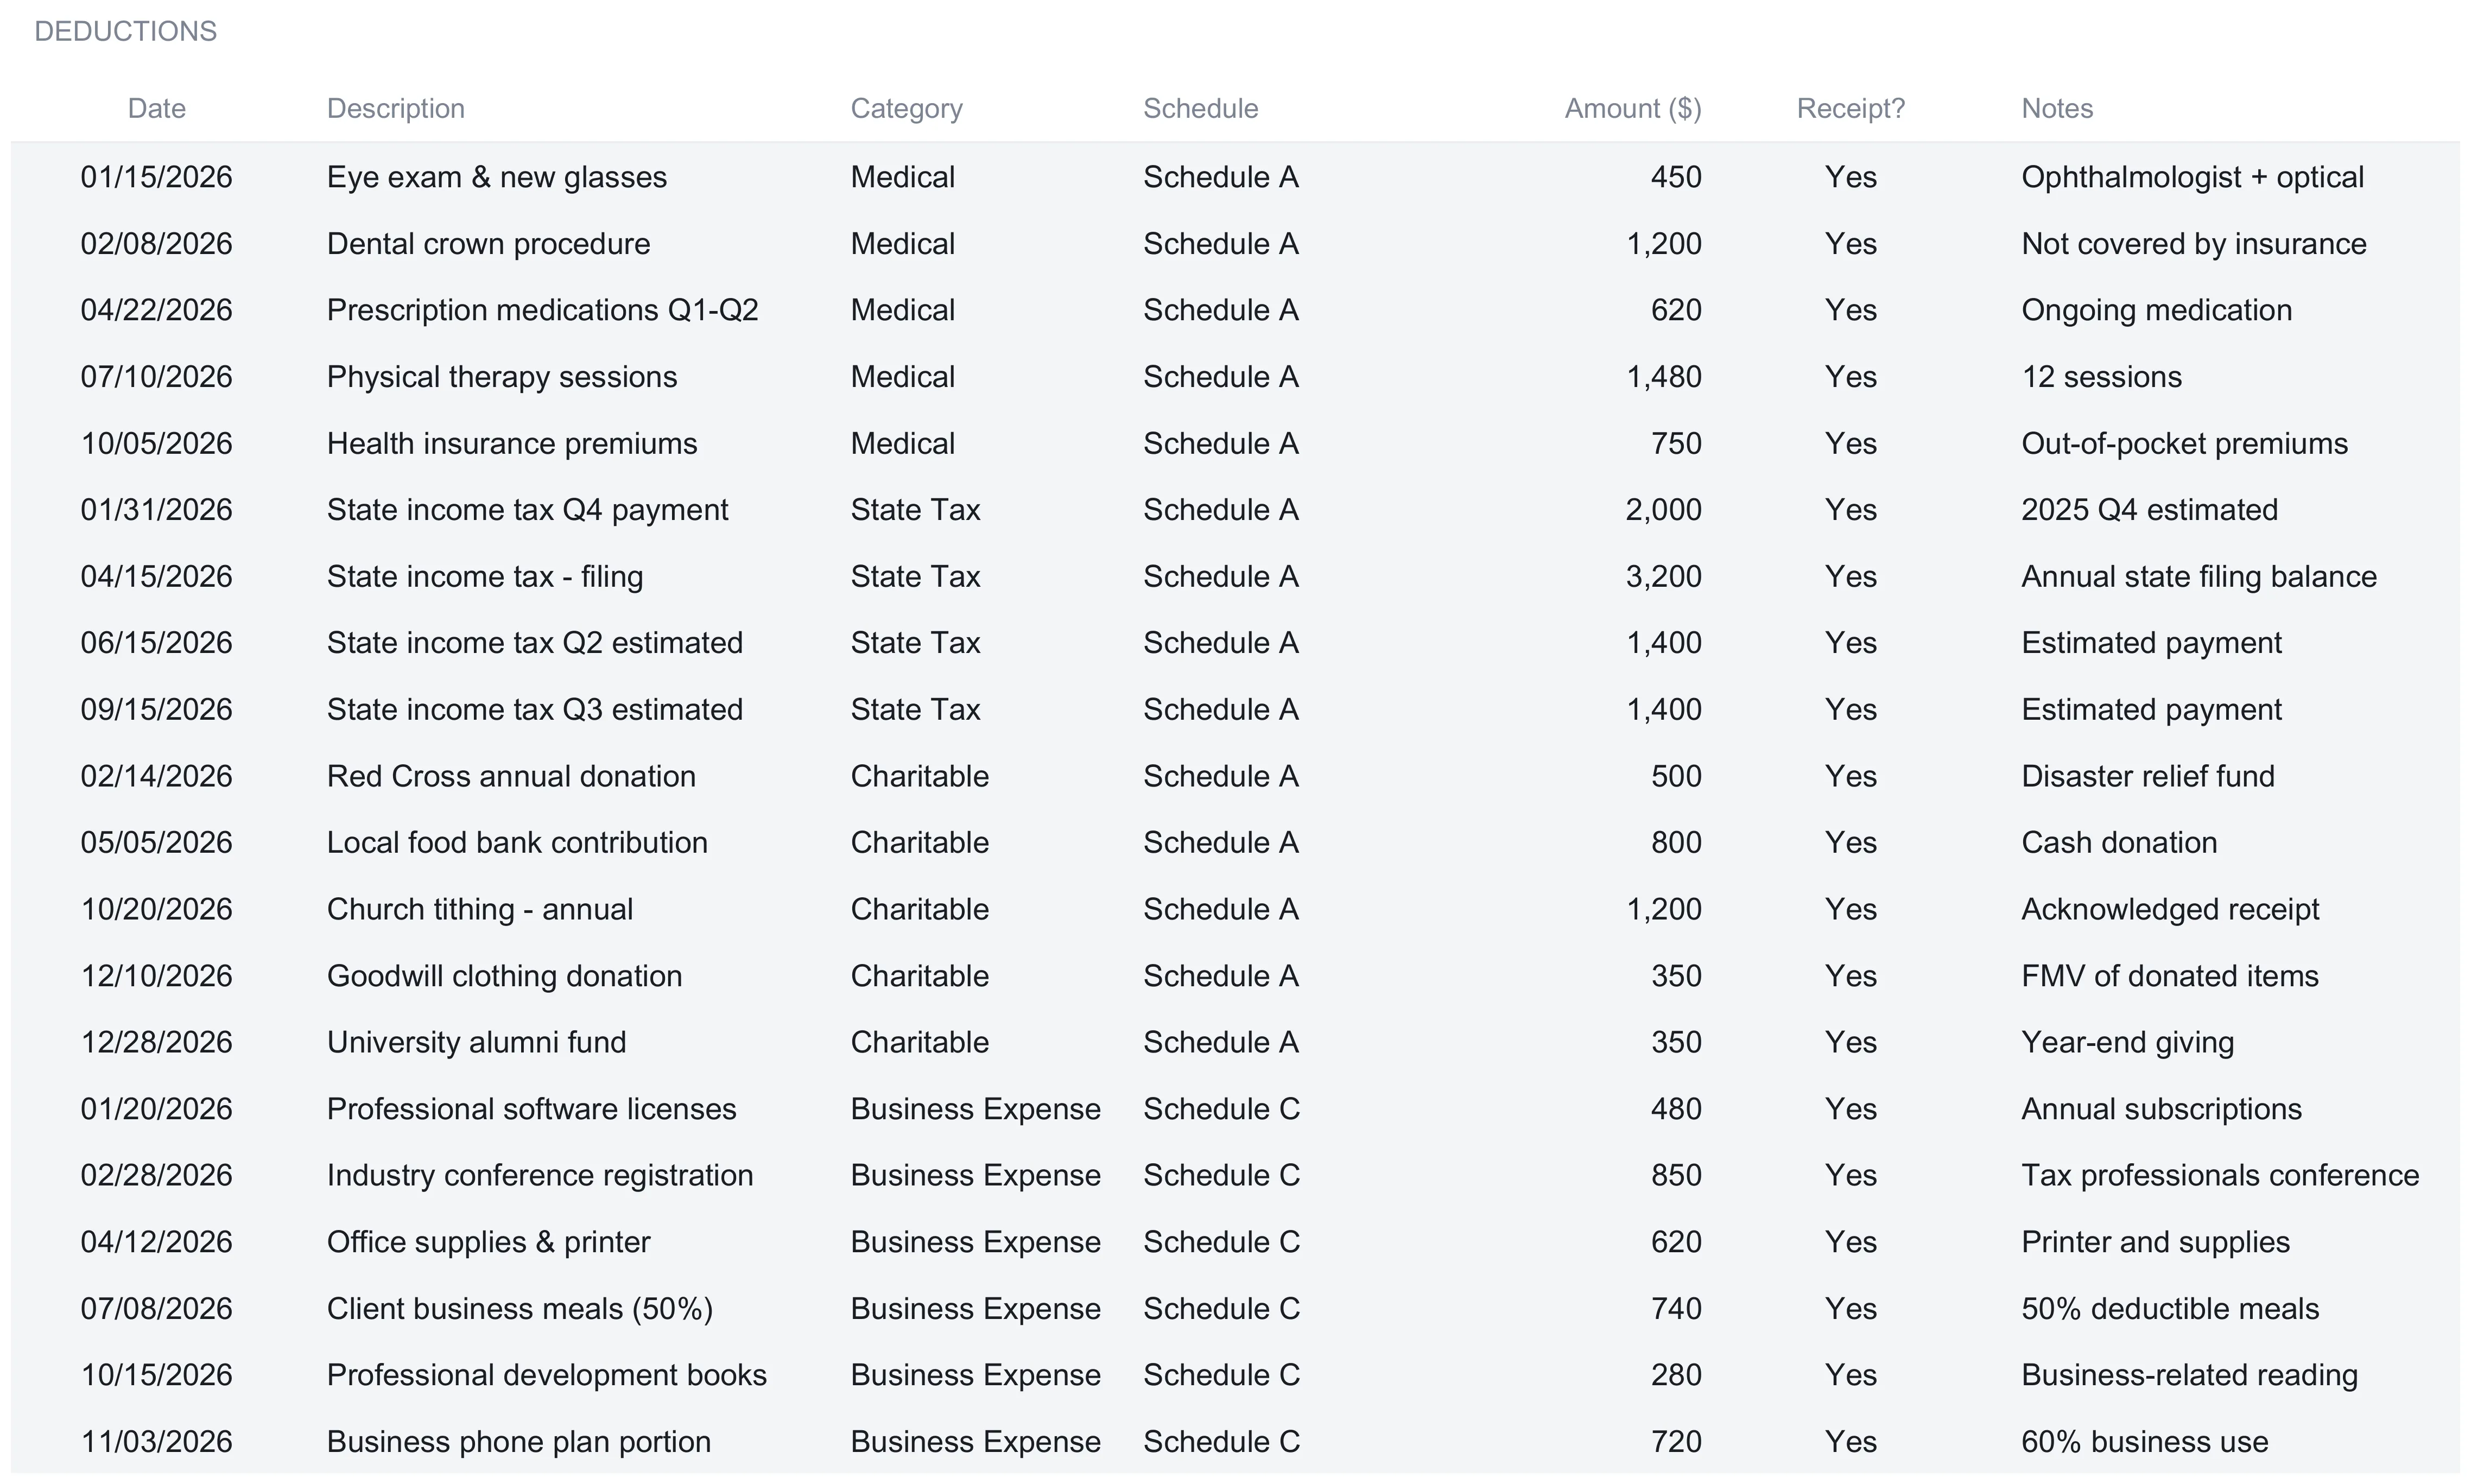
The sample year fills 32 rows, and reading a few makes the flow concrete. A dental crown on February 8 is logged as Medical, Schedule A, $1,200, with a note that it was not covered by insurance. A conference registration on February 28 is a Business Expense on Schedule C at $850. Client business meals in July are logged at $740 with the note “50% deductible meals”, which is the habit the log encourages: you do the arithmetic that applies to your situation and enter the resulting figure, rather than expecting the sheet to know that meals are treated differently from supplies.
That last point is the reason the amount column matters more than it looks. The log stores a plain number, so any allocation, a business-use percentage on a phone plan, the deductible half of a meal, a home-office share of household costs, happens before the figure lands on the row. The sample makes this visible in its notes. A phone plan on November 3 is logged at $720 with the note “60% business use”. Four home-office rows carry $700 each with a note reading “15% of home expenses”, and the Goodwill row on December 10 is entered at the fair market value of the donated items rather than what they cost new. None of those adjustments are formulas the sheet applies; they are judgments you make and record, and the notes column is where the reasoning lives so a figure still makes sense months later. Keeping the arithmetic in the entry rather than in a hidden calculation is what lets the same log hold a medical bill, a mileage total, and a charitable gift without any of them needing special treatment.
Vehicle mileage shows the same pattern across four quarterly rows. The sample prices each quarter’s business miles and logs the dollar amount, splitting the year by date to match the IRS mid-year change to the 2026 business mileage rate: 72.5 cents a mile through June 30 and 76 cents from July 1. A first-quarter row of 2,800 miles logs as $2,030 (2,800 times 72.5 cents), and a third-quarter row of 2,000 miles logs as $1,520 (2,000 times 76 cents). Because the rate lives in the entry rather than in a formula, a year-round log needs the trip date, not just the mileage total, and the four rows sum to $7,694 of vehicle deductions for the year.
Two design details are worth copying into any hand-built version:
Spare rows are pre-wired. The log is built for 150 entries, and the summary sheets already read the full range. The next expense goes on the first free row and the whole workbook updates; there is no formula to drag down and no range to extend.
Everything downstream reads this one log. The category rollup, the schedule breakdown, the monthly grid, and the dashboard all pull from the same rows, so they cannot drift apart. Spreadsheets that go wrong tend to go wrong exactly here, when an expense gets typed into one summary but not another.
Read it by category: the Category Summary
The first rollup groups the log by the category tag. Every number on it is computed from the log, so there is nothing to type here. Each of the eight categories gets four numbers: the total amount, the number of entries, the average per entry, and the share of the grand total.
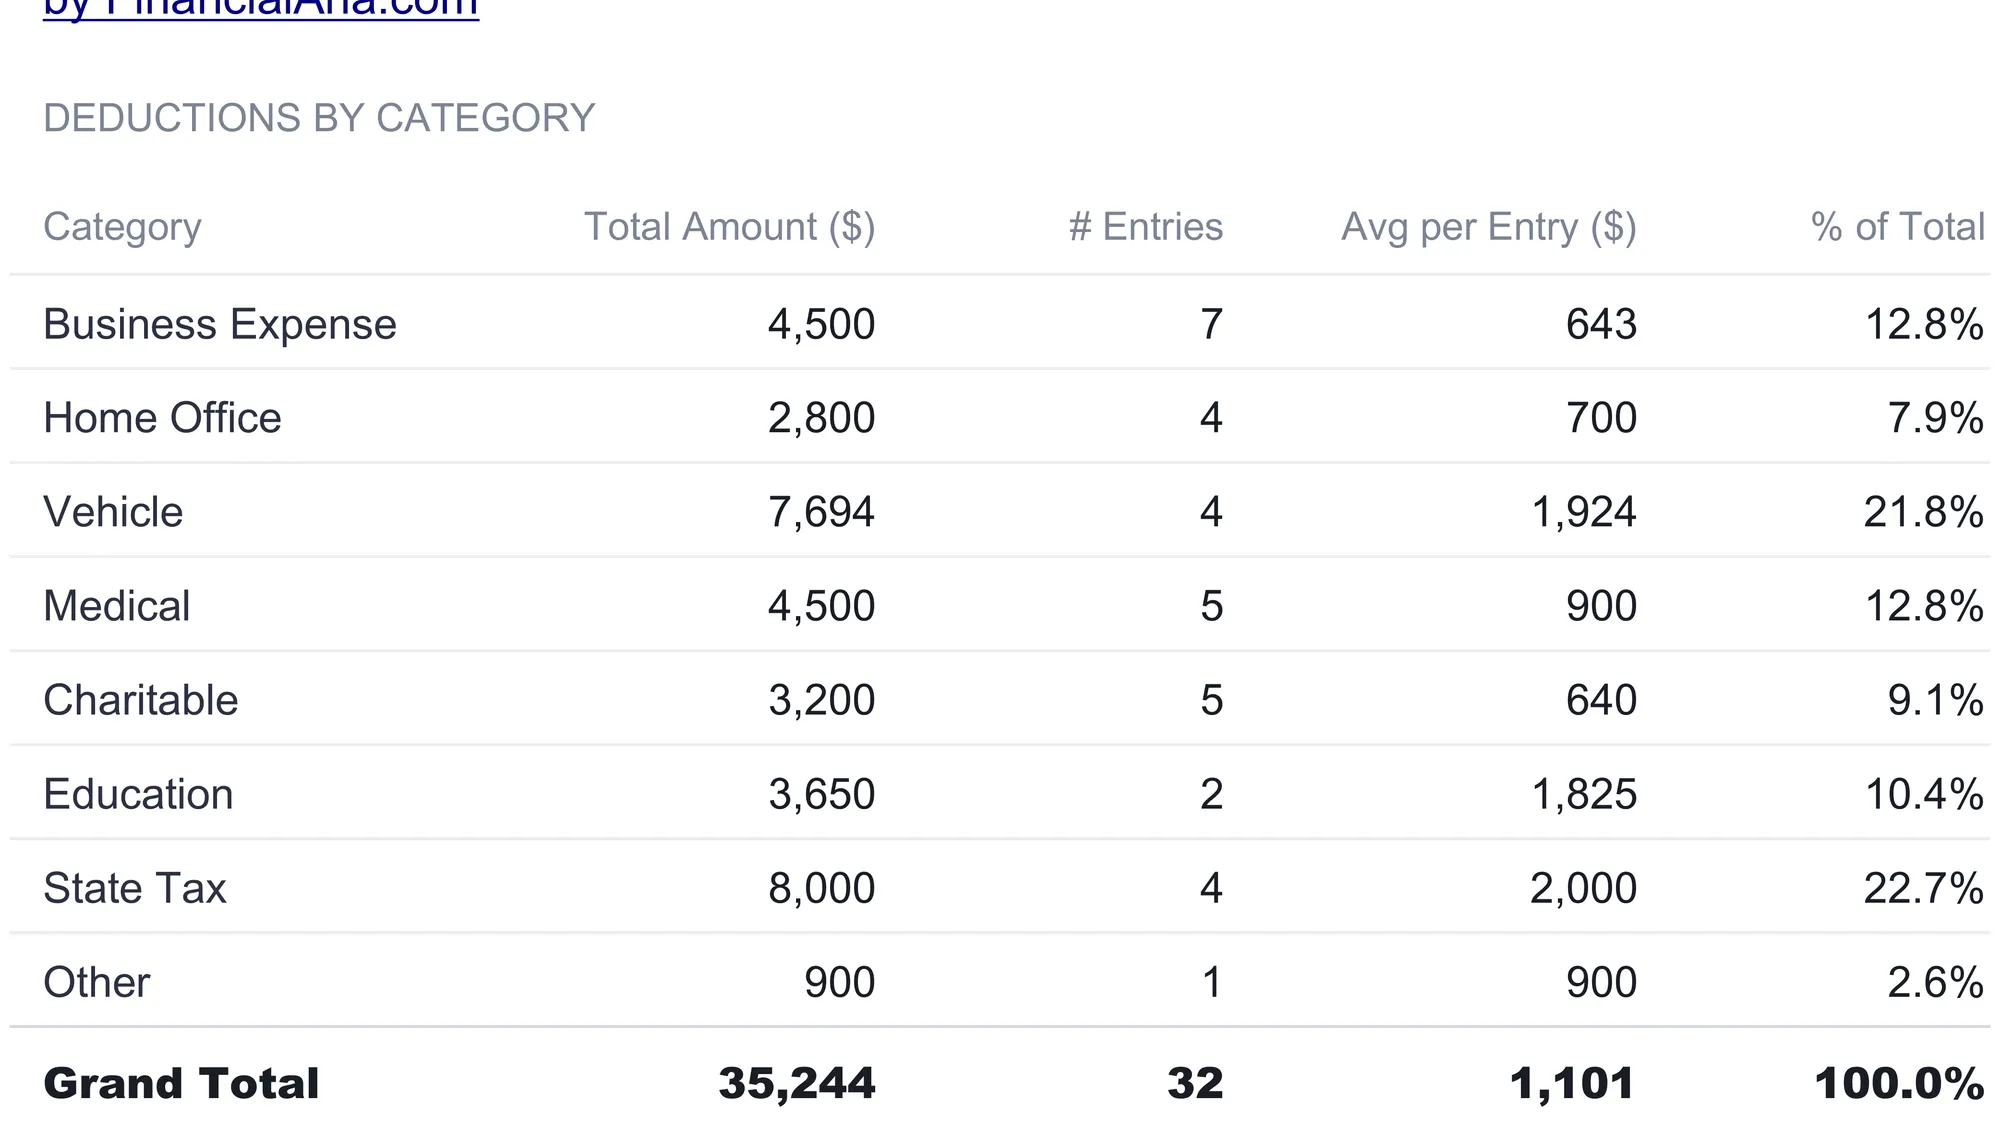
In the sample year the eight categories line up like this:
| Category | Total ($) | Entries | Avg per entry ($) | % of total |
|---|---|---|---|---|
| Business Expense | 4,500 | 7 | 643 | 12.8% |
| Home Office | 2,800 | 4 | 700 | 7.9% |
| Vehicle | 7,694 | 4 | 1,924 | 21.8% |
| Medical | 4,500 | 5 | 900 | 12.8% |
| Charitable | 3,200 | 5 | 640 | 9.1% |
| Education | 3,650 | 2 | 1,825 | 10.4% |
| State Tax | 8,000 | 4 | 2,000 | 22.7% |
| Other | 900 | 1 | 900 | 2.6% |
| Grand Total | 35,244 | 32 | 1,101 | 100.0% |
The totals come from a running sum for each category, the counts from a matching entry count, and the average is simply one divided by the other. The percent column shows each category against the $35,244 grand total, which is the figure that anchors the whole workbook. Reading it, State Tax at $8,000 and Vehicle at $7,694 carry almost half the year between them, while Other, a single $900 investment advisory fee, barely registers. That distribution is the kind of thing a drawer of receipts hides and a summary makes obvious.
The average column adds a second reading that the totals alone miss. Education sits at $1,825 an entry off just two rows, a $3,200 tuition payment and a $450 certification exam, while Charitable averages $640 across five smaller gifts, so two categories close in total can behave nothing alike underneath. A high average on a low count usually points to a handful of large, well-documented items; a low average on a high count points to steady small spending that is easy to lose track of. Neither pattern is better or worse, but knowing which one a category follows tells you where the missing receipts are most likely to be, and the sheet surfaces it without any extra entry.
Sort it by IRS form: the Schedule Breakdown
The second rollup groups the same log by the schedule tag rather than the category, because the totals a return actually needs are organized by form. It splits Schedule A, Schedule C, and the other schedules into their own blocks, each with a gross amount, an entry count, an after-limits column, and a note.
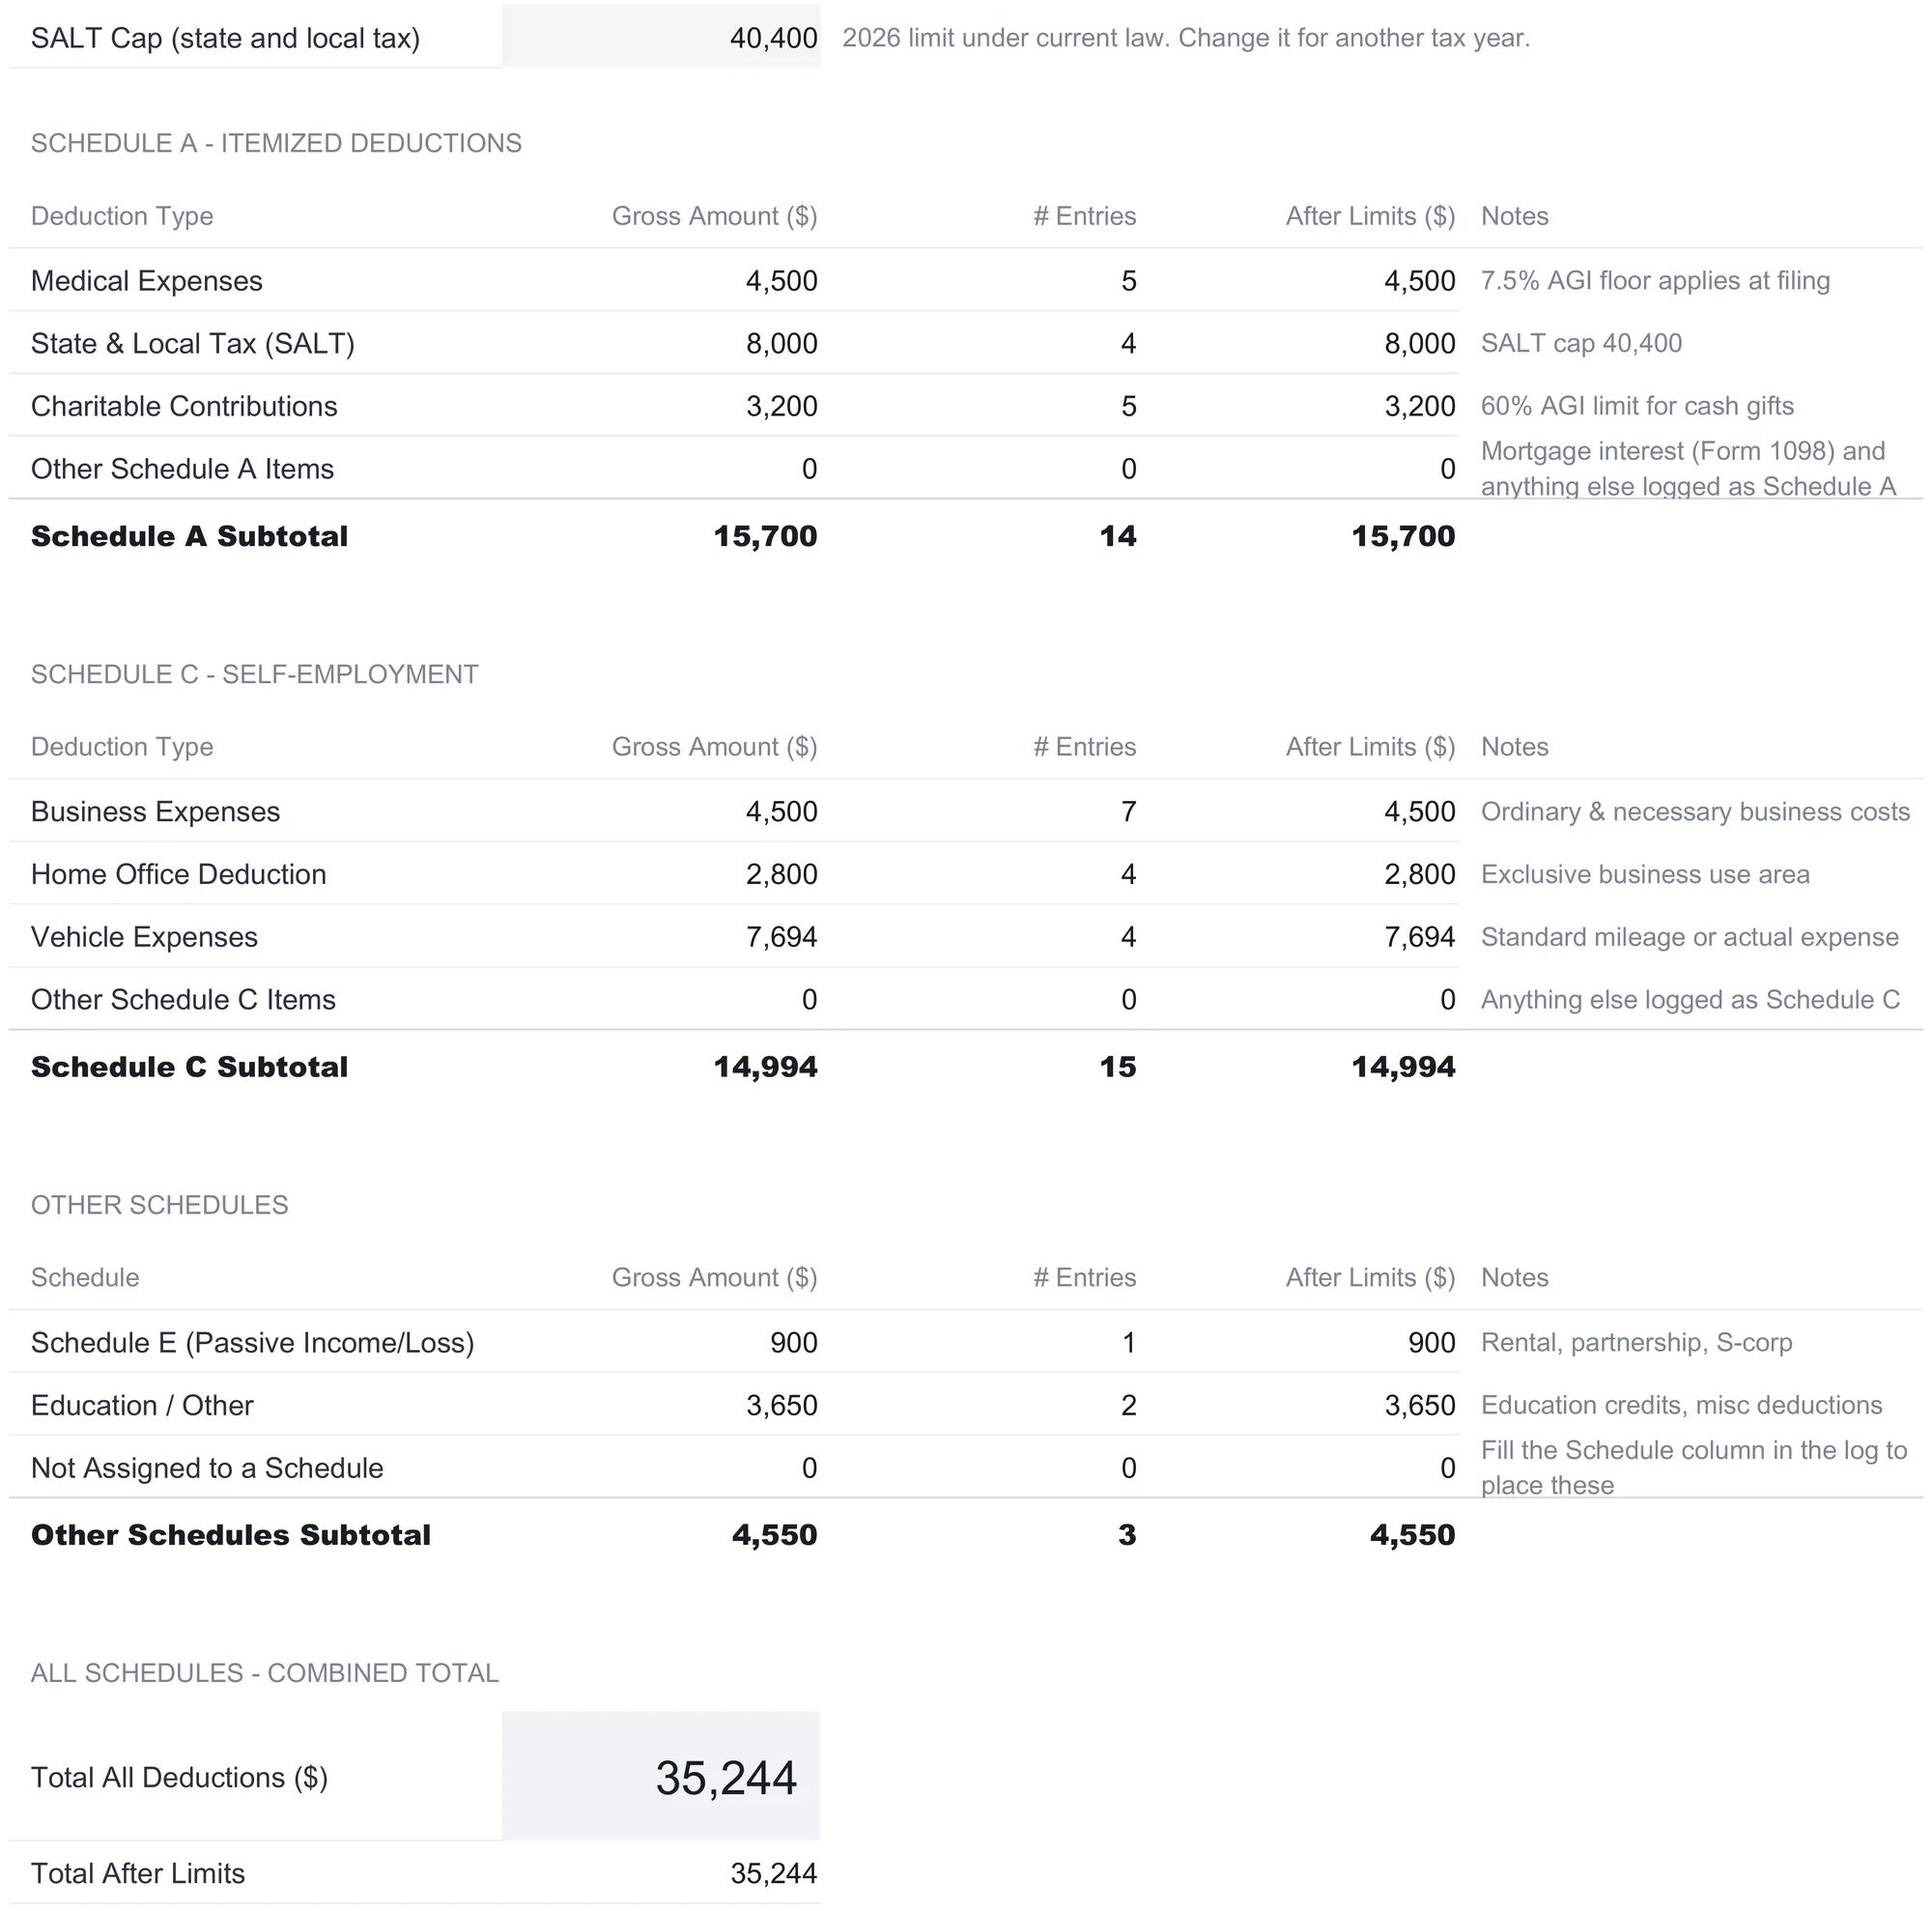
The Schedule A block gathers the itemized categories: Medical at $4,500, State and Local Tax at $8,000, Charitable at $3,200, and a catch-all “Other Schedule A Items” row for anything else tagged Schedule A, mortgage interest from a Form 1098 included. In the sample those add to a $15,700 Schedule A subtotal. The Schedule C block gathers the self-employment categories, Business Expenses at $4,500, Home Office at $2,800, and Vehicle at $7,694, for a $14,994 subtotal. A third block holds the remaining schedules: Schedule E at $900 and Education or Other at $3,650. The three subtotals reconcile to the same $35,244 the Category Summary reports. A “Not Assigned to a Schedule” row catches any entry whose schedule tag is blank, so the combined total always matches the log no matter how carefully each row was tagged.
One cell on this sheet is an input rather than a calculation: the SALT cap at the top, which the sample sets to 40,400 and labels as the 2026 limit under current law. It is the only limit the workbook actually applies to the numbers, capping the state-and-local-tax total at that figure through the after-limits column. Because tax limits move, the cap sits in its own editable cell with a note to change it for another year, and it is worth confirming the current figure against the IRS rather than trusting a sample. The other limits named on the sheet, the 7.5 percent medical floor tied to your adjusted gross income and the 60 percent AGI limit noted against charitable cash gifts, are flagged as things that apply when you file rather than adjustments the sheet makes, which is an honest distinction: the after-limits column reflects only the SALT cap, and the rest is left to your filing.
Watch the calendar: the Quarterly Summary
The third view rolls the log up by month. It reads each entry by its category and its date, drops it into the right month, and totals the twelve columns, then groups them into four calendar quarters, which the workbook offers as a guide to the payments due in April, June, September, and January. A Tax Year cell scopes the grid, so entries dated outside the year you set are not counted here.
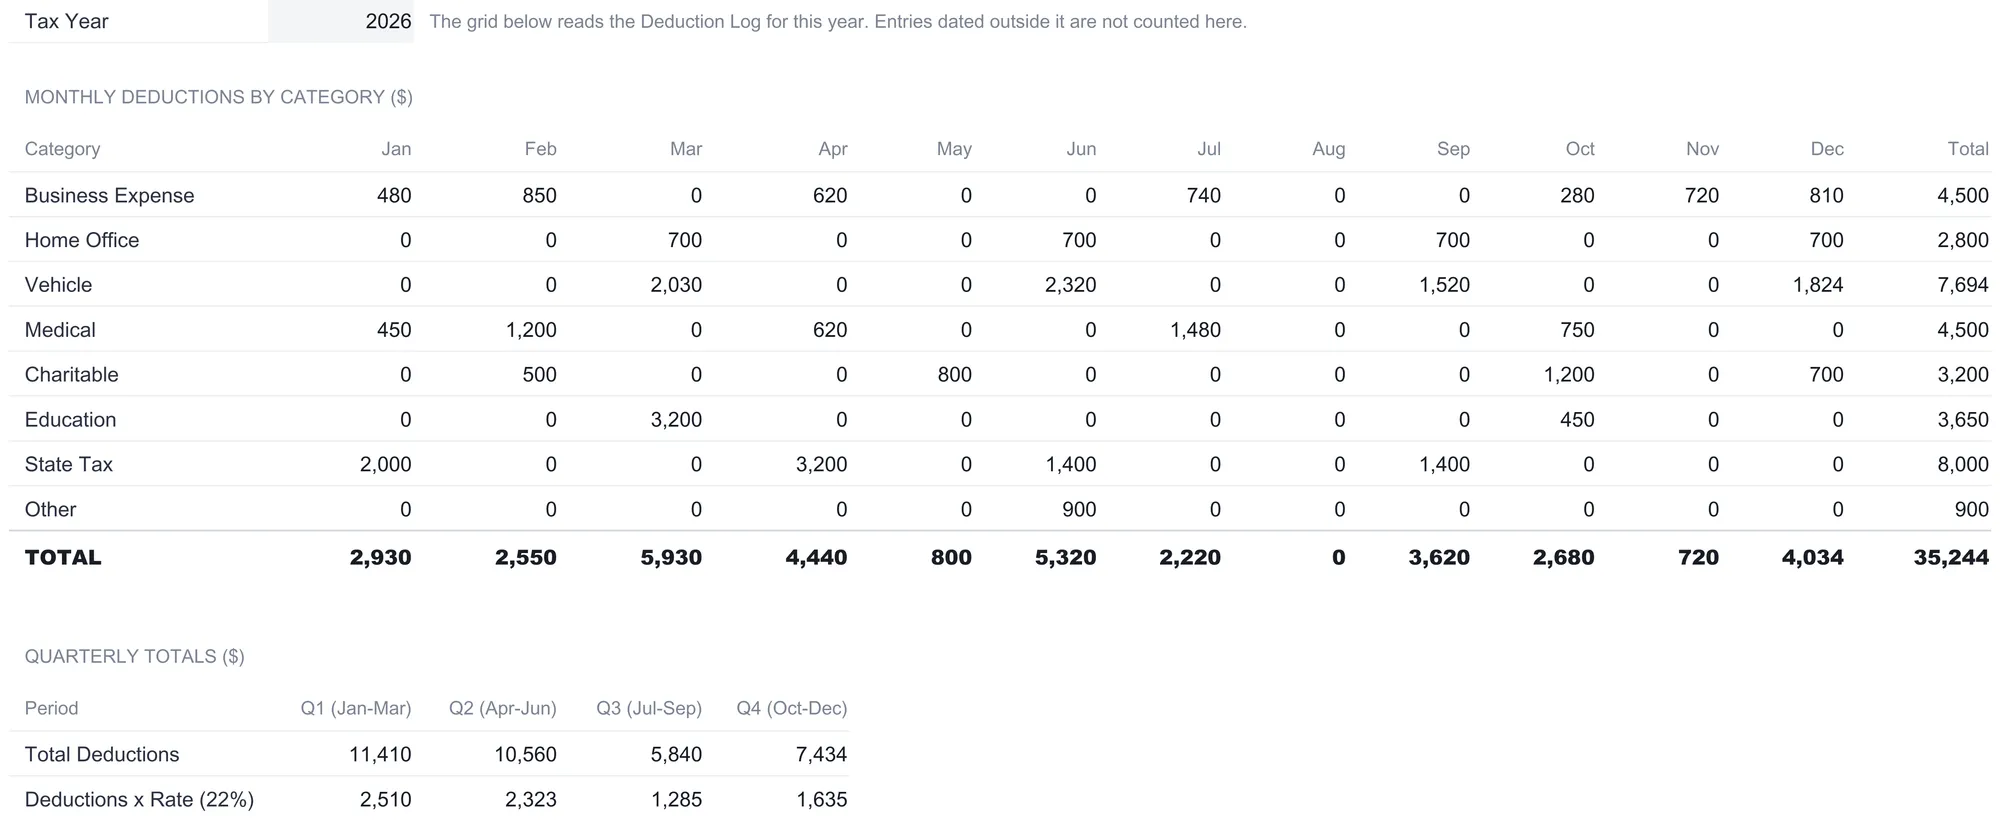
The sample year is lumpy, which is the point of seeing it monthly. March carries $5,930, lifted by a $3,200 graduate tuition payment and the first vehicle and home-office rows; August is empty; December totals $4,034 as the year-end charitable rows and a fourth vehicle quarter land together. Grouped into quarters, the sample reads $11,410 for the first, $10,560 for the second, $5,840 for the third, and $7,434 for the fourth, and those four numbers still sum to $35,244.
Below the quarterly totals sits a “Deductions x Rate” row, and its label is worth reading carefully. It multiplies each quarter’s total by the marginal rate set on the Tax Impact Calculator, which at the sample’s 22 percent turns the first quarter’s $11,410 into $2,510. The workbook is careful to call this exactly what it is, a quarter total times a rate, and not a savings figure. It is a rough sense of scale for the deductions logged in a period, useful when you are thinking about estimated payments, and nothing more.
Model the year: the Tax Impact Calculator
The last working sheet is where the tracking turns into an estimate. It takes four inputs, the filing status, gross income, standard deduction, and an estimated marginal rate, and runs a simplified comparison of taking the standard deduction against itemizing.
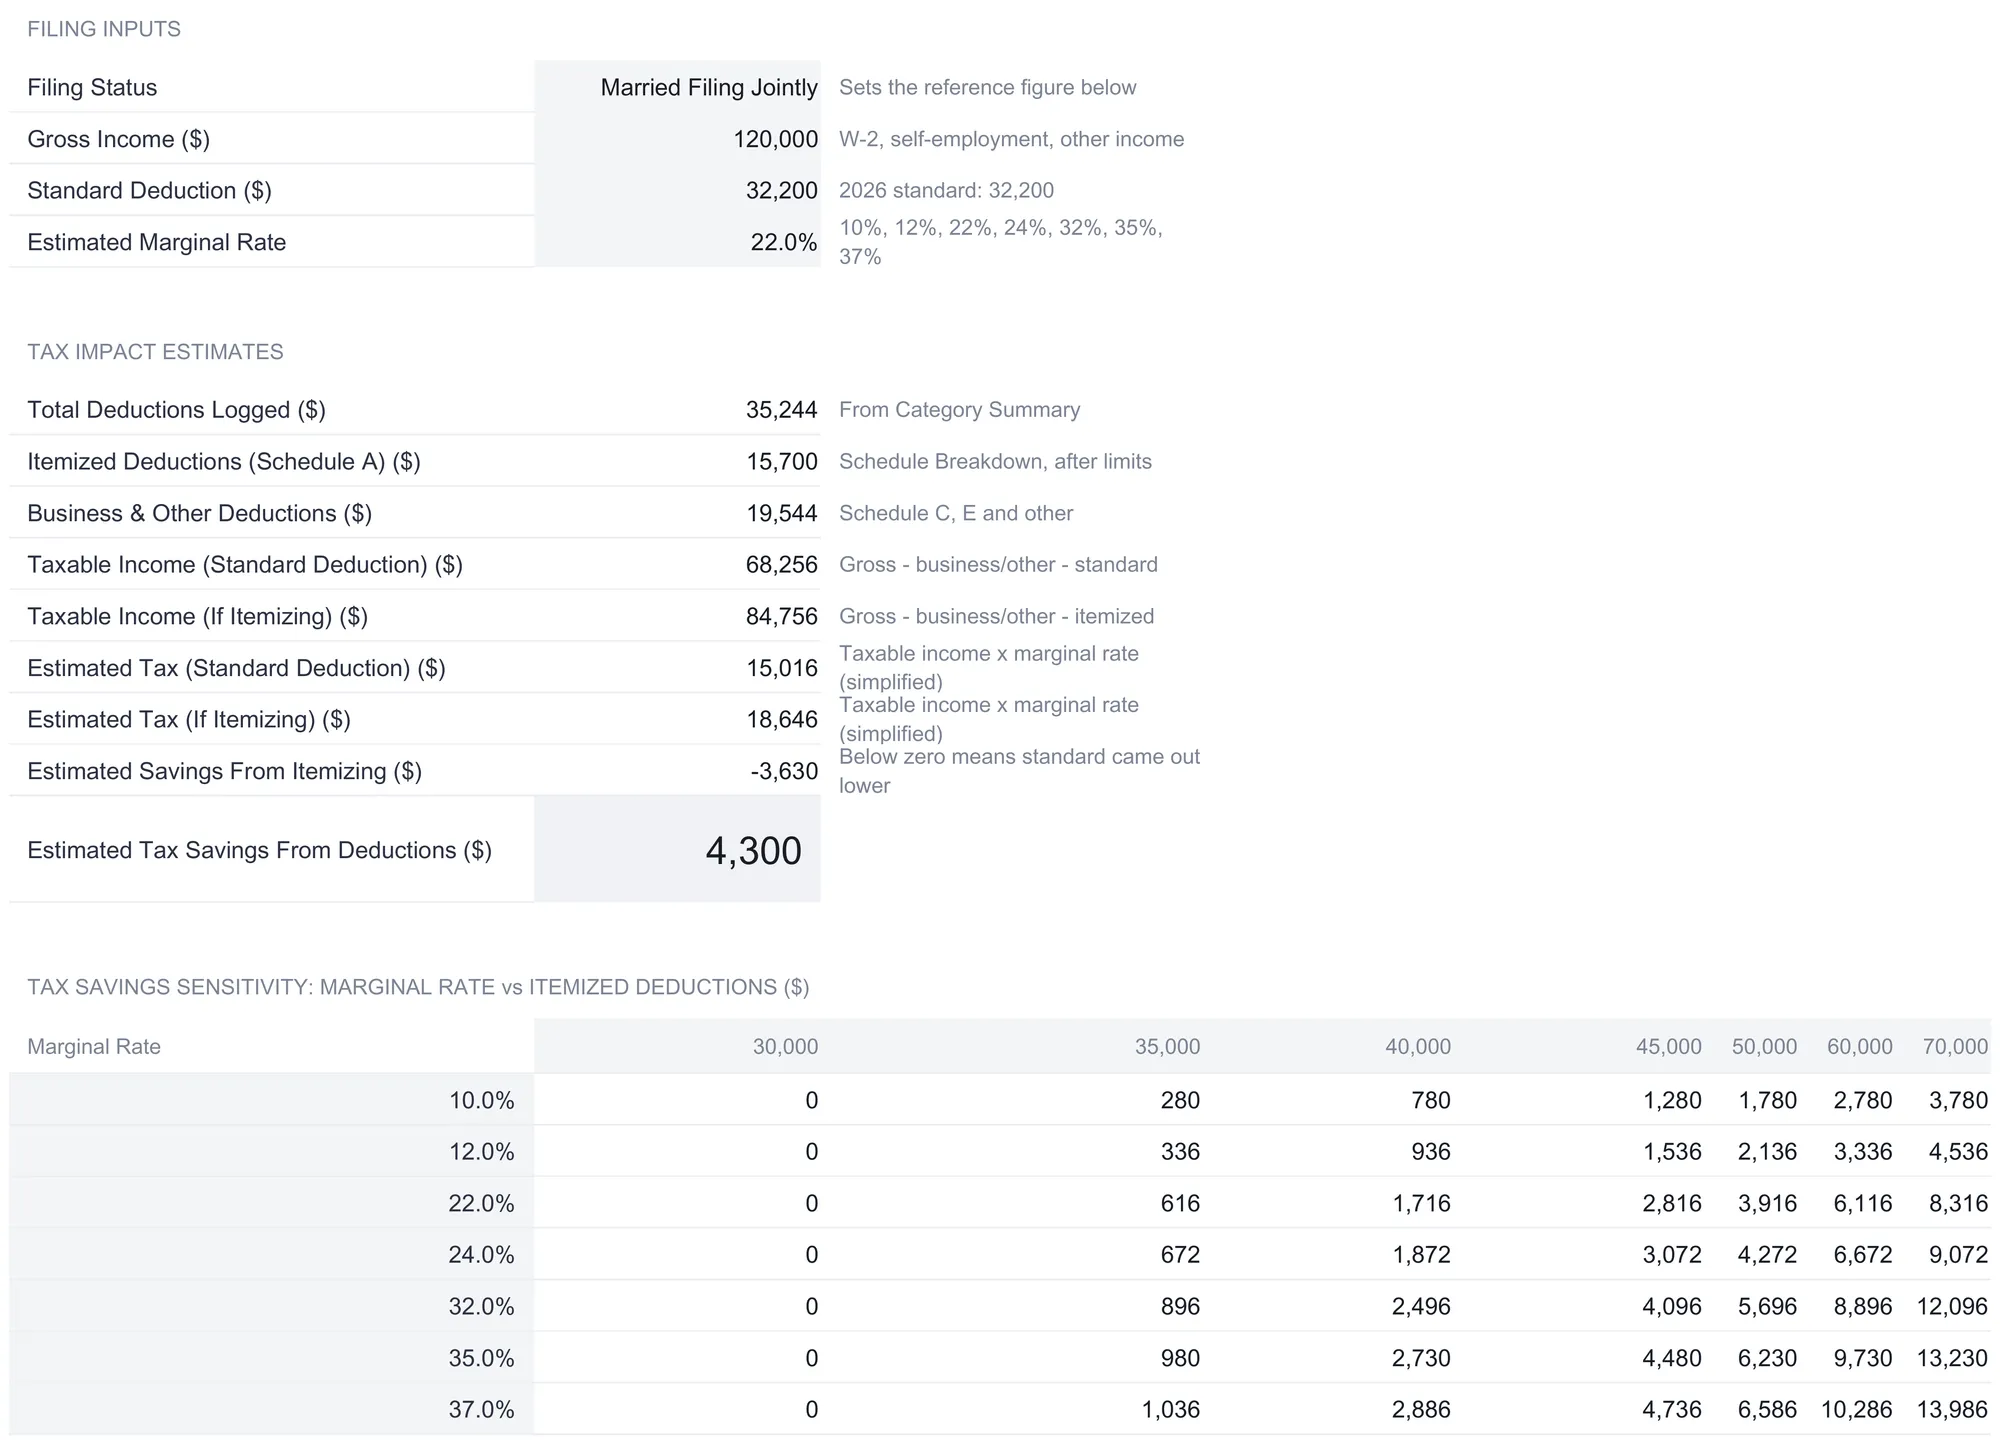
The sample models a married-filing-jointly household with $120,000 of gross income, a $32,200 standard deduction, and a 22 percent marginal rate. The filing-status choice sets the 2026 reference figure shown beside the standard-deduction cell, which itself stays editable, and the marginal rate is a single simplified rate rather than a bracket calculation. From there the sheet reads the deductions already logged and lays out the comparison:
| Line | Sample value ($) | What it is |
|---|---|---|
| Total Deductions Logged | 35,244 | From the Category Summary |
| Itemized Deductions (Schedule A) | 15,700 | Schedule Breakdown, after limits |
| Business & Other Deductions | 19,544 | Schedule C, E, and other |
| Taxable Income (Standard Deduction) | 68,256 | Gross minus business/other minus standard |
| Taxable Income (If Itemizing) | 84,756 | Gross minus business/other minus itemized |
| Estimated Tax (Standard Deduction) | 15,016 | Taxable income times marginal rate |
| Estimated Tax (If Itemizing) | 18,646 | Taxable income times marginal rate |
| Estimated Savings From Itemizing | -3,630 | Below zero means standard came out lower |
The key move is that only the Schedule A deductions get compared against the standard deduction. The Schedule C, E, and other deductions reduce income either way, so they are subtracted in both paths and never enter the itemize-versus-standard question. On the sample numbers the $15,700 of itemized deductions falls short of the $32,200 standard, so the “Estimated Savings From Itemizing” comes out negative, meaning the standard deduction produced the lower tax here. That is the calculation most people run in their heads and get wrong, and seeing it resolved to a single signed number is most of the sheet’s value.
Above all of this sits the headline figure the dashboard also shows: an “Estimated Tax Savings From Deductions” of about $4,300. It compares the tax on income with no deductions logged at all against the better of the two deduction paths, so on the sample it works out to the roughly $19,544 of business and other deductions valued at the 22 percent rate. It is arithmetic on the inputs, not a forecast. The workbook labels these as simplified estimates precisely because a real return depends on credits, phase-outs, and other factors the sheet does not attempt to model, which is why the same sheet points to a tax professional for anything that turns on your specific situation.
A sensitivity grid at the bottom extends the idea. It lays out estimated savings across a range of marginal rates, from 10 percent to 37 percent down the side, against a range of itemized totals, from $30,000 to $70,000 across the top, so you can read how the number moves as either input changes. Both axes are editable, which turns the grid into a small what-if table rather than a fixed picture.
The dashboard: six numbers and a chart
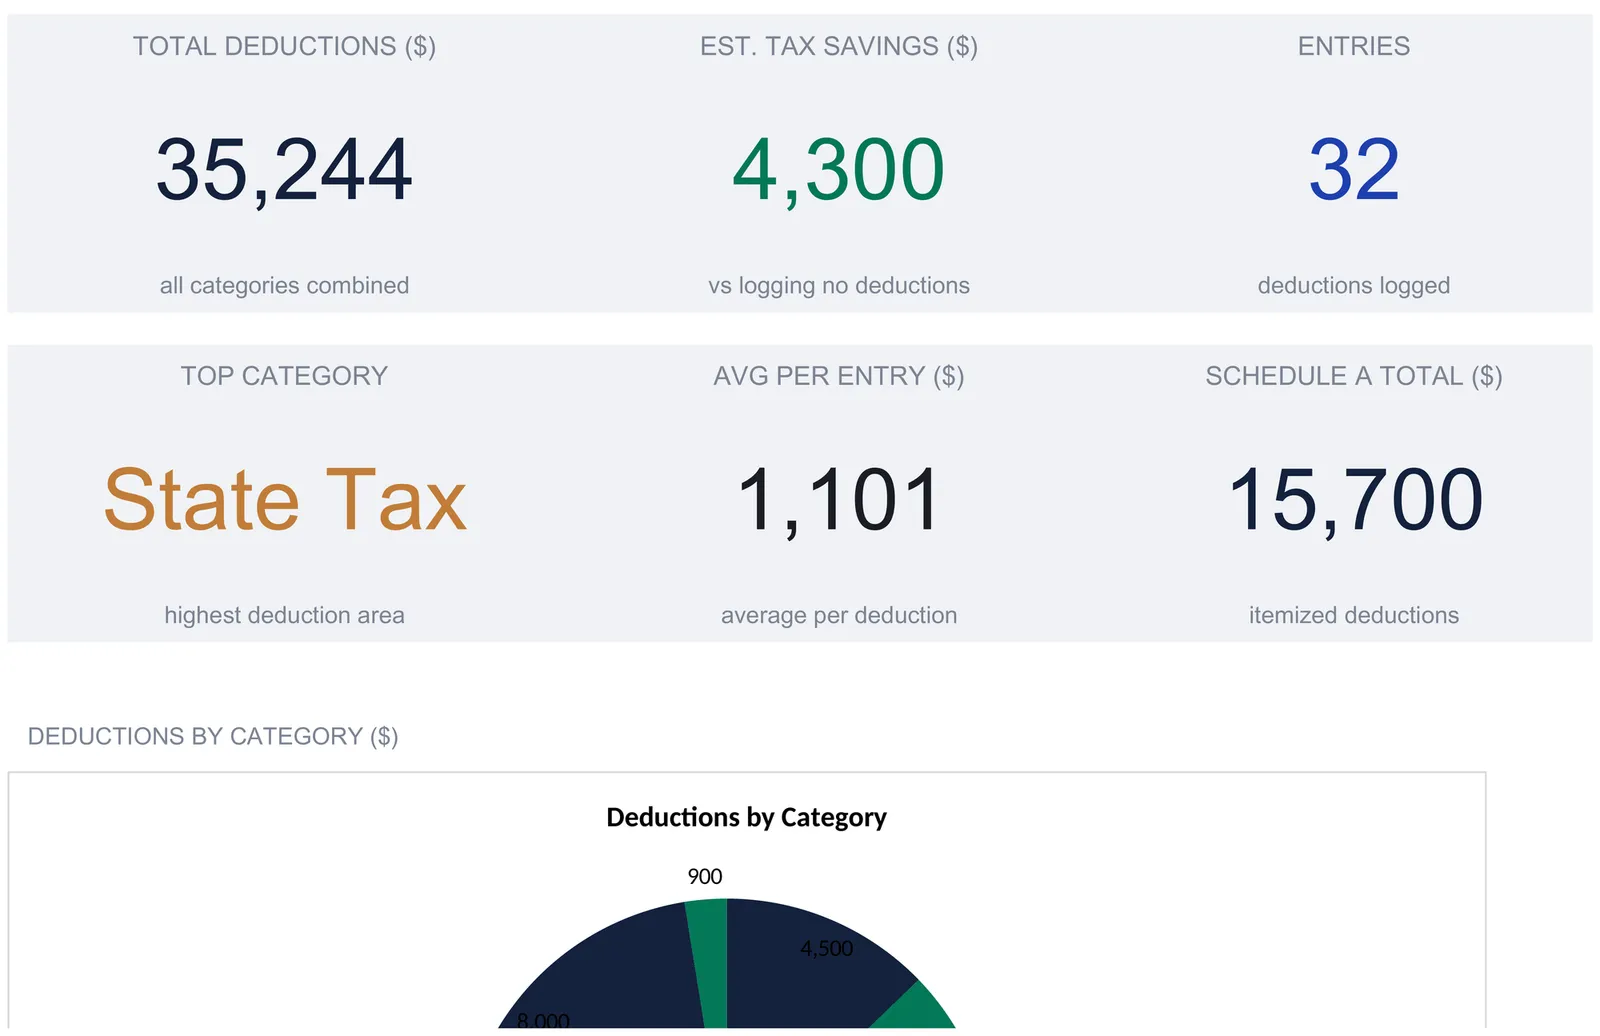
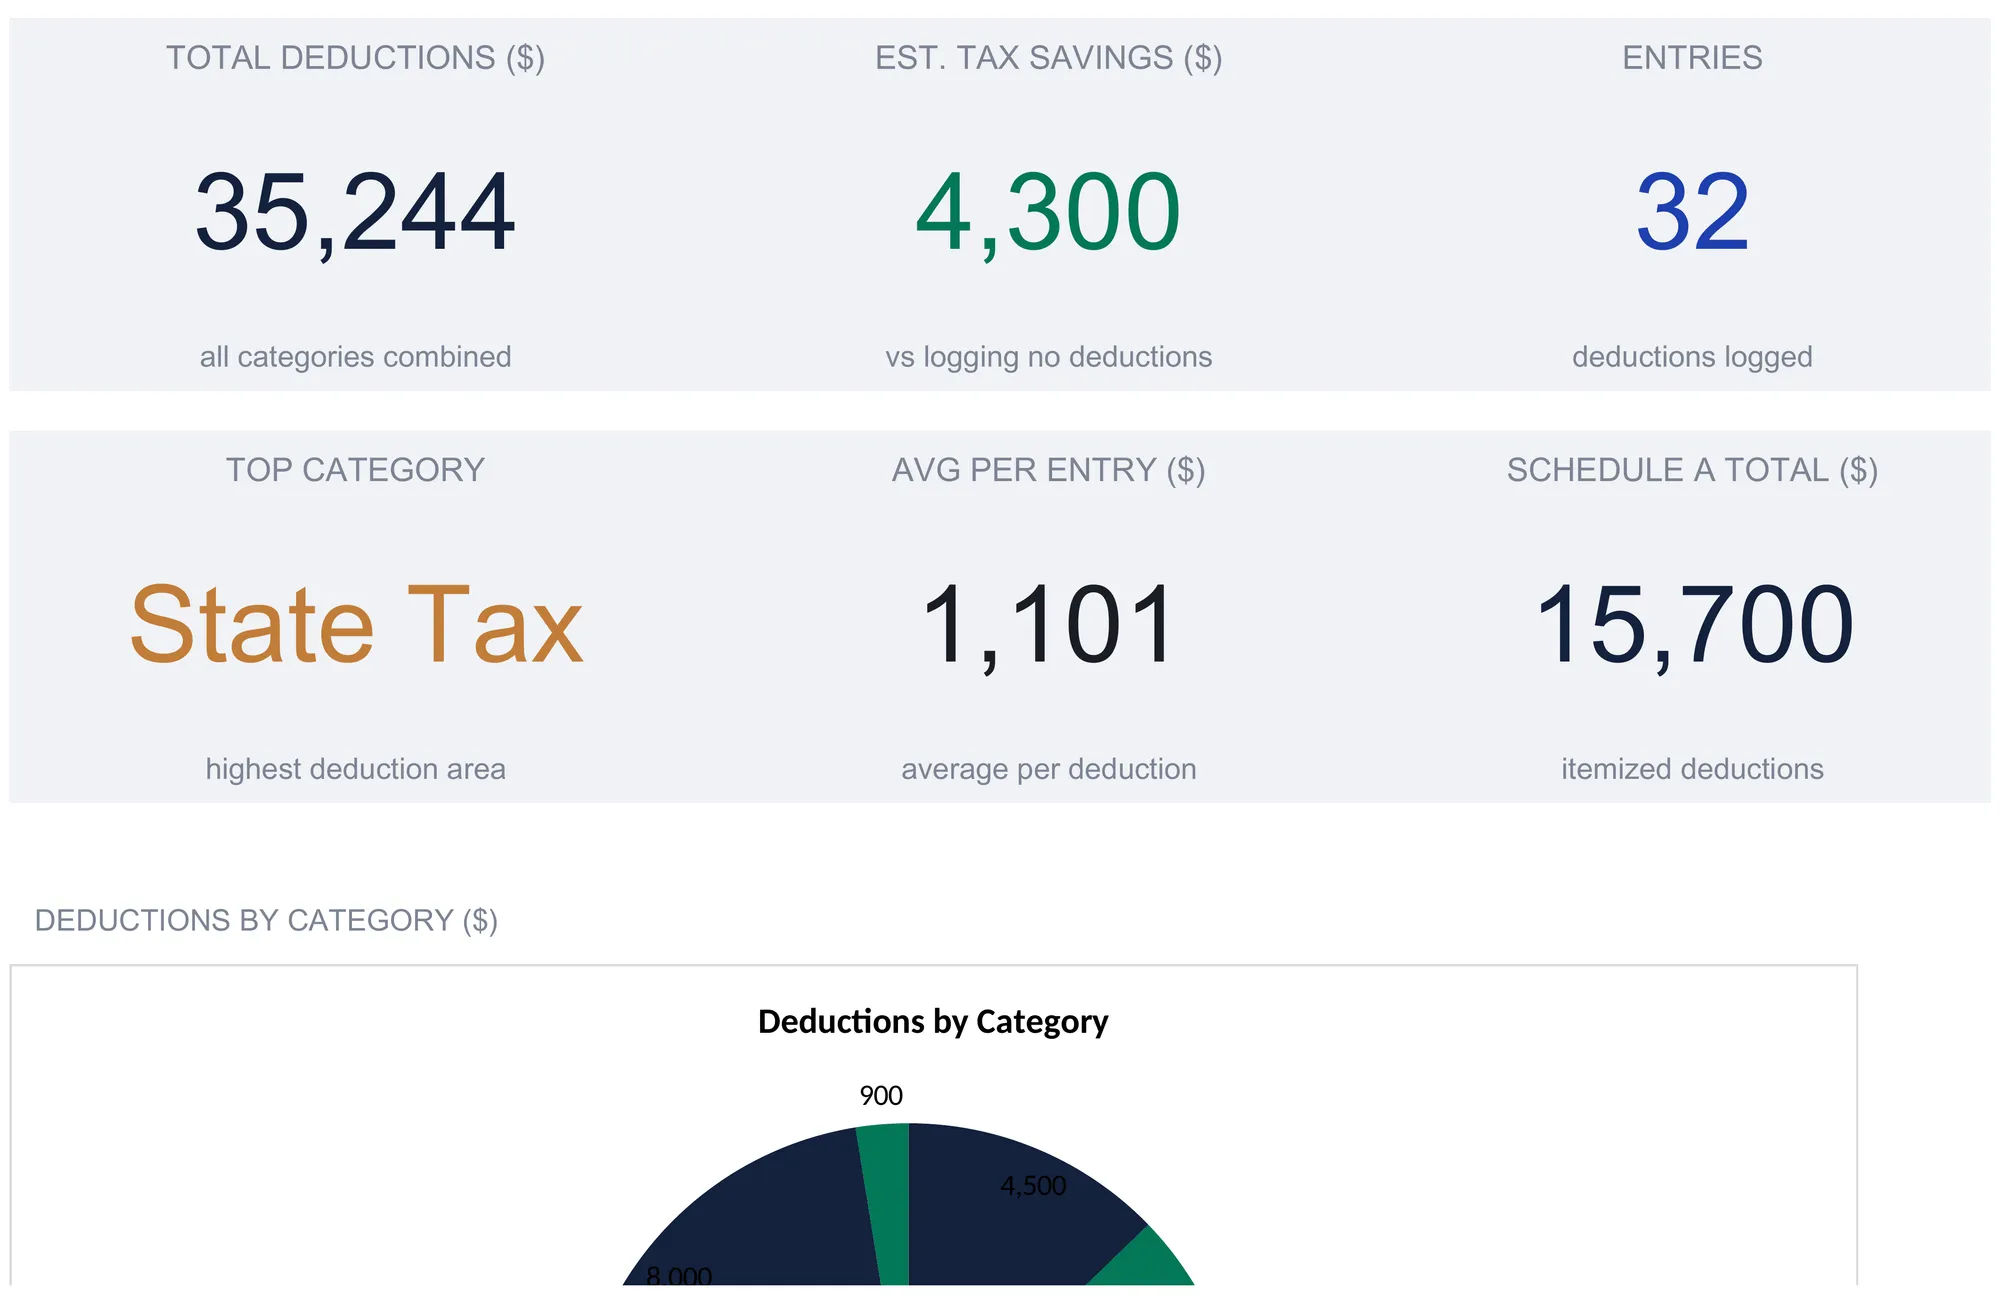
With the log filled, the Dashboard reduces the year to six KPI tiles and a chart. The top row shows the total deductions, the estimated tax savings, and the entry count; the bottom row shows the top category, the average per entry, and the Schedule A total.
| Metric | Sample value | How it is derived |
|---|---|---|
| Total Deductions | $35,244 | Grand total from the Category Summary |
| Estimated Tax Savings | $4,300 | Read from the Tax Impact Calculator |
| Entries | 32 | Count of logged deductions |
| Top Category | State Tax | Largest category total |
| Avg per Entry | $1,101 | Total deductions divided by entries |
| Schedule A Total | $15,700 | Itemized subtotal from the breakdown |
Because the Estimated Tax Savings tile reads straight from the Tax Impact Calculator, the dashboard and that sheet cannot give different answers, and the same is true of every other tile: each is a pointer into a sheet that already computed it. Below the tiles, a pie chart breaks the year down by category, which is where State Tax and Vehicle carrying nearly half the total becomes visible at a glance rather than by scanning a column.
What the sheet decides, and what it does not
It is worth being precise about the line the workbook draws, because tax is where a spreadsheet is easiest to over-read. The sheet decides where a number goes: given a category and a schedule, it sorts, totals, caps state-and-local tax at the figure you entered, and estimates a tax impact at the rate you chose. It does not decide whether an expense is deductible, which schedule it truly belongs on, or what you will owe. Those turn on facts the workbook never sees, and its own How to Use sheet says as much, in plain terms, more than once: keep documentation for every entry, verify the current limits, and consult a CPA or tax professional for your situation.
That division is what keeps the tool honest. A sample listing $35,244 of deductions and an estimated $4,300 of savings is arithmetic on sample inputs, not a claim about a real return. Change the income, the rate, the SALT cap, or any single logged amount and both numbers move, which is exactly how an estimator should behave and exactly why it is not advice.
Excel or Google Sheets for a deduction tracker
The tracker is an .xlsx file built on plain formulas, with no macros and no add-ons, so it runs identically in Microsoft Excel, in Google Sheets after upload, and in LibreOffice Calc. Google Sheets suits people who want the file in Drive and reachable from a phone when a receipt arrives; Excel suits those who prefer a local copy. A currency selector on the Dashboard relabels every money column and KPI across the workbook, changing only the symbol shown and not converting the underlying numbers. The structure described here is equally buildable in either program by hand, and the tinted cells mark the ones meant for entry while the white cells hold the formulas.
What each tier includes
- Tax Deduction Tracker Ultimate Spreadsheet Template ($29) is the workbook this walkthrough follows: the 150-row deduction log, the category and schedule rollups, the monthly and quarterly grid, the tax-impact calculator with its sensitivity grid, and the six-tile dashboard.
- The free Tax Deduction Tracker is a single deductions sheet for anyone who just wants to start logging, and the Tax Deduction Tracker Essentials ($19) adds a dashboard on top of that log.
- The 1099 Income Tracker Ultimate Spreadsheet Template ($29) is the companion on the income side, with an income log, client summary, quarterly estimates, and a Schedule C prep sheet, for freelancers who want to track what came in alongside what went out.
Related
- Tax Deduction Tracker in Google Sheets: Schedule A Categories, Row by Row - how to build a deduction log from scratch, with the Schedule A category mapping and the standard-deduction comparison
- 25 Self-Employed Tax Deductions for 2026 (With Tracker Template) - the deductions themselves, mapped to their Schedule C lines, for deciding what belongs in the log
Frequently asked questions
Does the tracker decide which expenses are deductible?
No. It totals whatever you log and sorts it by the category and schedule you assign to each row. Whether a given expense is actually deductible, and on which form, depends on your situation, and the workbook says as much on its How to Use sheet. The sheet is a tracking and estimation tool; a tax professional or the IRS confirms what qualifies for you.
How does the sheet handle the 2026 mid-year mileage change?
You compute the dollar figure and log that, so the rate lives in your entry rather than in a formula. The sample splits vehicle mileage by date: quarters in the first half of 2026 use 72.5 cents a mile and quarters in the second half use 76 cents, matching the IRS mid-year change. A first-quarter row of 2,800 miles logs as $2,030, and a third-quarter row of 2,000 miles logs as $1,520.
What is the difference between the Category Summary and the Schedule Breakdown?
They group the same log two ways. The Category Summary totals by expense type, the eight categories from the dropdown, so it answers where the spending went. The Schedule Breakdown totals by the IRS form you tagged each row with, splitting Schedule A, Schedule C, and other schedules, and it is the only sheet that applies the SALT cap. Both reconcile to the same $35,244 grand total.
Does the Estimated Tax Savings figure mean I will get that back?
No. It is simplified arithmetic: the sheet multiplies taxable income by the single marginal rate you enter and compares the result with and without the logged deductions. The workbook flags these as simplified estimates because actual tax depends on credits, phase-outs, and other factors the sheet does not model. It is the arithmetic value of the sample inputs, not a promise of a refund.
Can one file track more than one tax year?
The Quarterly Summary scopes its grid to the Tax Year cell, so entries dated outside that year are not counted there. Every other sheet reads the whole log regardless of date: the Category Summary, the Schedule Breakdown, the Tax Impact Calculator, and the Dashboard total every row that carries an amount. Logging a second year cleanly means keeping a separate copy of the file, since only the monthly grid filters by year.
Sources
- Standard Mileage Rates - Internal Revenue Service
- About Schedule A (Form 1040), Itemized Deductions - Internal Revenue Service
About this article
Sheets, inputs, formulas, sample figures, and chart type checked on 2026-09-10 against the shipped Tax Deduction Tracker Ultimate workbook (Dashboard, Deduction Log, Category Summary, Schedule Breakdown, Quarterly Summary, Tax Impact Calculator, How to Use). The 2026 mid-year business mileage rates and the Schedule A reference checked against the live IRS pages at writing time. Last reviewed September 2026.