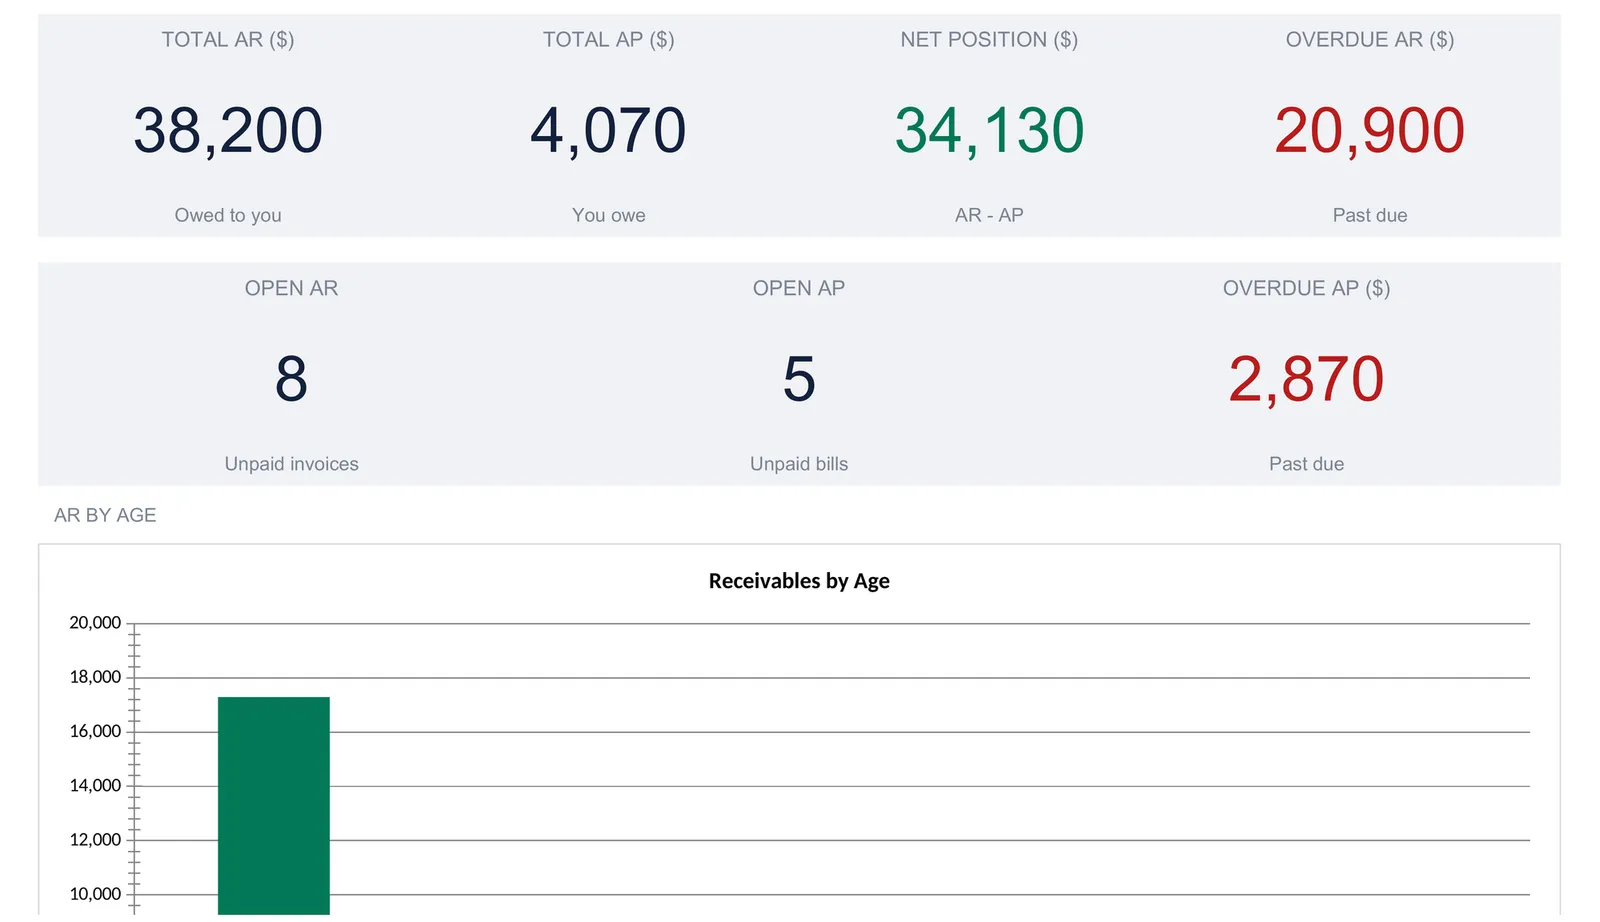
An accounts receivable and payable tracker keeps two ledgers in one workbook, what customers owe you and what you owe vendors, and derives the rest: balance, days overdue, status, an aging report on each side, and the net cash position between them. This walkthrough builds the whole thing from a worked example of 10 invoices and 8 bills, 38,200 in receivables against 4,070 in payables, and a net position of 34,130. Our AR / AP Tracker Spreadsheet Template ($29) ships the same structure ready-made for Excel and Google Sheets.
Most small businesses can answer one of their two money questions instantly and stall on the other. “How much have I billed this month?” is easy, because the invoices are sitting in an outbox. The question that decides whether the bank account fills or drains is two-sided: who owes me right now, and who am I about to owe? Cash comes in from customers and goes out to suppliers, and looking at only one of those flows tells you half a story. A business can be owed a comfortable pile and still be a week from a cash squeeze if the bills landing that week outrun the payments coming in.
Holding both sides at once is what an accounts receivable and payable tracker is for. The structure is a pair of ledgers, one for what customers owe you and one for what you owe vendors, plus a short contact list, an aging view on each side, and a dashboard that nets the two totals against each other. The examples below come from our AR / AP Tracker Spreadsheet Template ($29), which ships the whole thing ready-made for Excel and Google Sheets. The layout is reproducible by hand if you would rather build your own.
What an AR/AP tracker has to hold
Strip away the accounting software and there are only a few kinds of data behind receivables and payables:
- A report date and business details. The single date every calculation measures against, plus the business name and a currency symbol for display.
- A party list. The customers who owe you and the vendors you owe, each with a contact and payment terms.
- Two transaction ledgers. One row for every invoice customers still owe on, one row for every bill you still owe on. This is the raw material for everything else.
- Derived views. Balance, days overdue, status, an aging report on each side, and the net position. These are calculations, not entries; in a well-built sheet, nothing here is ever typed.
The tracker gives each of these its own sheet. Settings holds the report date, Contacts holds the party list, Receivables and Payables are the two ledgers, Aging sorts both by age, and the Dashboard nets them together. A How to Use sheet carries the instructions. The tabs themselves run the other way round, Dashboard first and Settings near the end, because the Dashboard is the summary rather than the starting point. This walkthrough builds up to it instead: Settings first, then Contacts, then the two ledgers, then Aging, then the Dashboard on top.
Start with the report date: the Settings sheet
Three fields on the Settings sheet set up the whole workbook, and one of them does more work than any other cell in the file.
The As-of date. This is the report date, 2026-08-15 in the sample, and it is the reference point for every overdue and aging calculation on both ledgers. A bill is overdue only if its due date has passed the As-of date; an invoice ages into a bucket based on how many days sit between its due date and the As-of date. Because the whole file measures against this one cell rather than against today, the report is stable: open it next month, and nothing shifts until you move the date. Changing the As-of date rolls the entire report forward, re-dating every overdue flag and every aging bucket in one move.
Business name. Typed once, it appears in the heading of every working sheet.
Currency symbol. A dropdown with 35 options, from the dollar and euro through to the rupee, real, and won. Choosing one relabels every money column header and every dashboard tile across the workbook. It relabels only, with no conversion of the underlying numbers, which the How to Use sheet states plainly.

That single As-of date is the design decision worth copying into any hand-built version. Spreadsheets that measure “overdue” against the live current date look convenient, but they mean the report can never be reproduced: a figure you quoted in a meeting has already changed by the time anyone checks it. A fixed report date trades that false freshness for something more useful, a statement that says the same thing every time it is opened.
Build the party list: the Contacts sheet
Before either ledger gets a row, the Contacts sheet names the people on both sides of the money. It carries two tables. The Customers table lists the businesses that owe you, and the Vendors table lists the businesses you owe. Each row holds a name, a contact person, an email, and a payment terms figure in days. The sheet has room for up to 12 customers and 12 vendors.
The sample fills four of each. On the customer side, Northwind Studio and Harbor & Co. run on 30-day terms, Brightline Group on 45 days, and Cedar Labs on 14. On the vendor side, Acme Hosting, PrintShop Ltd, and Legal Partners bill on 30-day terms and Studio Supplies on 15.
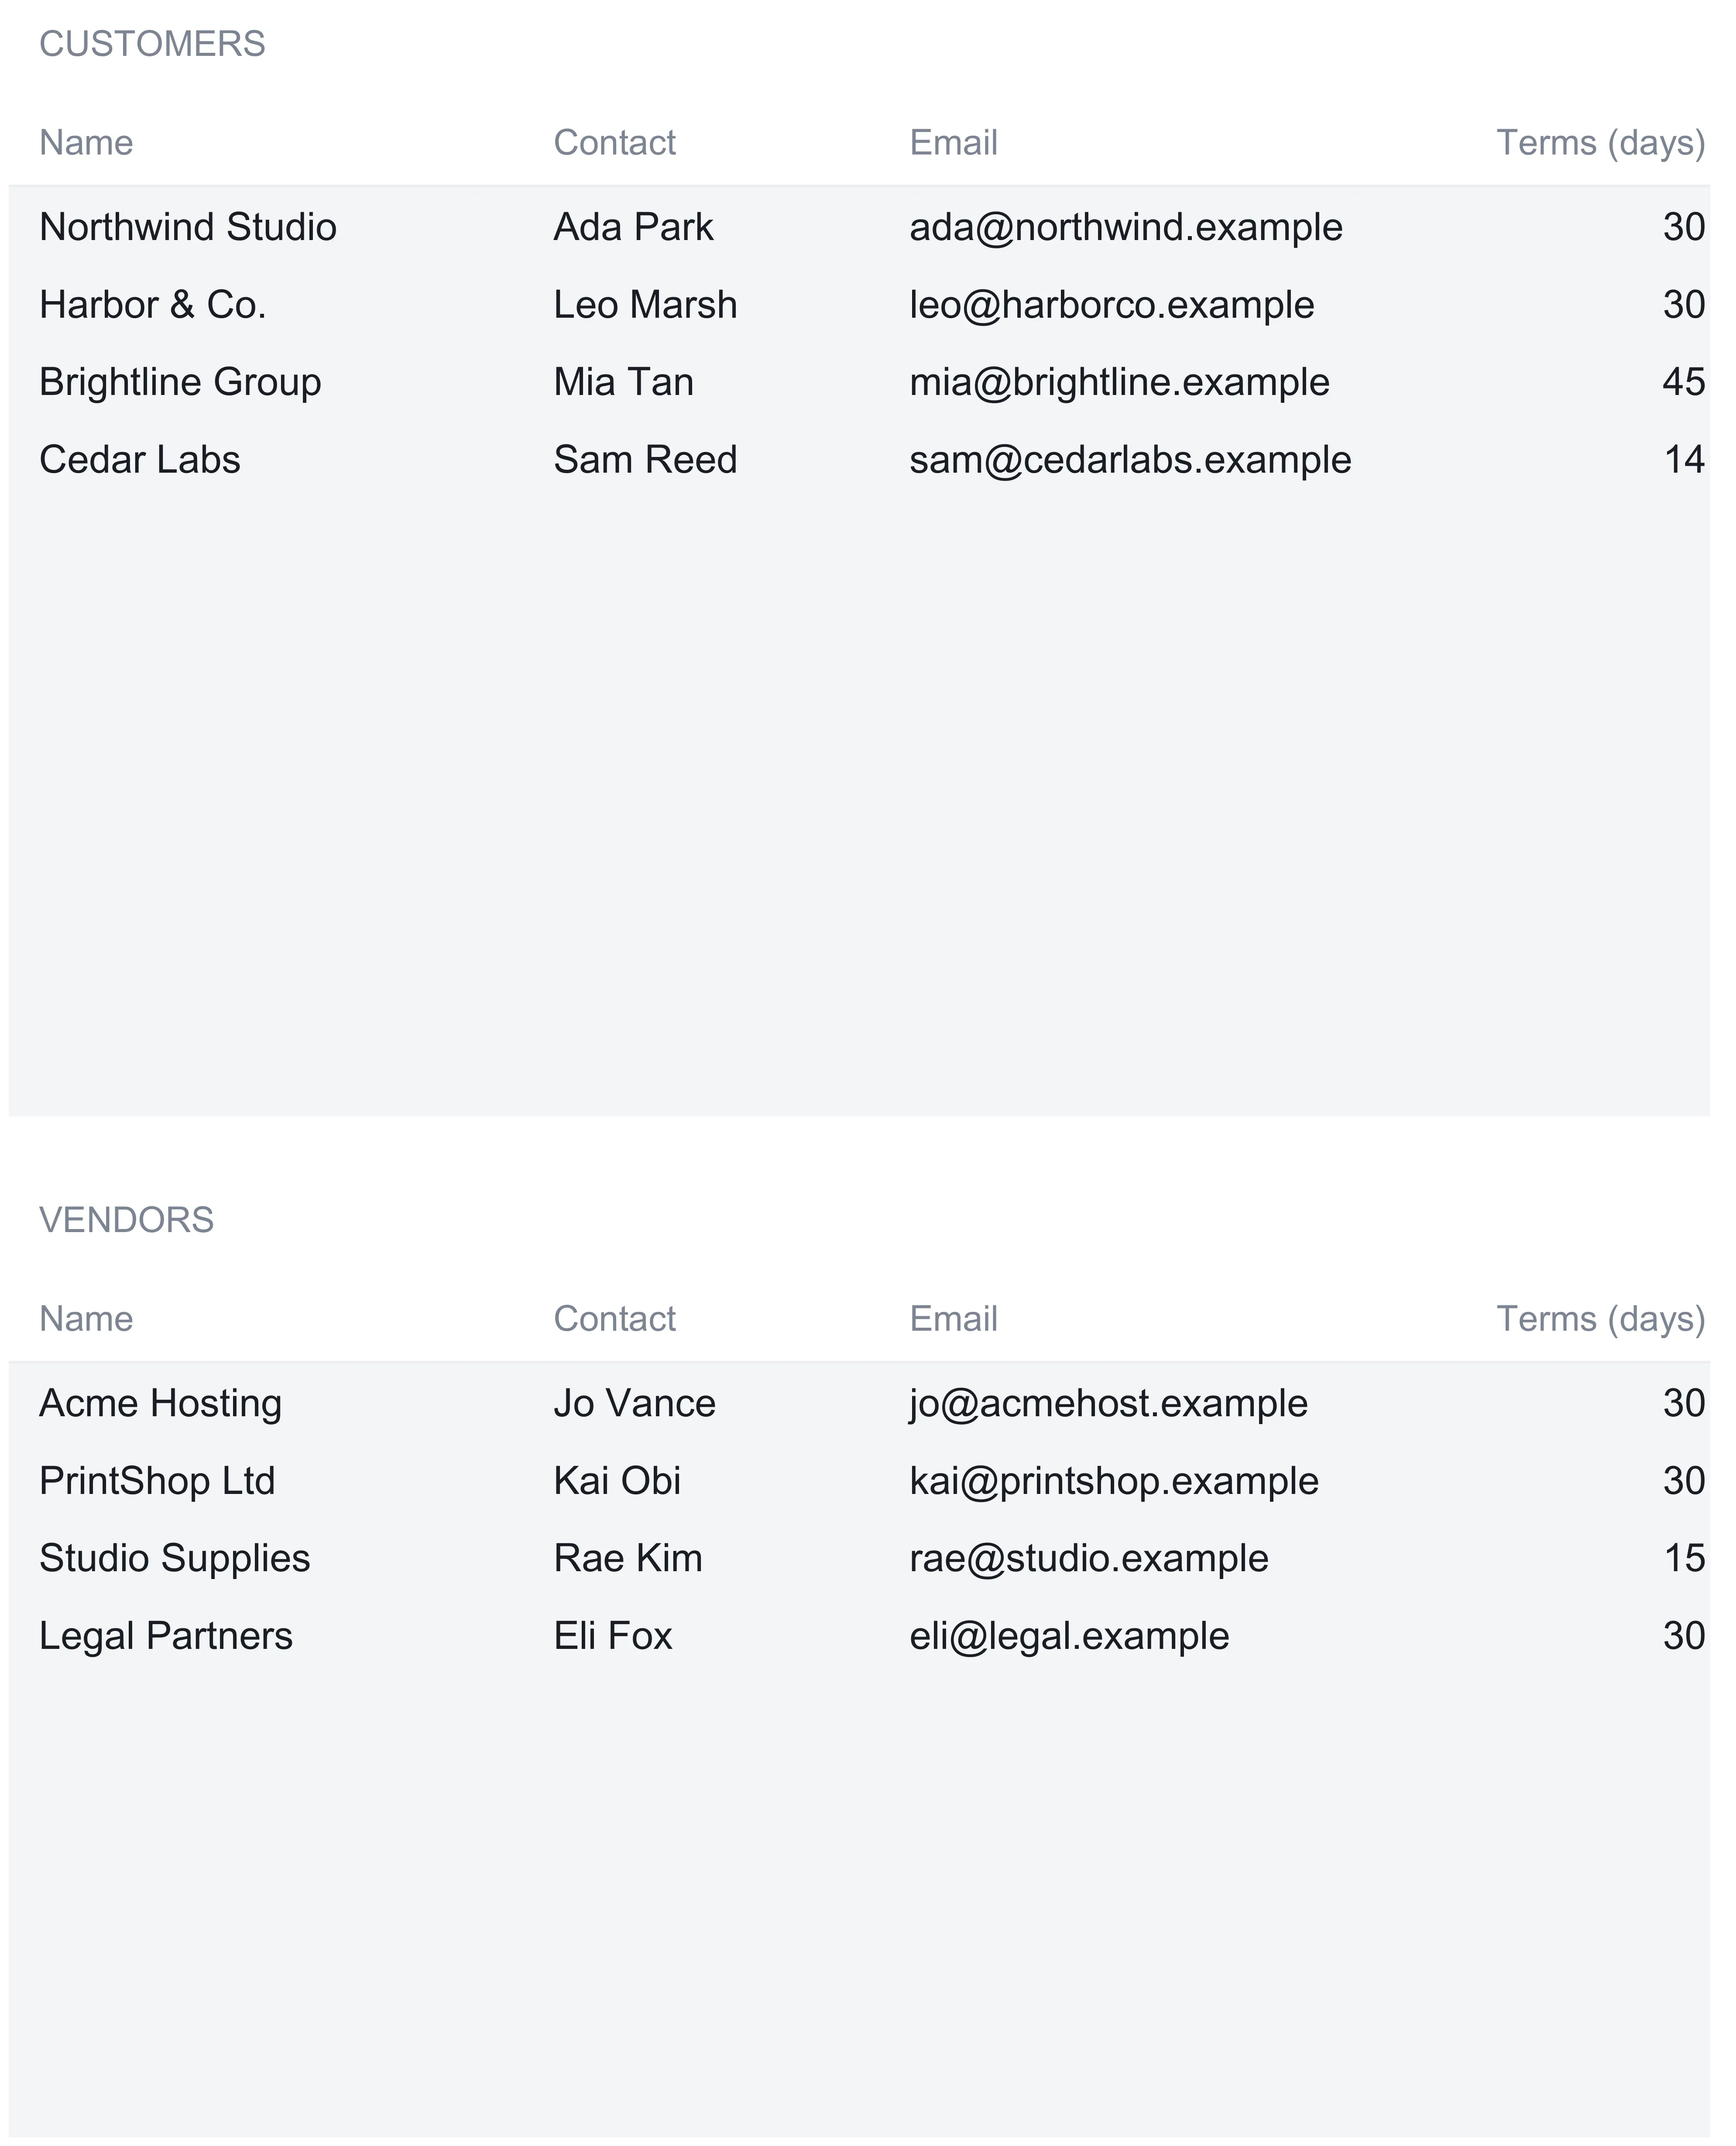
The list earns its place in two ways. First, both ledgers offer these names as a dropdown, so a customer is spelled one way everywhere and the totals never fragment because “Harbor & Co.” and “Harbor and Co” were logged as two parties. Second, the Aging sheet reports exactly one row per name on this list. A name typed on a ledger that never made it onto Contacts still counts in every total, but instead of getting its own aging line it lands in a catch-all Not on Contacts row. That design keeps the aging subtotals honest: each one equals its ledger total no matter how disciplined the contact list is.
Log what customers owe: the Receivables ledger
The Receivables sheet is the accounts receivable ledger, and it is one of only two places in the workbook where a transaction is ever typed. Each row is one invoice a customer still owes on. Six columns are entries and the last three are formulas.
The entries are the invoice number, the customer (from the Contacts dropdown), the issue date, the due date, the amount, and any partial payment received so far. From those, three columns compute themselves:
- Balance = amount - paid
- Days overdue = the As-of date minus the due date, floored at zero, and shown only while a balance remains
- Status = Paid, Overdue, Partial, or Open, decided in that order
One row makes the flow concrete. Invoice INV-2003 to Brightline Group was issued on 2026-05-22 for 9,500 with a due date of 2026-07-06, and 4,000 has been paid against it. The balance reads 5,500. Measured against the 2026-08-15 report date, the due date is 40 days past, so days overdue reads 40 and the status reads Overdue. Nothing in that row was worked out by hand. The invoice number, the customer, the two dates, the amount, and the 4,000 already collected were typed, and the balance, the days overdue, and the status followed from them.
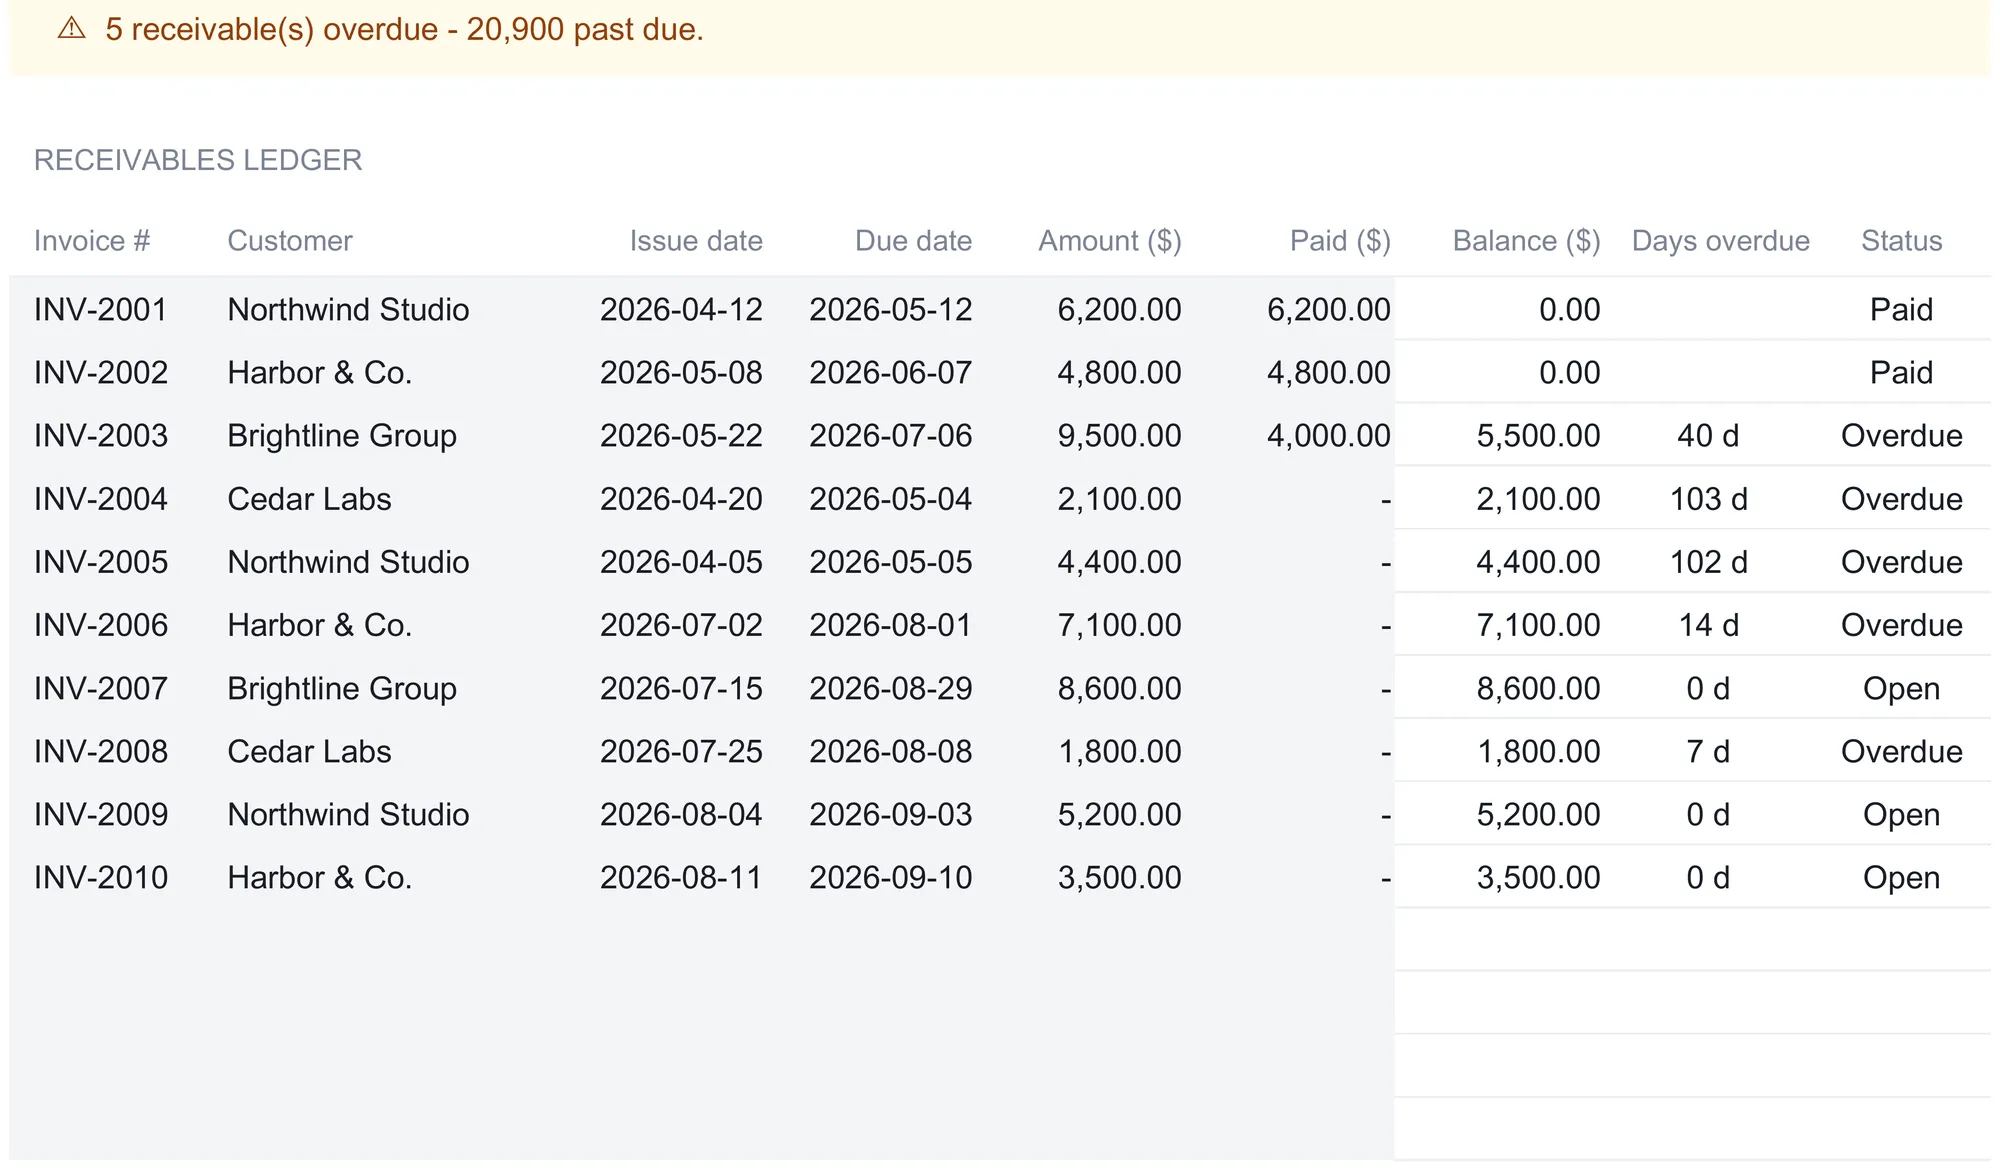
The sample ledger holds ten invoices. Two are fully paid, INV-2001 and INV-2002, so they drop out of every outstanding total. Three are Open, meaning they carry a balance but their due date has not yet passed the report date. The remaining five are Overdue, and they range from INV-2008 at 7 days past to INV-2004 at 103 days. Across all ten rows the ledger totals read 53,200 invoiced, 15,000 collected, and 38,200 still outstanding. A warning line at the top of the sheet states the overdue picture in one sentence: “5 receivable(s) overdue - 20,900 past due.”
Two details are worth carrying into any hand-built version. The blank rows below the last invoice already hold the balance, days-overdue, and status formulas and already sit inside every total, so the next invoice goes on the first free row and the whole workbook updates with no formula to drag down. And the status logic reads in a deliberate order, checking for Paid before Overdue before Partial before Open, which is why a part-paid invoice that is also past due resolves to Overdue rather than Partial. The overdue total counts what is genuinely late, not what merely has a partial payment against it.
Log what you owe: the Payables ledger
The Payables sheet is the mirror image, the accounts payable ledger, and it is the second and last place a transaction is typed. Every column, formula, and status rule matches the receivables side exactly, which is the point: reading one ledger teaches you the other. The only differences are the labels. The identifier column is Bill # instead of Invoice #, and the party column is Vendor instead of Customer, drawn from the vendor half of the Contacts list.
Each row is one bill you still owe on. Balance is amount minus what you have paid, days overdue is the As-of date minus the due date, and the status resolves through the same Paid, Overdue, Partial, Open ladder.
A worked row: bill BIL-9004 from Legal Partners was issued on 2026-06-21 for 1,500 with a due date of 2026-07-21, and 750 has been paid against it. The balance reads 750, the due date is 25 days past the report date, and the status reads Overdue. It is the payable-side twin of the Brightline invoice, a part-paid obligation that has crossed its due date.
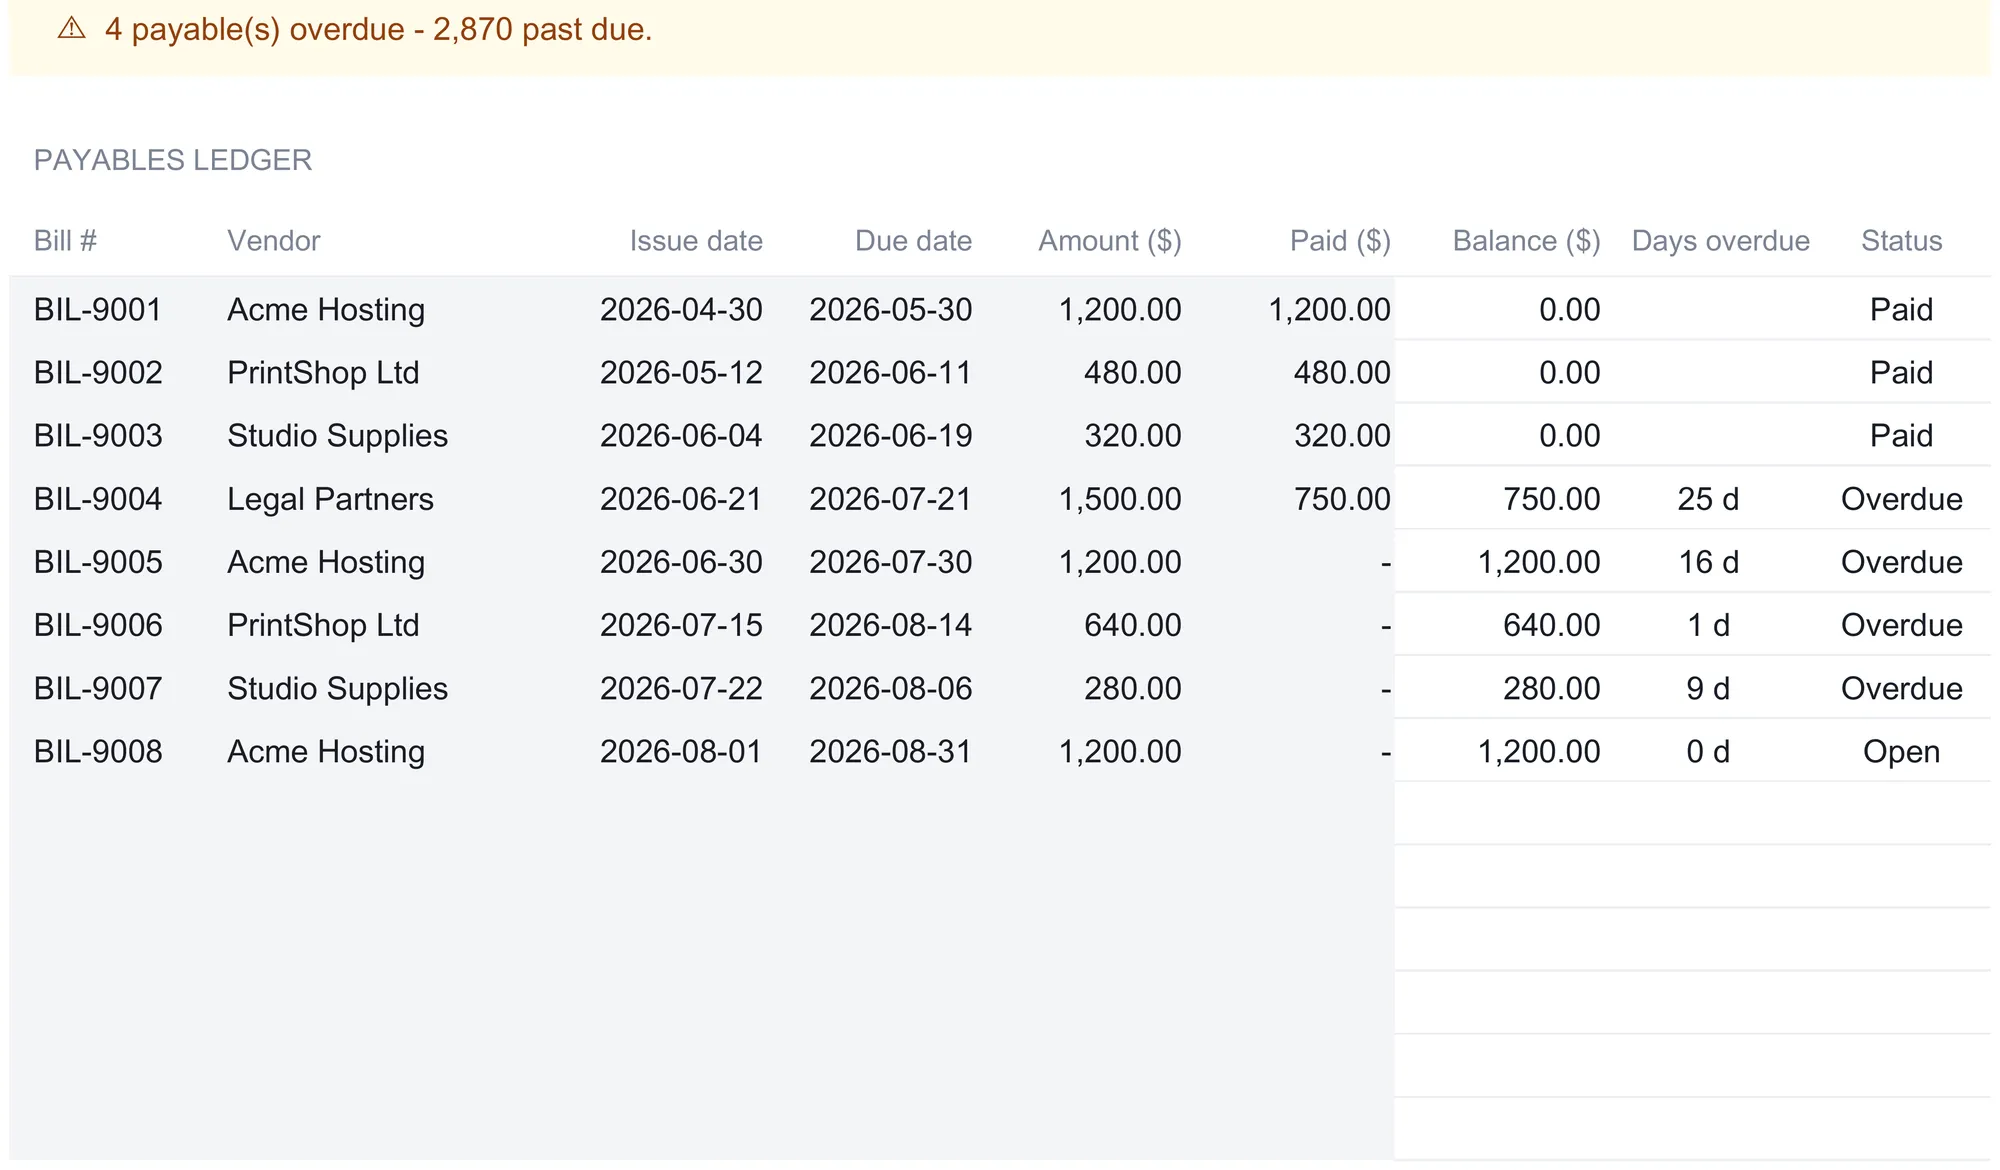
The sample ledger holds eight bills. Three are fully paid, four are Overdue, and one is Open. The overdue four are all recent, from BIL-9006 at a single day past to BIL-9004 at 25 days, so the payable side is far shorter and far fresher than the receivable side. The ledger totals read 6,820 billed to you, 2,750 paid out, and 4,070 still owed, with a warning line reading “4 payable(s) overdue - 2,870 past due.”
Seeing the two ledgers side by side is the reason the workbook exists. The receivable ledger carries 38,200 in balances stretching back three months; the payable ledger carries 4,070, almost all of it fresh. That contrast never shows up in a single bank balance, and it is precisely the shape a two-sided tracker is built to surface.
What neither ledger does is fill itself. There is no bank feed and no accounting-software import, so every invoice and every bill is a handful of typed cells drawn from the outbox and the inbox. For a business carrying a few dozen open items that is a few minutes a week; for one clearing hundreds of transactions a month it becomes real work, which is the gap full accounting software exists to close. The trade is manual entry against a file whose every formula you can read, change, and keep on your own machine.
Sort by age on both sides: the Aging sheet
Both totals so far are single numbers, and a single number hides the shape of what it contains. Being owed 38,200 reads differently depending on whether it is a fresh invoice sent last week or a balance that has been sitting unpaid for three months. The Aging sheet resolves that by sorting every open balance into columns by how far past due it is.
It carries two tables, one per side. The AR aging table lists each customer across five buckets, current, 1-30, 31-60, 61-90, and 90+, that last column holding anything more than 90 days past due, with a total-due column on the end. The AP aging table does the same for each vendor. Every cell is a formula reading straight from the matching ledger; nothing on the sheet is typed. The current bucket holds balances whose due date has not yet passed the report date, and the four overdue buckets split what is late by how late it is.
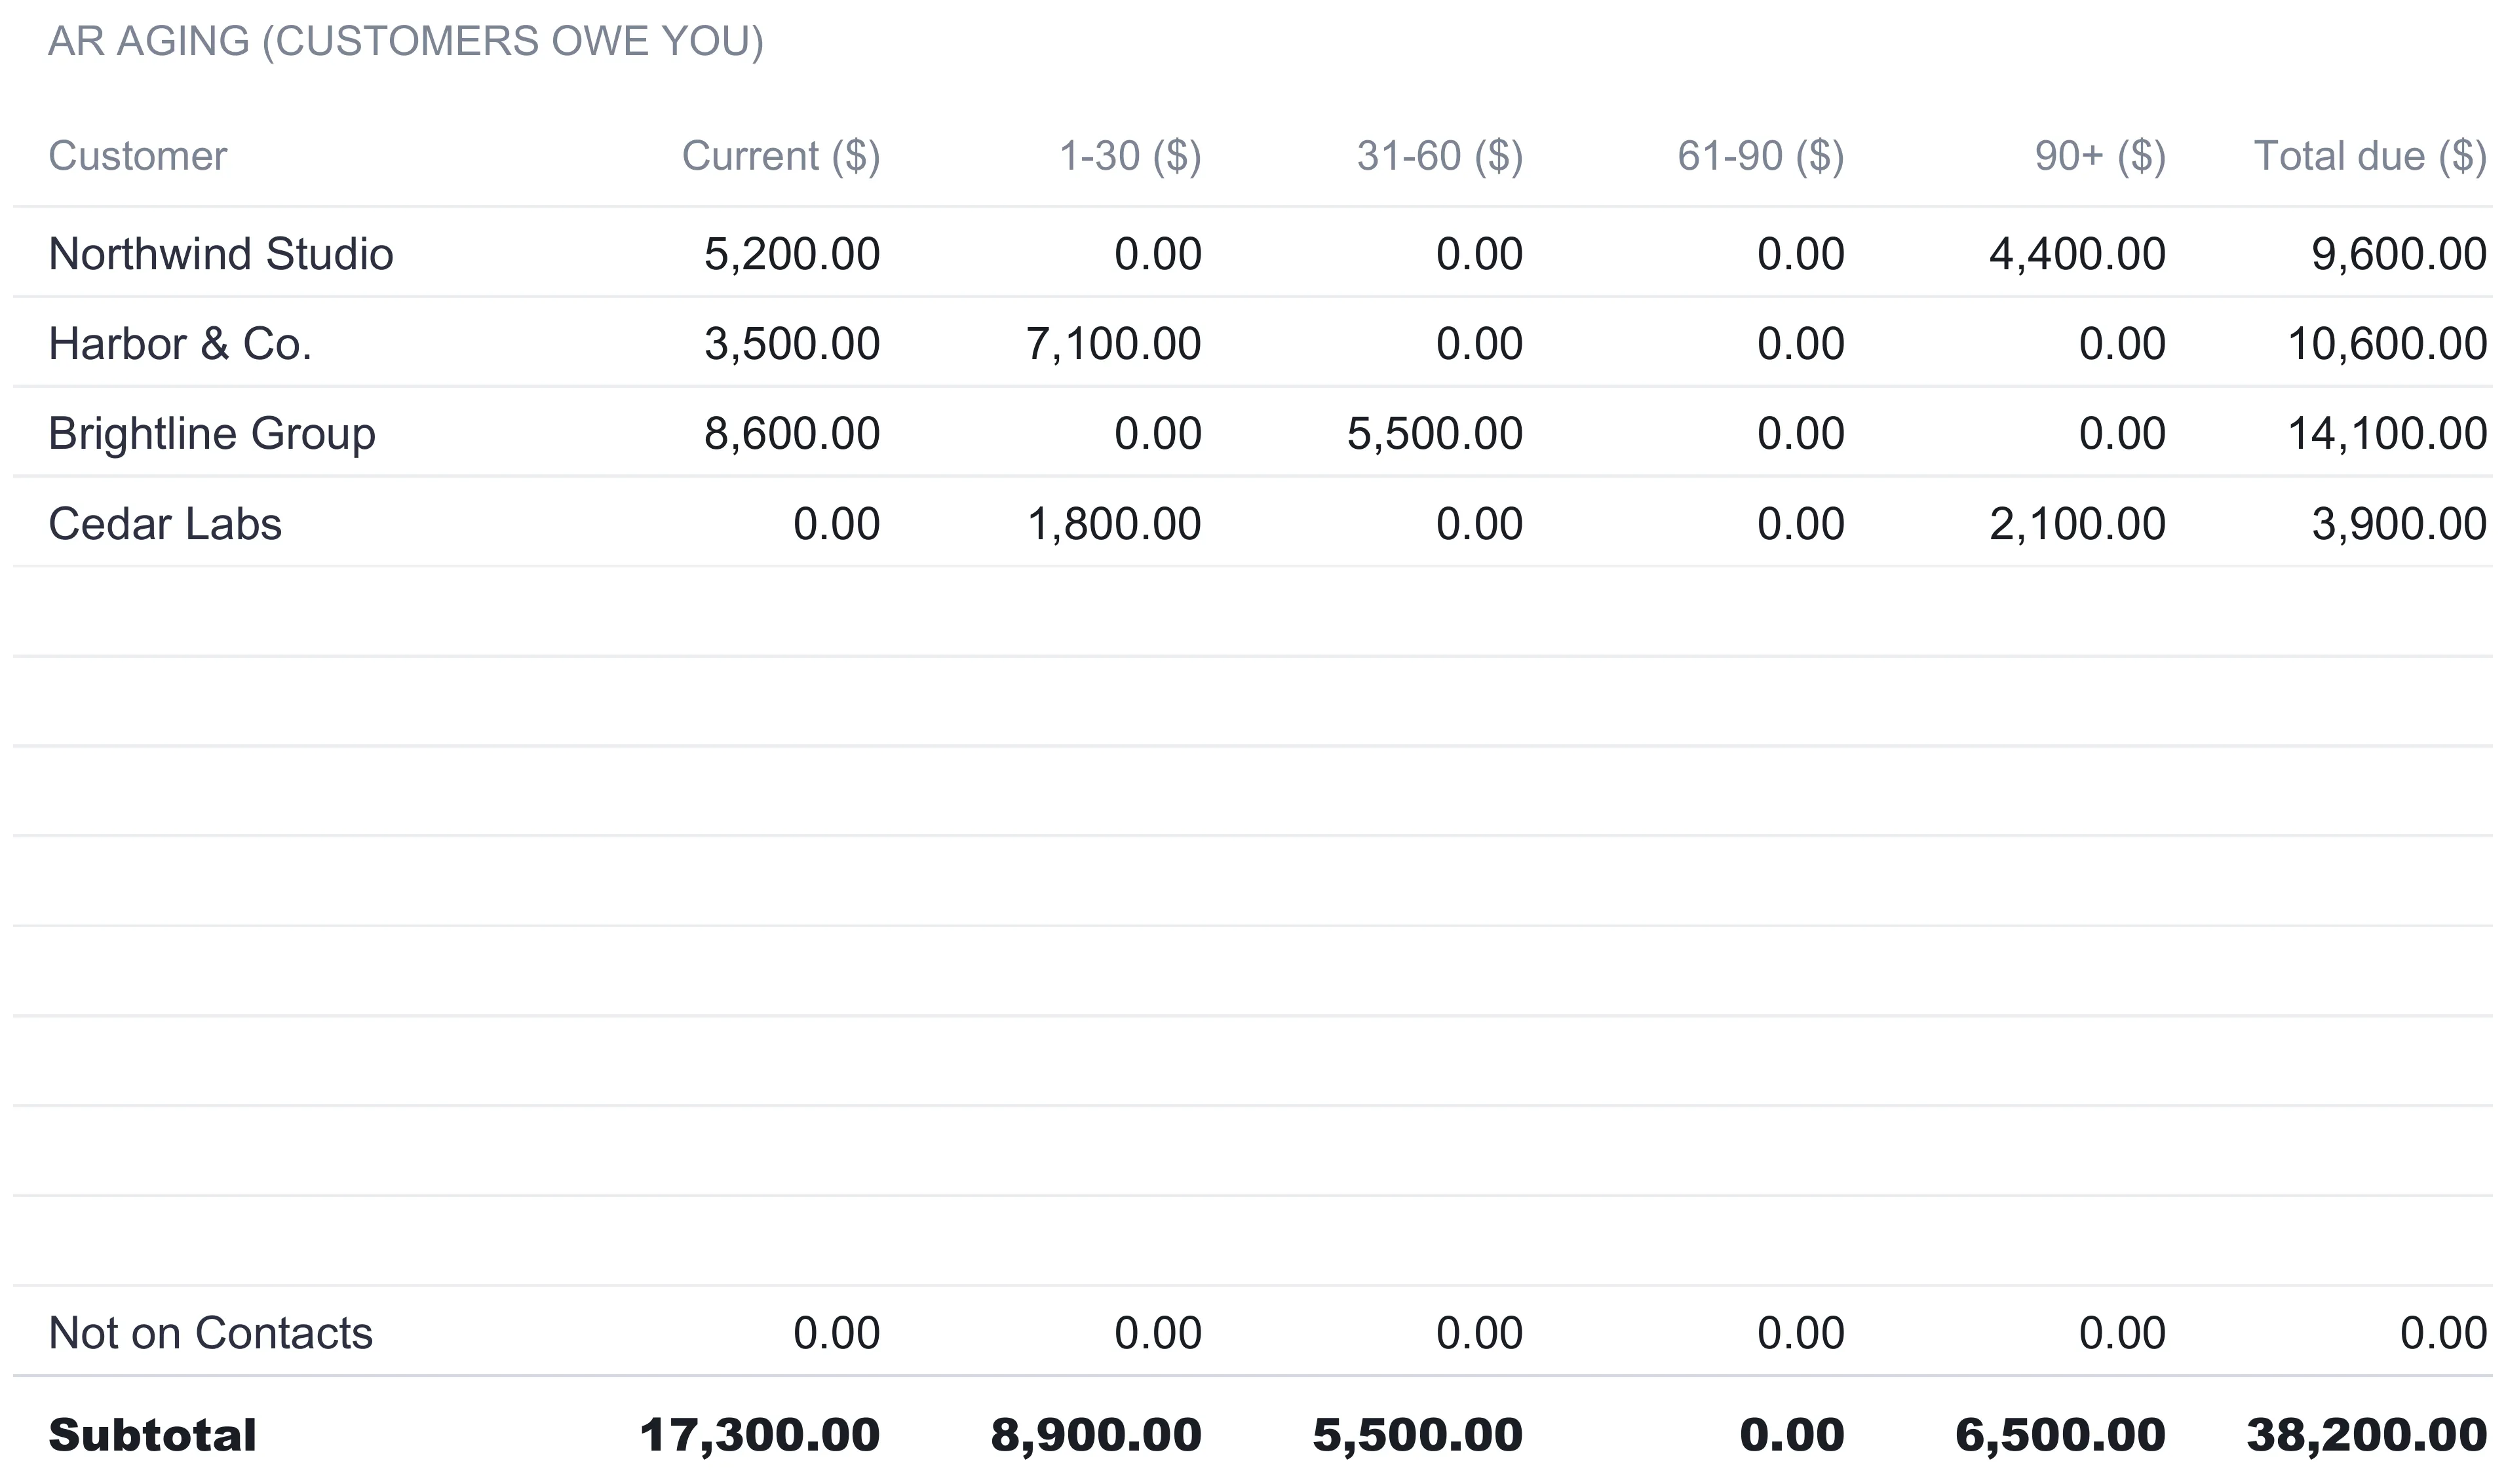
The receivable side makes the value obvious. Brightline Group’s 14,100 total splits into 8,600 current and 5,500 in the 31-60 band, so most of what Brightline owes is not yet due. Northwind Studio’s 9,600 is more divided: 5,200 current sits alongside 4,400 that has aged past 90 days. Two customers with similar totals are in sharply different positions, and only the aging split shows it. Down the bottom, the AR subtotal reads 17,300 current, 8,900 in 1-30, 5,500 in 31-60, nothing in 61-90, and 6,500 in the 90+ column, adding to the same 38,200 the ledger reported. The overdue buckets sum to 20,900, which is exactly the overdue figure the dashboard carries.
The AP aging table, below the AR one and out of frame in the image above, is far more compact. All 4,070 of it is spread across just current and 1-30: 1,200 current and 2,870 in the 1-30 band, matching the payable ledger’s 2,870 overdue. Each subtotal row equals its ledger total because of the Not on Contacts catch-all described earlier, so the aging sheet can never quietly lose a balance that the ledger counted.
The dashboard: AR, AP, and the net position
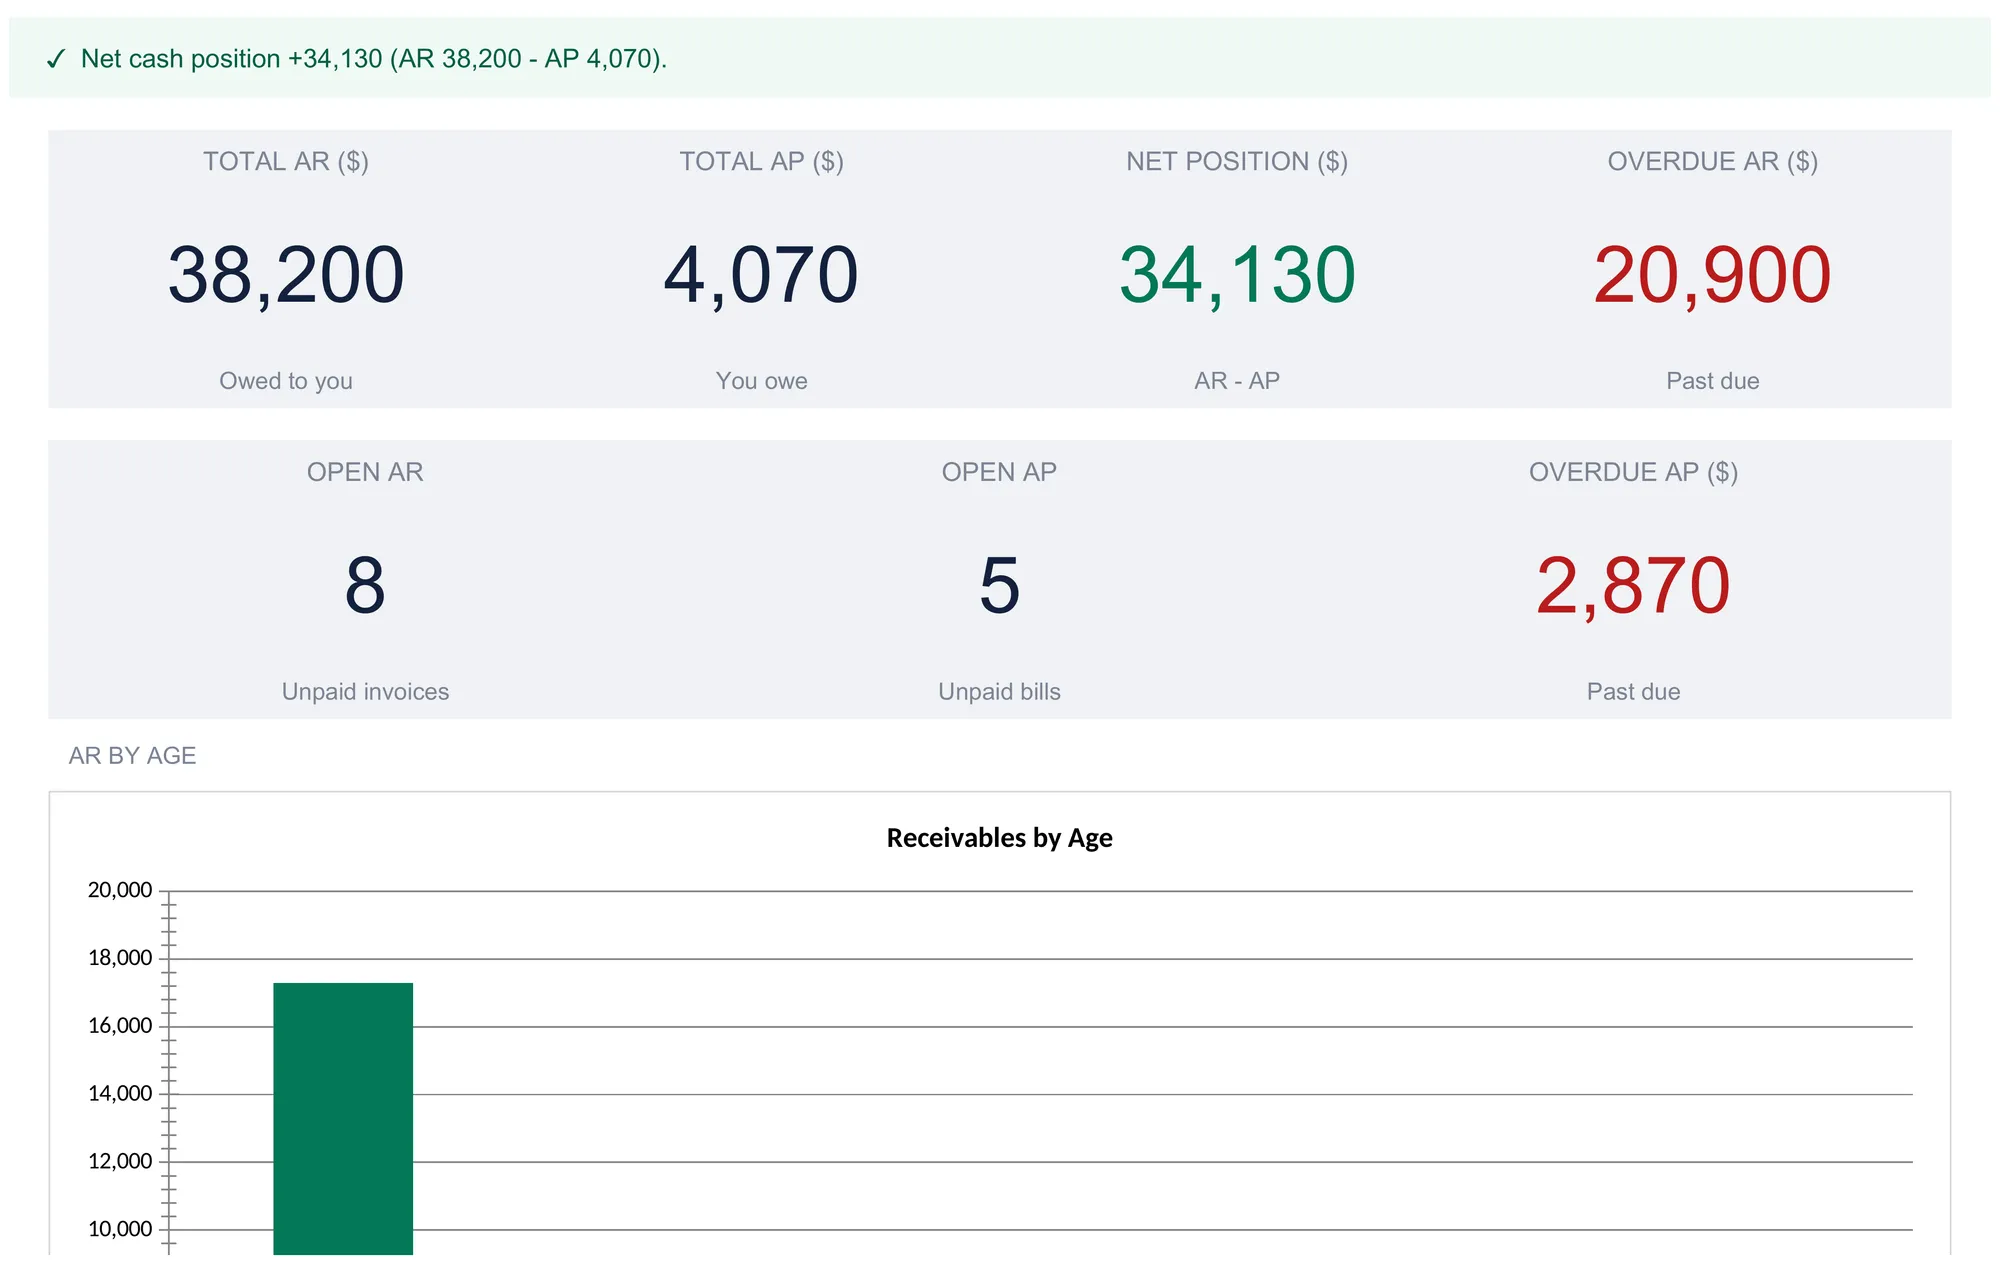
With the two ledgers filled, the Dashboard computes the whole picture on one screen. Seven tiles carry the headline figures.
| Tile | Sample value | What it means |
|---|---|---|
| Total AR | 38,200 | Everything customers still owe you |
| Total AP | 4,070 | Everything you still owe vendors |
| Net position | 34,130 | Total AR minus total AP |
| Overdue AR | 20,900 | Receivable balances past their due date |
| Overdue AP | 2,870 | Payable balances past their due date |
| Open AR | 8 | Count of invoices carrying a balance |
| Open AP | 5 | Count of bills carrying a balance |
The number no single ledger shows is the net position, and it is the reason to keep both sides in one file. It subtracts what you owe from what you are owed: 38,200 receivable minus 4,070 payable leaves 34,130. A status line above the tiles states it in words. While receivables lead it carries a tick and reads “Net cash position +34,130 (AR 38,200 - AP 4,070)” on a green background, and it flips to an amber warning if payables ever exceed receivables. The net position tile itself is set in green and the two overdue tiles in red.
Net position is a snapshot of obligations, not a bank balance. It says the business is owed far more than it owes, the opposite of owing more than you are owed, but it does not promise when the 38,200 arrives. That is exactly why the overdue and aging figures sit next to it. The net position tells you the direction; the two overdue totals, 20,900 on the receivable side against 2,870 on the payable side, tell you how much of each is already late.
The two count tiles, open AR of 8 and open AP of 5, add a different kind of context. They are the number of invoices and bills still carrying a balance, regardless of size, so a single large open invoice and a stack of small ones read differently once you set the count against the total. Eight open invoices holding 38,200 averages out near 4,800 each; five open bills holding 4,070 averages near 800. The counts are a quick sanity check that the totals are not being driven by one outlier.
Below the tiles, two bar charts plot AR by age and AP by age, turning the aging subtotals into a shape you can read at a glance. The receivables chart leads with a tall current bar of 17,300 and then shorter overdue bars, including a second peak of 6,500 out at the 90-plus band, while the payables chart is short and clustered in the current and 1-30 columns. Reading the two charts together is the fastest way to take in the whole workbook: one glance says the business is owed a lot and owes a little, and that most of what it owes is only just past due.
Receivable, payable, and net position in plain terms
Three ideas carry the accounting vocabulary, and each one is simpler than its name.
A receivable is money owed to you. You did the work, you sent the invoice, and until it is paid the amount is a receivable, an asset that has not yet turned into cash. The sample carries 38,200 of it.
A payable is money you owe. A vendor did the work or shipped the goods, the bill arrived, and until you pay it the amount is a payable, an obligation that has not yet left the account. The sample carries 4,070.
The net position is the first minus the second. It answers the two-sided question the ledgers were built for: across everything invoiced and everything billed, does the business come out ahead? Here it does, by 34,130. A positive net position means receivables outweigh payables; a negative one means the reverse. It is a measure of what is outstanding on both sides, which is a different thing from cash on hand, because a receivable only helps once it is collected.
The aging buckets turn each of those totals from a lump into a timeline. Current means not yet due. The 1-30, 31-60, 61-90, and 90+ columns count days past the due date, and the last one collects anything more than 90 days late. A balance drifting rightward across those buckets has been outstanding longer, which is visible on the sheet the moment it happens rather than at the end of a quarter.
Where the data fits at tax time
Tracking receivables and payables is not only a cash-flow habit; it maps directly onto how a business reports its numbers. Under the accrual method of accounting, income is recorded when it is earned rather than when the cash arrives, and expenses are recorded when they are incurred rather than when they are paid. Receivables and payables are exactly those in-between amounts: revenue earned but not yet collected, and costs incurred but not yet paid. IRS Publication 538, Accounting Periods and Methods, lays out the accrual method and how it differs from the cash method, in which those same amounts would not register until money moved.
Whichever method a business uses, the underlying records have to exist. The IRS guidance on what kind of records to keep covers gross receipts, purchases, and expenses, and notes that supporting documents should identify the payee, the amount, and the date. A ledger that already holds every invoice and every bill with its dates and amounts is most of that record built as you go, rather than reconstructed at year-end.
The receivable and payable balances also feed the two most familiar lines on a balance sheet. Accounts receivable is a current asset, and accounts payable is a current liability, so the 38,200 and 4,070 in this workbook are the raw figures those lines summarize. Keeping them in a live ledger, aged and dated, means the number that lands on a balance sheet or in a bookkeeper’s hands is a total you can trace back to individual invoices and bills rather than a round figure typed from memory. A tax professional or bookkeeper can confirm which accounting method fits a specific business and how these balances flow into its statements.
Excel or Google Sheets for an AR/AP tracker
The tracker is an .xlsx file built on plain formulas, with no macros and no add-ons, so it runs identically in Microsoft Excel and in Google Sheets after upload. The status logic, the aging buckets, and the net-position calculation are all standard spreadsheet functions that behave the same in either program. Google Sheets suits a business whose owner wants to log a payment from a phone between meetings and share the file with a bookkeeper; Excel suits those who prefer a local file on one machine. The structure described here is equally buildable in either, and moving the file between them changes nothing about how it computes.
Which template fits which job
- AR / AP Tracker Spreadsheet Template ($29) is the workbook this walkthrough follows: two ledgers, a shared contact list, aging on both the receivable and payable sides, and a dashboard that nets them into a single cash position. It fits a business that wants to see what it is owed and what it owes in one place.
- Invoice Generator & Tracker Spreadsheet Template ($19) works the receivable side on its own and adds a fillable, printable invoice. A business that needs to create the invoices as well as track them, and does not need the payable side, may find it the closer fit. The full invoice-tracking walkthrough covers that workbook in the same detail as this one. Some businesses run both: the invoice template to bill customers, and the AR/AP tracker for the two-sided view of receivables against payables.
Related
- How to Create and Track Invoices in a Spreadsheet - the receivables-only companion, with a printable invoice and an accounts-receivable aging report
Frequently asked questions
What is the difference between accounts receivable and accounts payable?
Accounts receivable is money customers owe you for work already invoiced, and accounts payable is money you owe vendors for bills already received. Receivable is an asset waiting to arrive, payable is an obligation waiting to leave. The tracker keeps a separate ledger for each and then subtracts one total from the other to show the net position, which in the worked example is 38,200 receivable minus 4,070 payable, or 34,130 net in your favor.
How does the spreadsheet decide something is overdue?
Status is a formula, not something you type, and it is worked out in a fixed order on both ledgers. A row with no amount reads nothing, one with no balance left reads Paid, one that still has a balance and whose due date has passed the Settings As-of date reads Overdue, a part-paid row that is not yet due reads Partial, and anything else open reads Open. Because it measures against the As-of date rather than today, a part-paid invoice that is already past due still reads Overdue, and that balance is what the overdue totals count.
What is an accounts receivable aging report, and does the payable side get one too?
An aging report sorts each unpaid balance by how long it has been past its due date, into buckets of current, 1-30 days, 31-60, 61-90, and 90+, that last one holding anything more than 90 days past due. This tracker builds one for receivables by customer and a second for payables by vendor, so both sides of the ledger age the same way. In the sample, 38,200 of receivables splits into 17,300 current and 20,900 spread across the overdue buckets, while the 4,070 of payables sits almost entirely in the 1-30 band.
How many customers and vendors can the tracker hold?
The Contacts sheet holds up to 12 customers and 12 vendors, each with a contact name, email, and a payment terms figure in days. Both ledgers offer those names as a dropdown so entries stay consistent. Each ledger runs 30 rows, and a name typed on a ledger that is not on the Contacts list still counts in every total but is reported in the aging sheet's Not on Contacts row rather than getting its own line.
How is this different from an invoice tracker?
An invoice tracker follows one side of the ledger, the receivables, and often produces the printable invoice as well. This tracker follows both sides at once: what customers owe you and what you owe suppliers, aged separately, with the net cash position between them on the dashboard. The receivables ledger here logs invoices you have already sent rather than creating them, so a business that needs to generate invoices too can pair it with the invoice template and use this workbook for the two-sided cash picture.
Sources
- Publication 538, Accounting Periods and Methods - Internal Revenue Service
- What kind of records should I keep - Internal Revenue Service
About this article
Every figure, sheet name, column, formula, and feature description checked on 2026-09-10 against the shipped AR / AP Tracker workbook (Dashboard, Receivables, Payables, Aging, Contacts, Settings, How to Use), including the aging bucket formulas and the Settings currency list. IRS Publication 538 and the recordkeeping guidance checked against the live IRS pages at writing time. Last reviewed September 2026.