A debt payoff calculator spreadsheet takes one list of debts and one extra payment, then runs three orderings against it: snowball, avalanche, and a custom credit-cards-first order, plus a minimum-only baseline. This walkthrough follows our Debt Payoff Calculator Ultimate ($29) using its own sample data, six debts totaling $43,900 that all clear in 43 months on the same $1,205 monthly outlay, where the ordering leaves $6,987 of interest under avalanche against $7,299 under snowball. Built on plain formulas for Excel and Google Sheets.
Anyone with a spare $300 a month and a stack of statements faces the same fork before they pay a cent extra. Send it to the smallest balance and clear a whole account quickly? Send it to the card charging the most interest and shrink the biggest cost first? Deal with the plastic before anything else? Each of those is a real ordering, each retires the same debts on the same budget, and each leaves a different interest bill and a different date on every account. The catch is that none of those differences is visible from the statements themselves. Seeing them means running the same debts through each ordering and reading the results next to one another, which is a comparison a spreadsheet is well suited to.
The examples below come from our Debt Payoff Calculator Ultimate Spreadsheet Template ($29), which takes one list of debts and one extra payment and computes, from them, three payoff orderings against a minimum-only baseline: snowball, avalanche, and a custom credit-cards-first order. The structure is reproducible by hand if you would rather build your own.
What a debt payoff calculator spreadsheet has to hold
Strip the comparison down and there are only a few moving parts:
- The debts. For each one: a name, a type, the current balance, the APR, and the minimum payment. This is everything you type.
- One extra payment. A single monthly amount, above all the minimums, that funds whichever ordering is on screen.
- The orderings. Three ways of deciding which debt the extra hits first, each played out month by month on the same debts.
- The read-outs. Months to debt-free, total interest, total amount paid, per-debt payoff dates, milestones, and the saving against paying only minimums. These are all calculated, never typed.
The template gives each of these its own sheet. Debt Setup holds the inputs, the Strategy Comparison sheet is the heart of the file, the Payoff Schedule is the month-by-month engine behind the snowball ordering, and Payoff Milestones and What-If Analysis are two more ways of reading the result, with a Dashboard on top and a How to Use sheet carrying the instructions. The walkthrough below runs from the inputs out to the dashboard.
Start with the inputs: the Debt Setup sheet
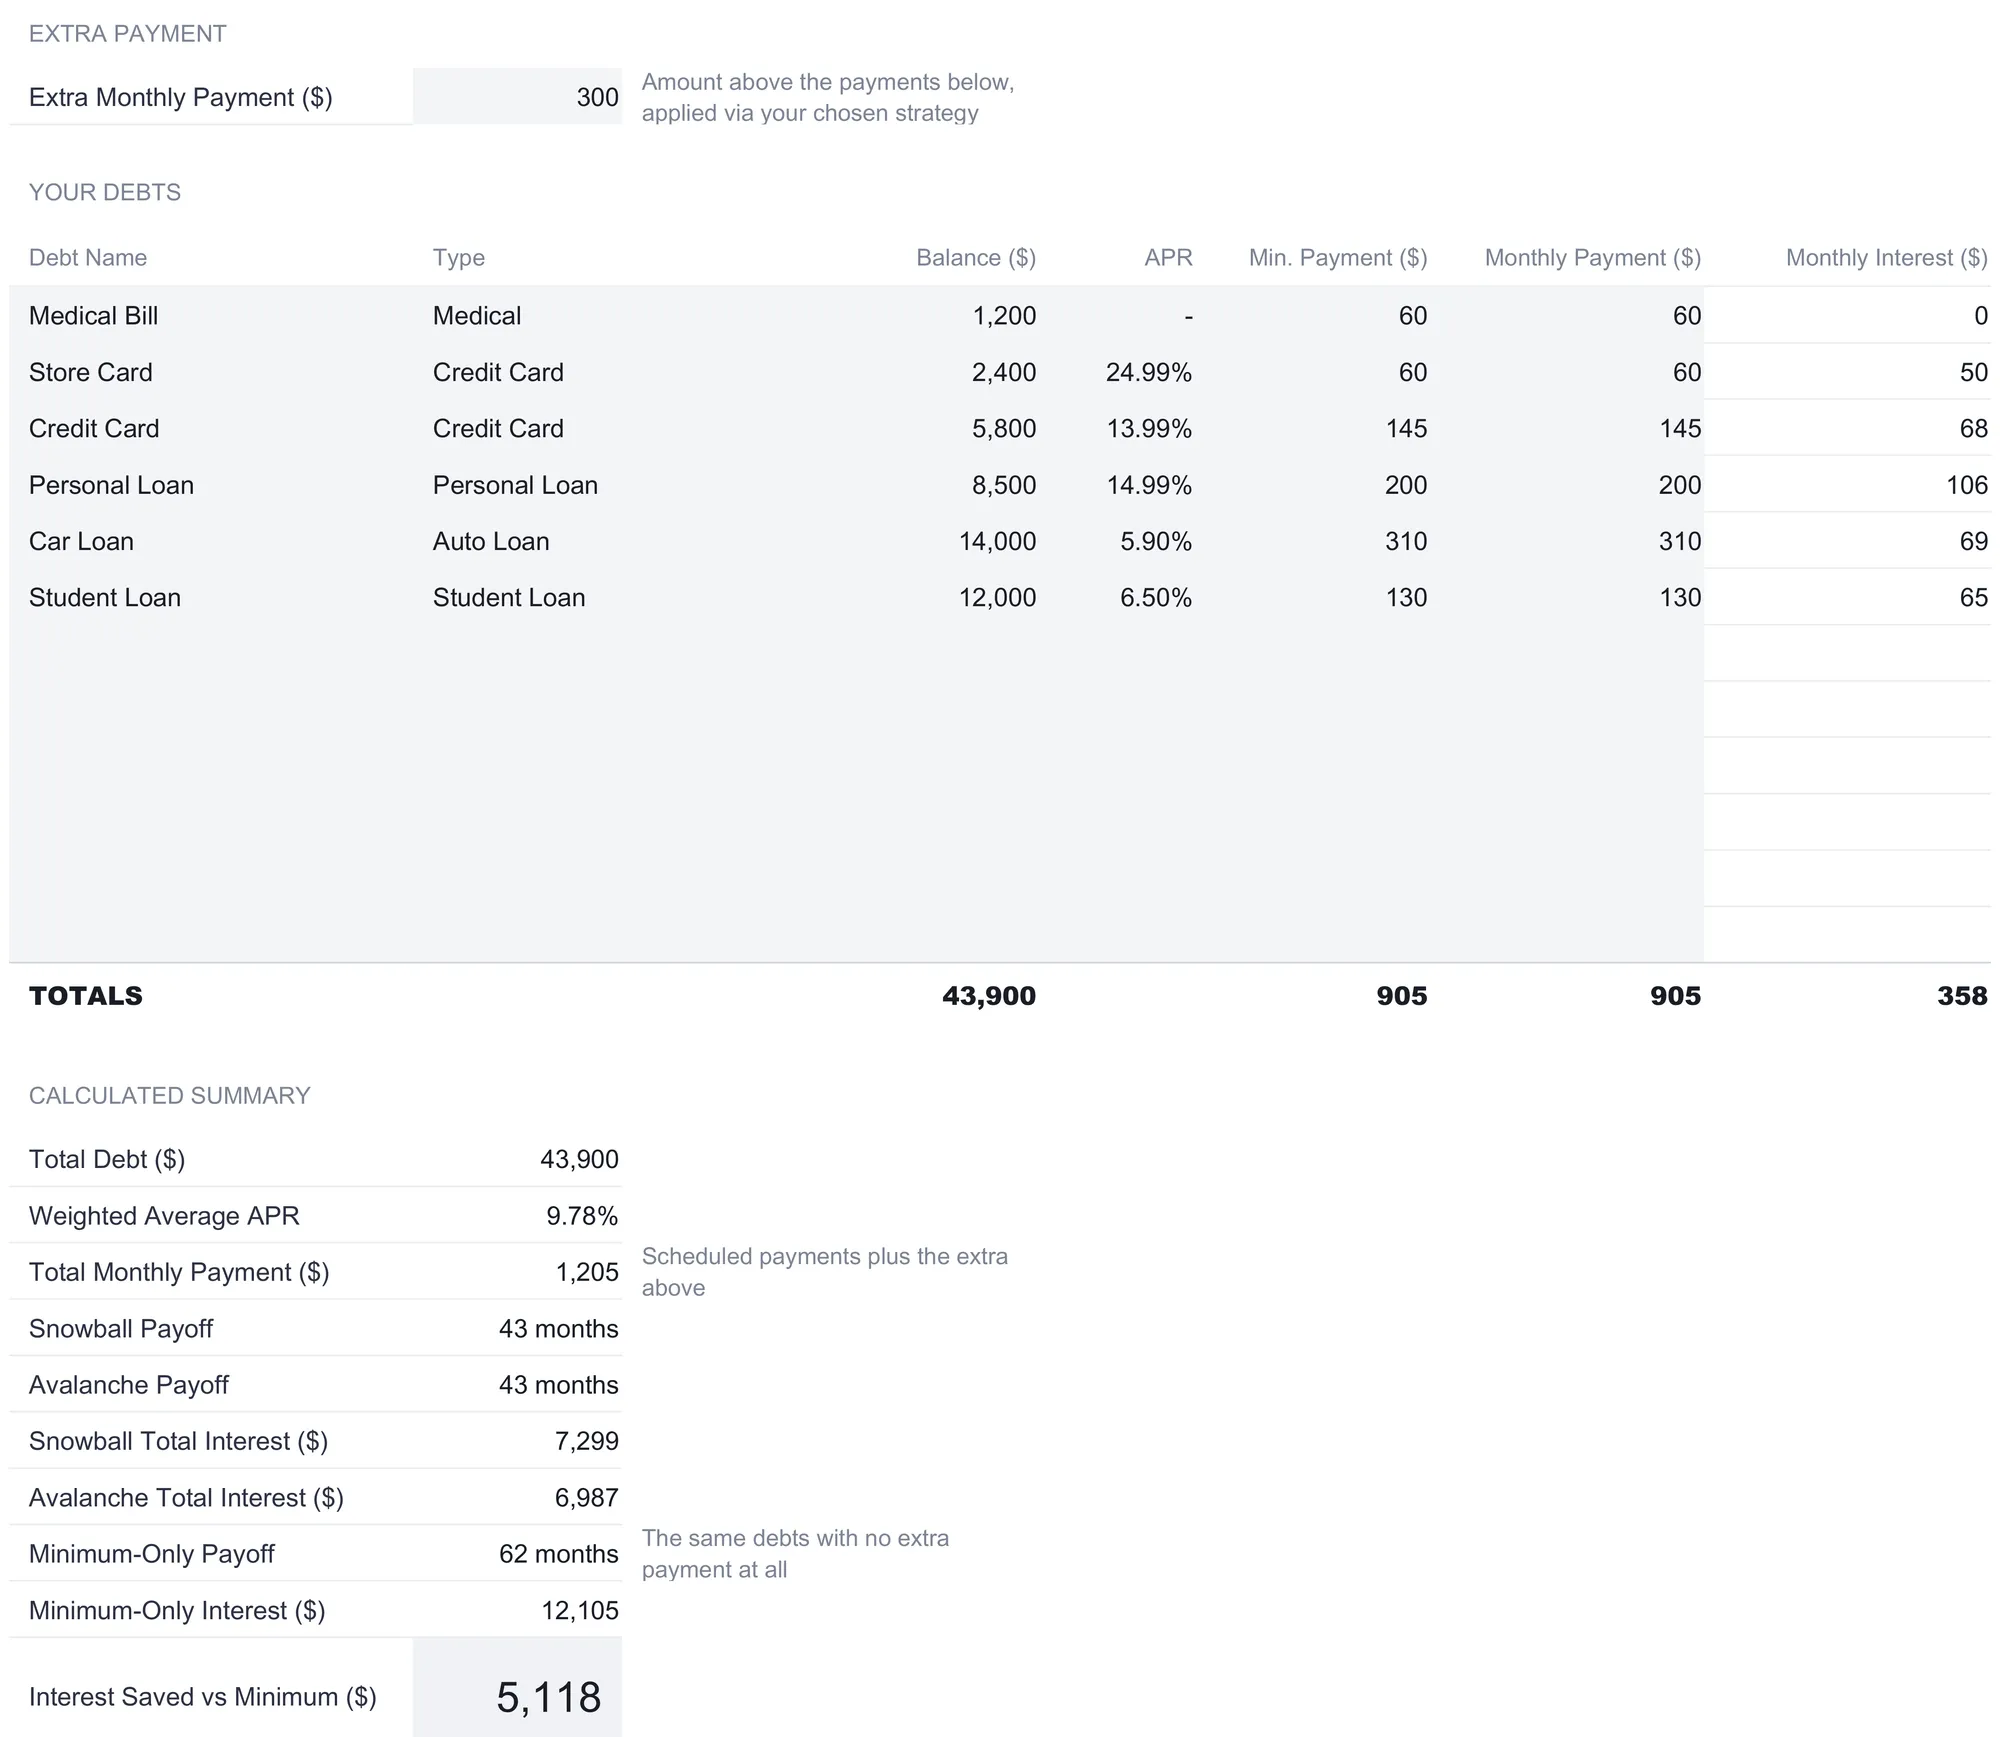
Everything begins on Debt Setup, and it asks for little. Up to 12 debts are supported, one per row, and each row takes a free-text name, a type chosen from a dropdown (Credit Card, Personal Loan, Student Loan, Auto Loan, Medical, or Other), the balance, the APR, and the minimum payment the lender requires. An optional monthly payment column lets you plan to pay more than the minimum on a given debt, and the schedules use the larger of that figure and the minimum. The sample fills six rows:
| Debt | Type | Balance ($) | APR | Min. payment ($) |
|---|---|---|---|---|
| Medical Bill | Medical | 1,200 | 0% | 60 |
| Store Card | Credit Card | 2,400 | 24.99% | 60 |
| Credit Card | Credit Card | 5,800 | 13.99% | 145 |
| Personal Loan | Personal Loan | 8,500 | 14.99% | 200 |
| Car Loan | Auto Loan | 14,000 | 5.90% | 310 |
| Student Loan | Student Loan | 12,000 | 6.50% | 130 |
| Totals | 43,900 | 905 |
A Monthly Interest column fills itself for each row, turning the balance and APR into a dollar figure, so the $2,400 store card at 24.99 percent shows about $50 of interest a month while the interest-free medical bill shows $0. The APR field takes the annual rate as the lender quotes it, and an interest-free balance such as the medical bill or a promotional zero-percent period is entered as 0, which is why the medical bill accrues nothing across the plan. The type matters for one ordering only, the custom one, which reads it to decide which debts count as credit cards.
Above the debt list sits the single input that funds every ordering: the Extra Monthly Payment, set to $300 in the sample and described on the sheet as the amount above the payments below, applied via your chosen strategy. That one cell is the engine’s fuel. Set it to zero and every ordering collapses into the minimum-only baseline; raise it and every payoff date moves in.
Underneath, a Calculated Summary block turns the inputs into headline numbers before you have opened any other sheet:
| Summary figure | Sample value |
|---|---|
| Total Debt | $43,900 |
| Weighted Average APR | 9.78% |
| Total Monthly Payment | $1,205 |
| Snowball Payoff | 43 months |
| Avalanche Payoff | 43 months |
| Snowball Total Interest | $7,299 |
| Avalanche Total Interest | $6,987 |
| Minimum-Only Payoff | 62 months |
| Minimum-Only Interest | $12,105 |
| Interest Saved vs Minimum | $5,118 |
The weighted average APR is balance-weighted, so the large low-rate car loan and student loan pull the blended figure down to 9.78 percent even though two of the debts sit near 14 and 25 percent. The total monthly payment is the $905 of scheduled payments, which matches the minimums here because no row plans to pay more, plus the $300 extra, which is $1,205, the amount leaving the account every month until the last debt clears. The rest of the block previews the comparison the next sheet builds in full: two of the orderings already have their payoff time and interest here, and the interest-saved figure of $5,118 is measured against the minimum-only run.
The heart of the file: the Strategy Comparison sheet
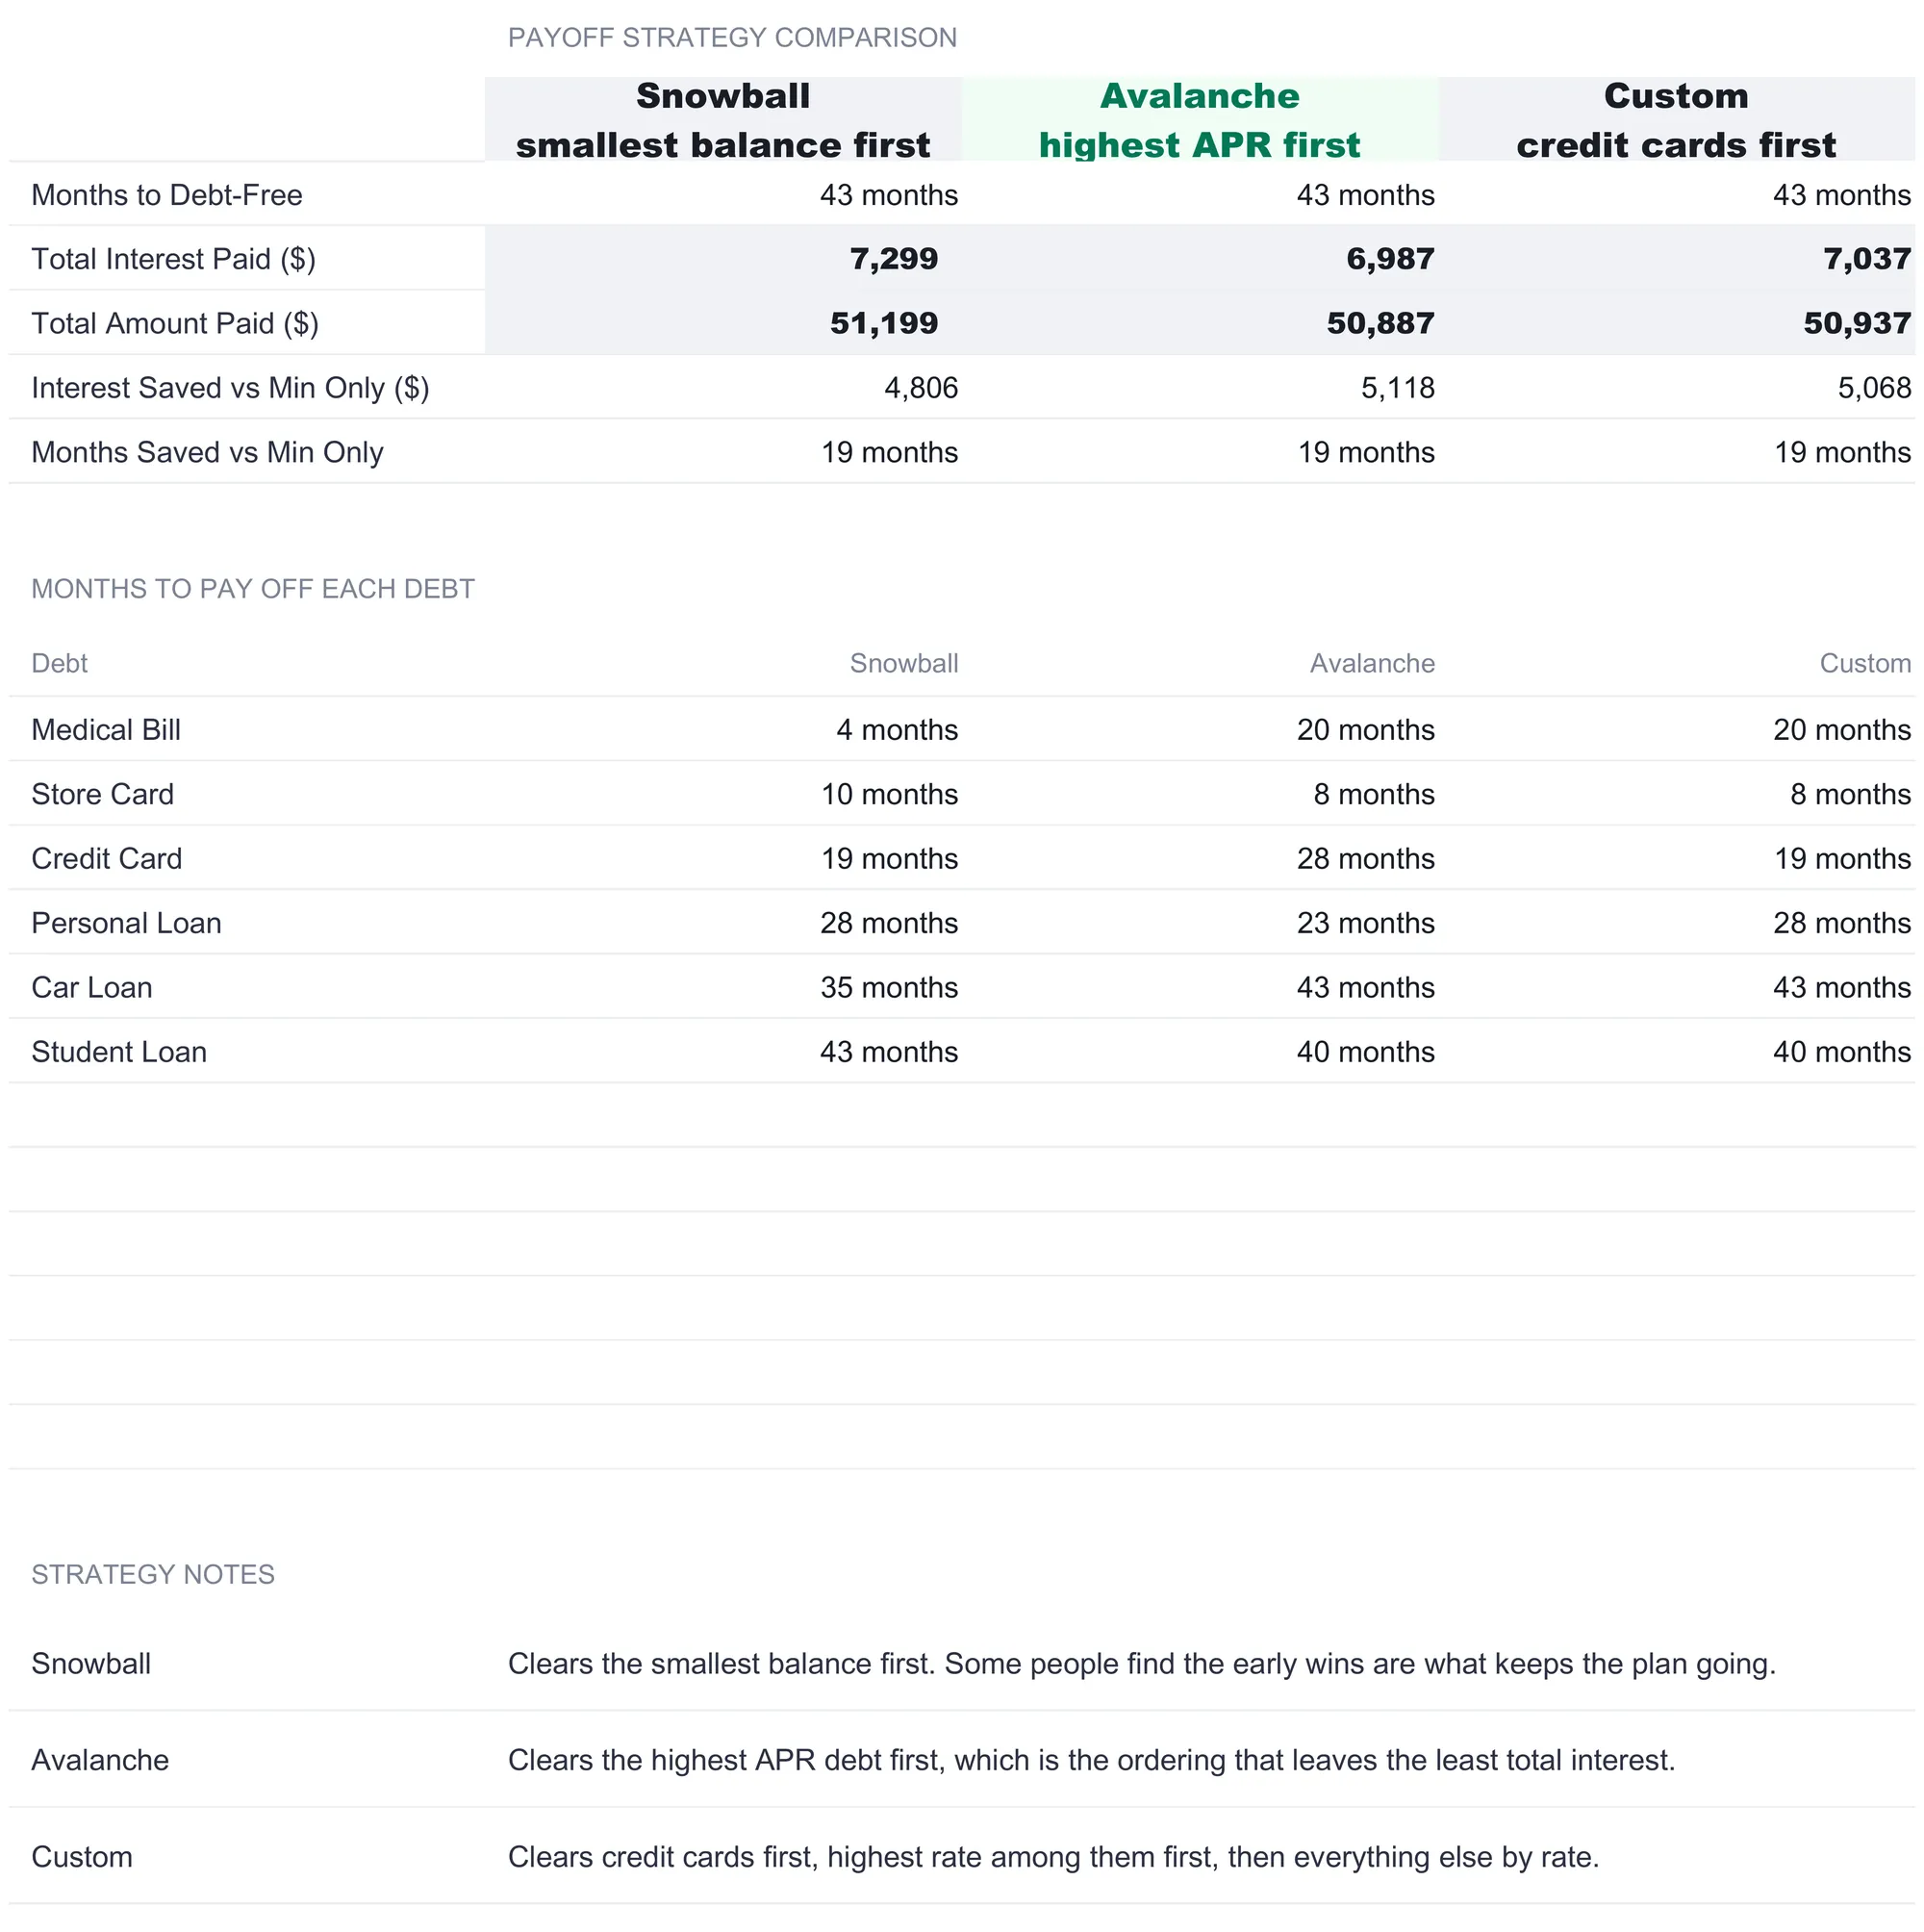
This is the sheet that sets the calculator apart from a single-method payoff file. It re-runs the same six debts and the same $300 extra under three different orderings and stacks the results in one table, then adds the minimum-only run as the baseline behind all three. The three orderings are:
- Snowball, which clears the smallest balance first.
- Avalanche, which clears the highest-APR debt first.
- Custom, which clears credit cards first, the highest rate among them first, and then everything else by rate.
All three spend exactly the same $1,205 a month. Every debt still receives its scheduled payment, and the extra goes to whichever debt sits at the front of that particular ordering; when a debt reaches zero, its payment joins the extra and rolls to the next debt in line. The only thing that changes between the three columns is the order in which debts reach the front.
Here is what that produces on the sample debts:
| Measure | Snowball | Avalanche | Custom |
|---|---|---|---|
| Months to debt-free | 43 | 43 | 43 |
| Total interest paid ($) | 7,299 | 6,987 | 7,037 |
| Total amount paid ($) | 51,199 | 50,887 | 50,937 |
| Interest saved vs min only ($) | 4,806 | 5,118 | 5,068 |
| Months saved vs min only | 19 | 19 | 19 |
Two things stand out. First, all three finish in the same 43 months. That is not a coincidence so much as arithmetic: the same $1,205 leaves the account every month under each ordering, so the total balance is retired at nearly the same pace regardless of which debt is at the front. On this particular set of debts the three timelines land on the same month. Second, and this is the part the comparison exists to show, the total interest is not the same. Avalanche leaves $6,987, snowball leaves $7,299, and the custom order sits between them at $7,037. The gap between the cheapest and the most expensive ordering here is about $312, bought or lost purely on the sequence, with no change to the budget and no change to the finish date.
The reason is that a dollar of extra payment does more against a high-rate balance than a low-rate one. Avalanche points the extra at the 24.99 percent store card and the 14.99 percent personal loan before the 5.9 percent car loan, so less high-rate balance survives to accrue, and the total interest comes in lowest. Snowball points it at the smallest balances first regardless of rate, so the two near-25-and-15-percent balances wait a little longer and cost a little more. Both clear everything in the same window; they differ only in what the lenders collect along the way.
Below the summary, a second table shows the month each individual debt is cleared under each ordering, which is where the three approaches visibly diverge:
| Debt | Snowball | Avalanche | Custom |
|---|---|---|---|
| Medical Bill | month 4 | month 20 | month 20 |
| Store Card | month 10 | month 8 | month 8 |
| Credit Card | month 19 | month 28 | month 19 |
| Personal Loan | month 28 | month 23 | month 28 |
| Car Loan | month 35 | month 43 | month 43 |
| Student Loan | month 43 | month 40 | month 40 |
Read down the columns and the personalities come through. Snowball clears the tiny medical bill in month 4, the earliest win of any ordering, because the balance is small rather than because it is expensive. Avalanche makes that same interest-free medical bill wait until month 20, since with no interest it is the last thing worth the extra, and instead knocks out the 24.99 percent store card by month 8. The custom order tracks avalanche closely here because the sample’s highest-rate debts happen to be the cards, but it puts the second card, the 13.99 percent balance labeled Credit Card, ahead of the higher-rate personal loan, clearing it in month 19 rather than month 28. Same debts, same money, three different sequences of small victories.
A short Strategy Notes block on the sheet describes each ordering in one line, including that avalanche “clears the highest APR debt first, which is the ordering that leaves the least total interest.” That is a statement about the arithmetic, not a nudge. The Consumer Financial Protection Bureau lays out both the smallest-balance and highest-interest approaches and advises choosing the strategy that fits your situation, since the fastest early win and the lowest total cost do not always come from the same ordering. The sheet’s job is to put the three side by side so the trade is visible; which one to run is left to you.
The engine behind the snowball ordering: the Payoff Schedule
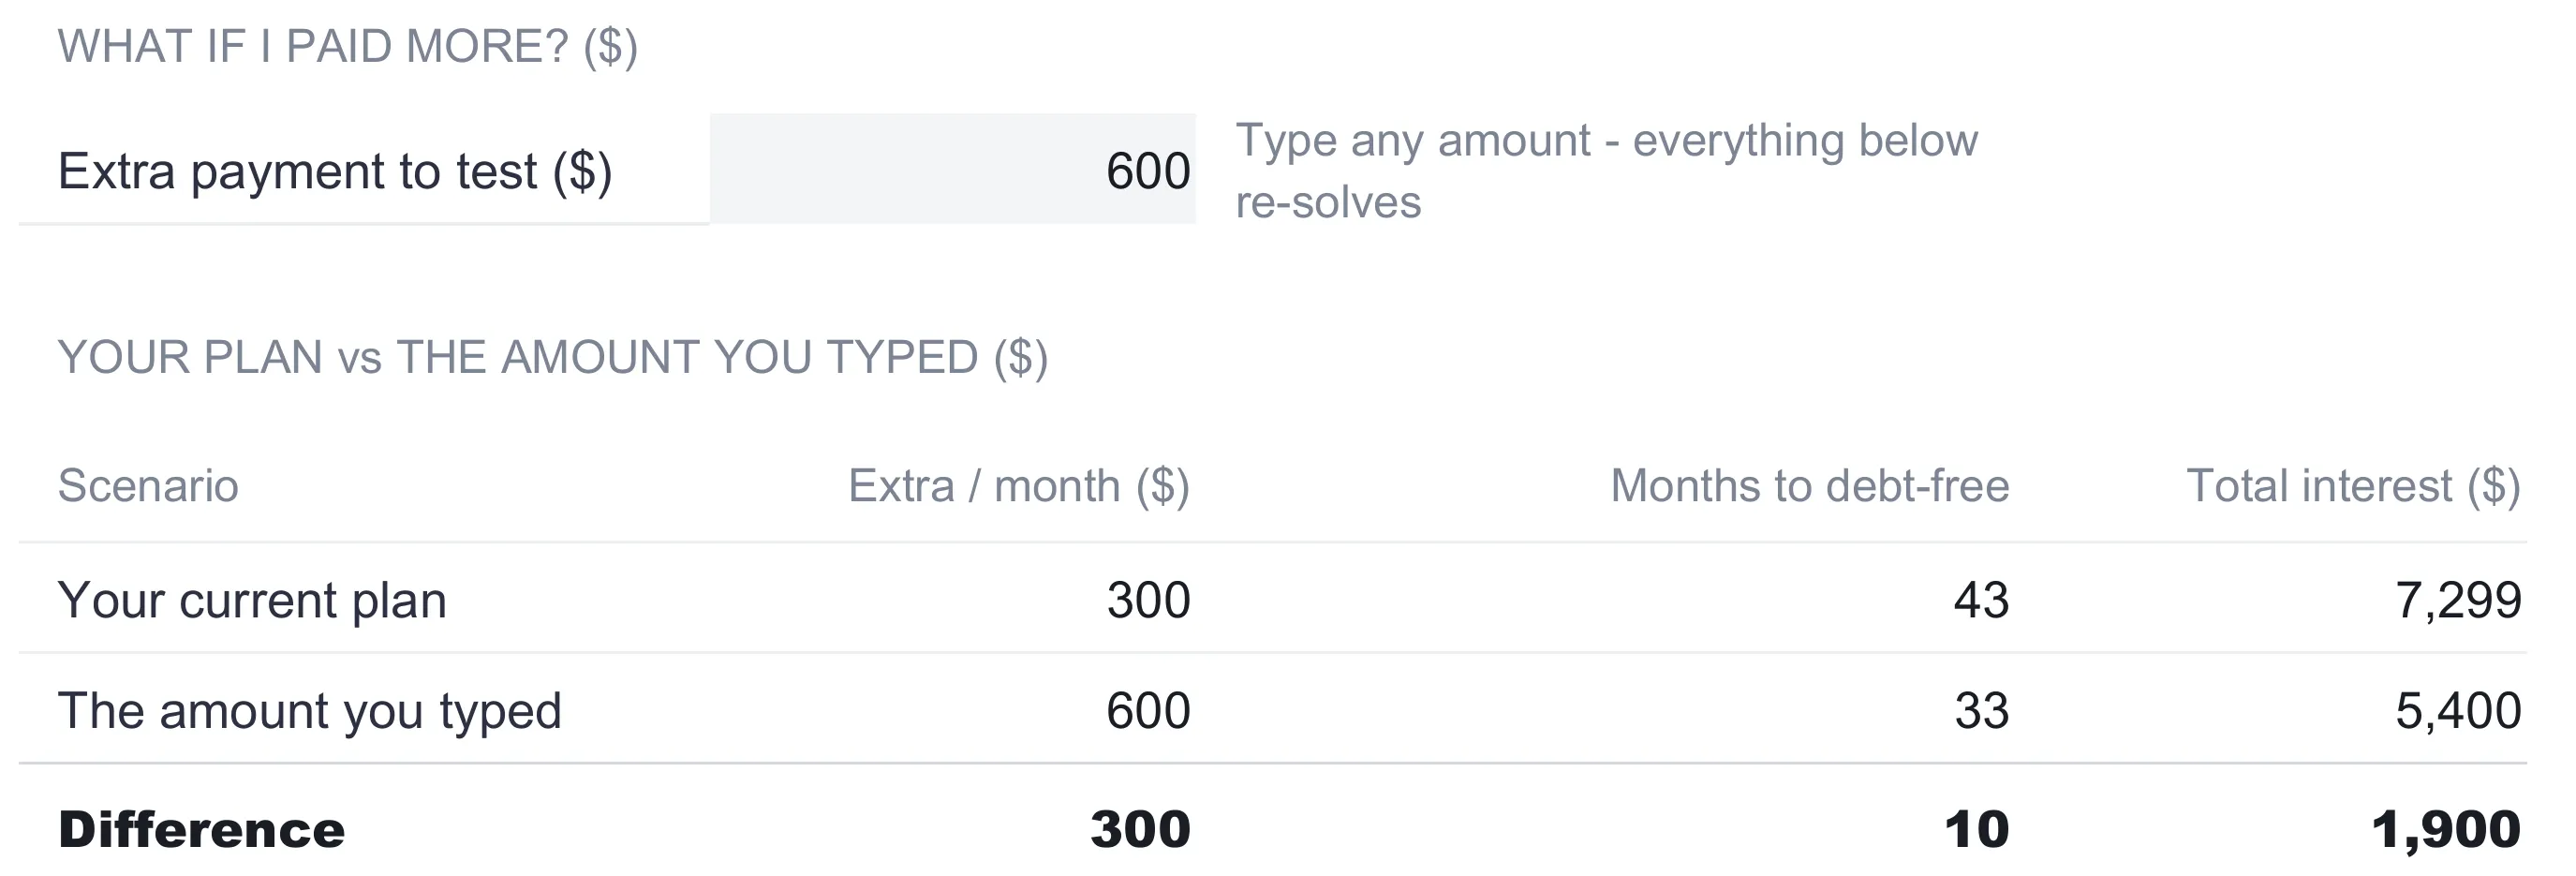
The Strategy Comparison summarizes; the Payoff Schedule shows the work. It runs a 180-month grid with a Payment and a Balance column for every debt, in the snowball ordering, so you can watch the trajectory of every line month by month. The columns take their names from the setup sheet, and the rows stop once nothing is owed, so the schedule is as long as the plan needs and no longer. In the sample, 43 rows carry numbers.
Tracing the sample makes the snowball concrete. The medical bill has a $60 minimum, but the $300 extra piles on top of it, so it is paid $360 a month and its balance runs $840, $480, $120, then zero, cleared in month 4. When it clears, its $60 minimum and the $300 extra move to the store card, which had been paying $60 on its own and now pays $420 from month 5; the store card is gone by month 10. The freed-up money keeps gathering. The credit card, which had been paying its $145 minimum, jumps to $565 from month 11 and clears in month 19, then the personal loan takes the growing pool and clears in month 28. By the final stretch the entire $1,205 is landing on one debt, which is how the last balance is retired in month 43.
One detail is worth noticing, because it is subtler than the “smallest balance first” label suggests. The schedule re-checks the remaining balances each month rather than locking the order in at the start. The car loan carries a $310 minimum against the student loan’s $130, so even while both are only being paid their minimums the car loan shrinks far faster, and by the time the personal loan clears the car loan’s remaining balance has dropped below the student loan’s. The extra therefore lands on the car loan next, clearing it in month 35, and the student loan, now the largest remaining balance, comes last in month 43. The ordering follows the balances as they actually stand, not only as they were typed.
Progress you can see: the Payoff Milestones sheet
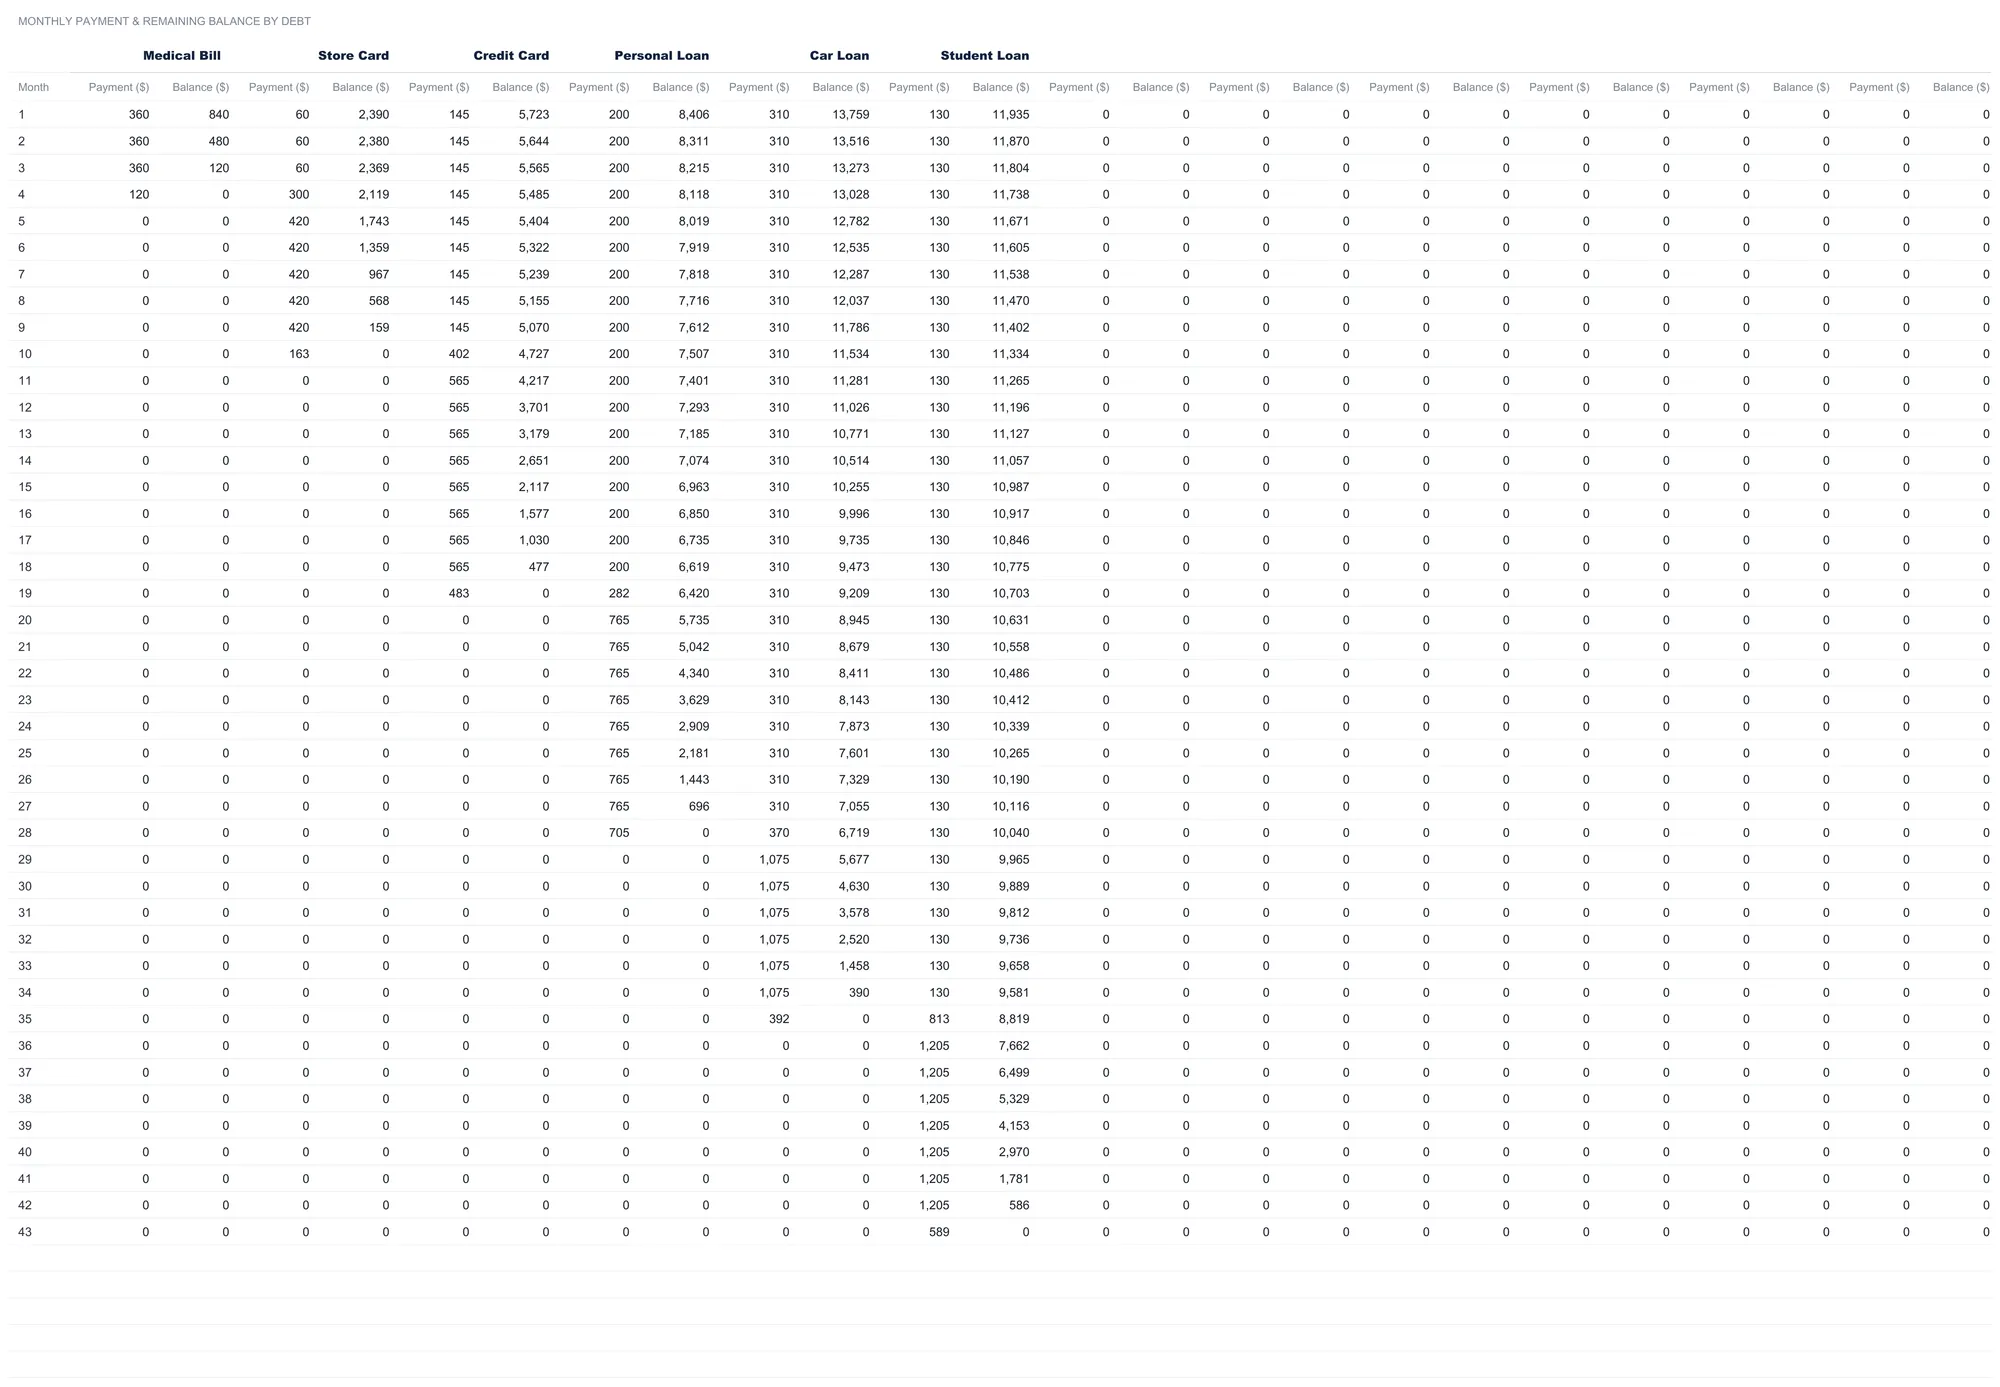
A 43-month plan is hard to feel from a schedule grid, so the Payoff Milestones sheet reduces it to five checkpoints and puts dates on them. The milestones are fixed markers rather than something you configure: the first debt cleared, then a quarter, half, three quarters, and all of the total balance paid, each measured under the snowball ordering.
| Milestone | Target ($) | Months away |
|---|---|---|
| First debt cleared | 1,200 | 2 |
| A quarter of the debt paid | 10,975 | 13 |
| Half of the debt paid | 21,950 | 24 |
| Three quarters of it paid | 32,925 | 34 |
| All of it cleared | 43,900 | 43 |
The targets are simple fractions of the $43,900 total, and the months-away column is read from the schedule, so each checkpoint lands where the plan actually reaches it. The projected-date column counts forward from the month you open the file, which is why those dates shift over time while the months-away figures hold steady; opened in the sample month, the markers run out to a final all-clear at month 43, roughly three and a half years out. A Current column, sitting at zero in the sample, is where you record how much you have paid off in total so far, and the Progress column then shows current divided by target, capped at full, and turns green once a marker is reached.
The uneven spacing is the honest part. The first checkpoint arrives about 2 months in, but the halfway mark does not come until month 24, because the early payments are small before the snowball has gathered its later size. The sheet also notes that another ordering reaches the same markers at slightly different times, and points back to Strategy Comparison for how much.
Test a bigger payment: the What-If Analysis sheet
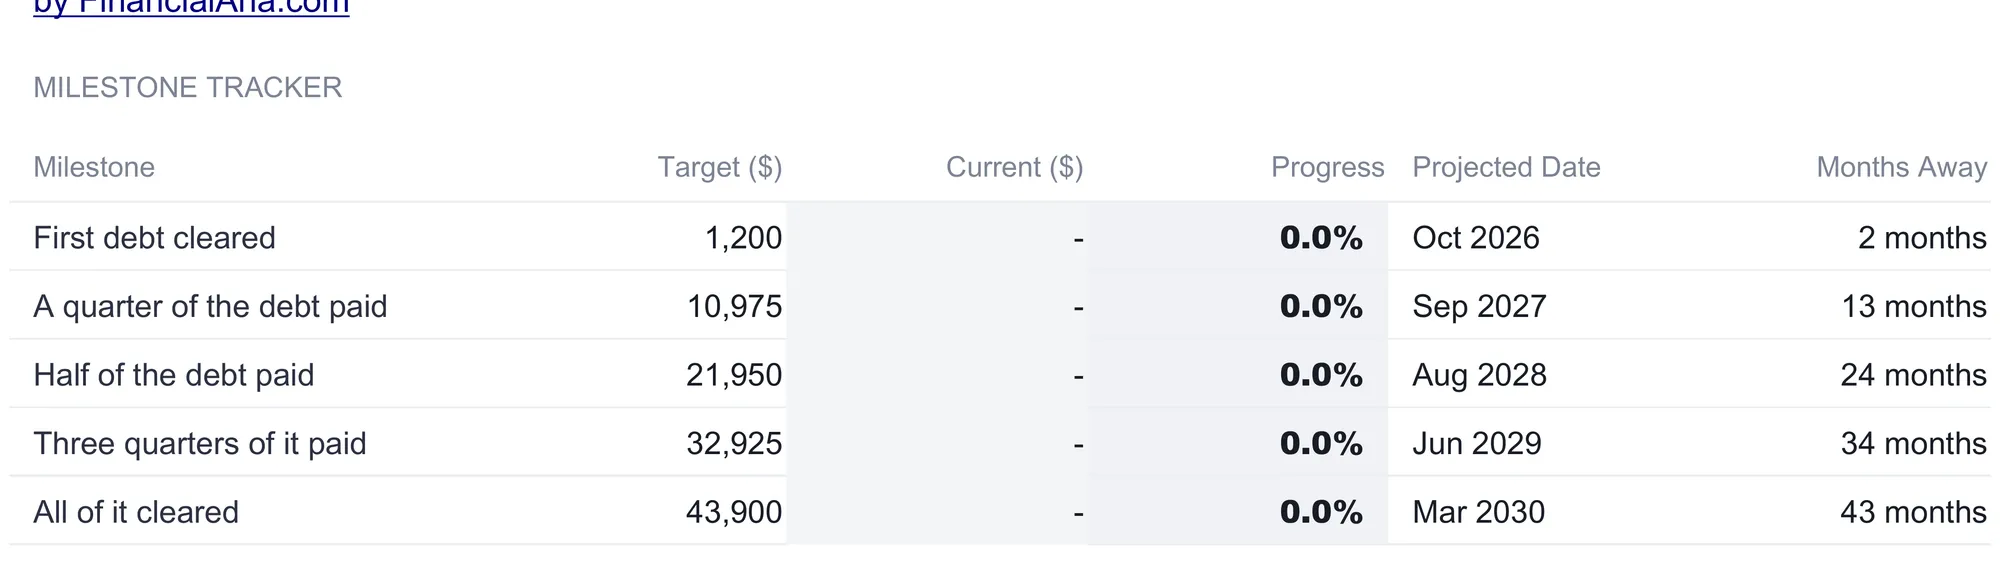
The extra payment on Debt Setup drives the whole plan, so the natural next question is what a different amount would do. The What-If Analysis sheet answers it on the snowball ordering without disturbing the main plan. It has a single input, an extra payment to test, set to $600 in the sample, and it re-solves the entire snowball for that figure in its own hidden schedule, leaving the Debt Setup number untouched.
| Scenario | Extra / month ($) | Months to debt-free | Total interest ($) |
|---|---|---|---|
| Your current plan | 300 | 43 | 7,299 |
| The amount you typed | 600 | 33 | 5,400 |
| Difference | 300 | 10 | 1,900 |
Doubling the extra payment from $300 to $600 pulls the payoff in by 10 months, from 43 to 33, and trims the interest by about $1,900, from $7,299 to roughly $5,400. The Difference row states both effects in one line: how many months sooner the plan finishes and how much interest it avoids. Both rows come from full runs of the same snowball logic, one on the live extra payment and one on the amount being tested, so the comparison is a genuine re-solve rather than an estimate. Because the test run reads the same debts from Debt Setup, editing a balance or a rate moves both rows together, and typing a few amounts in turn is a quick way to find where the extra stops buying much on your own numbers.
The Dashboard: six numbers and two charts
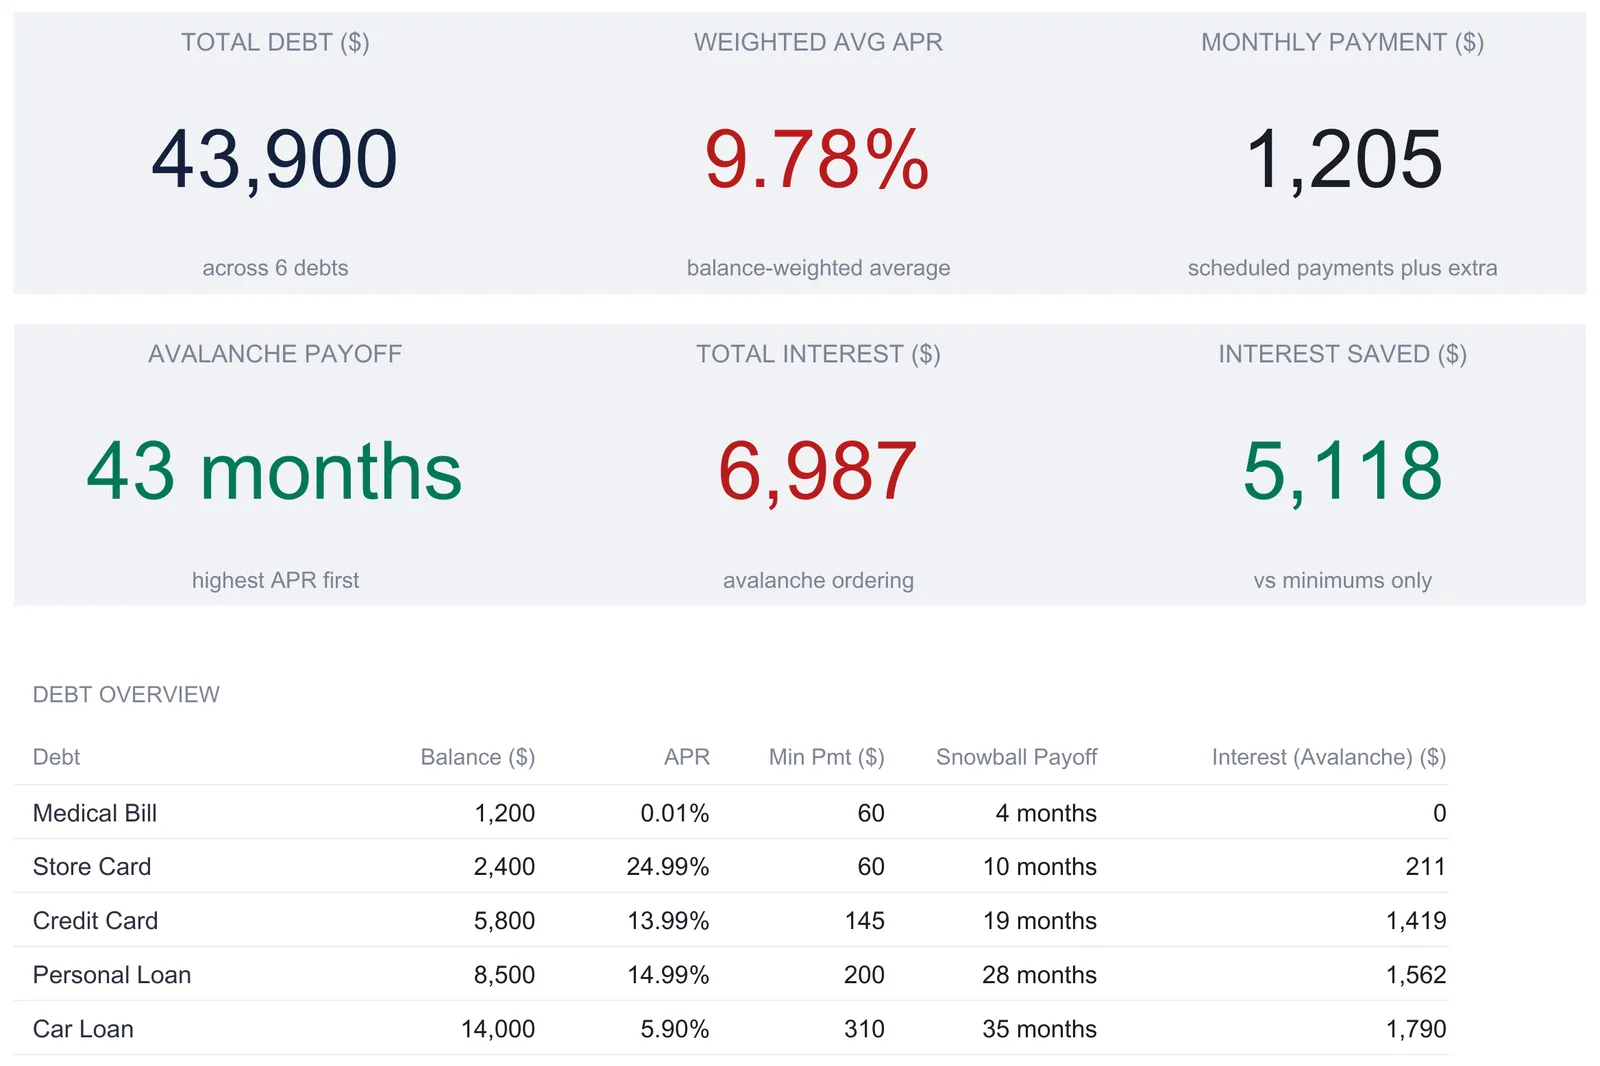
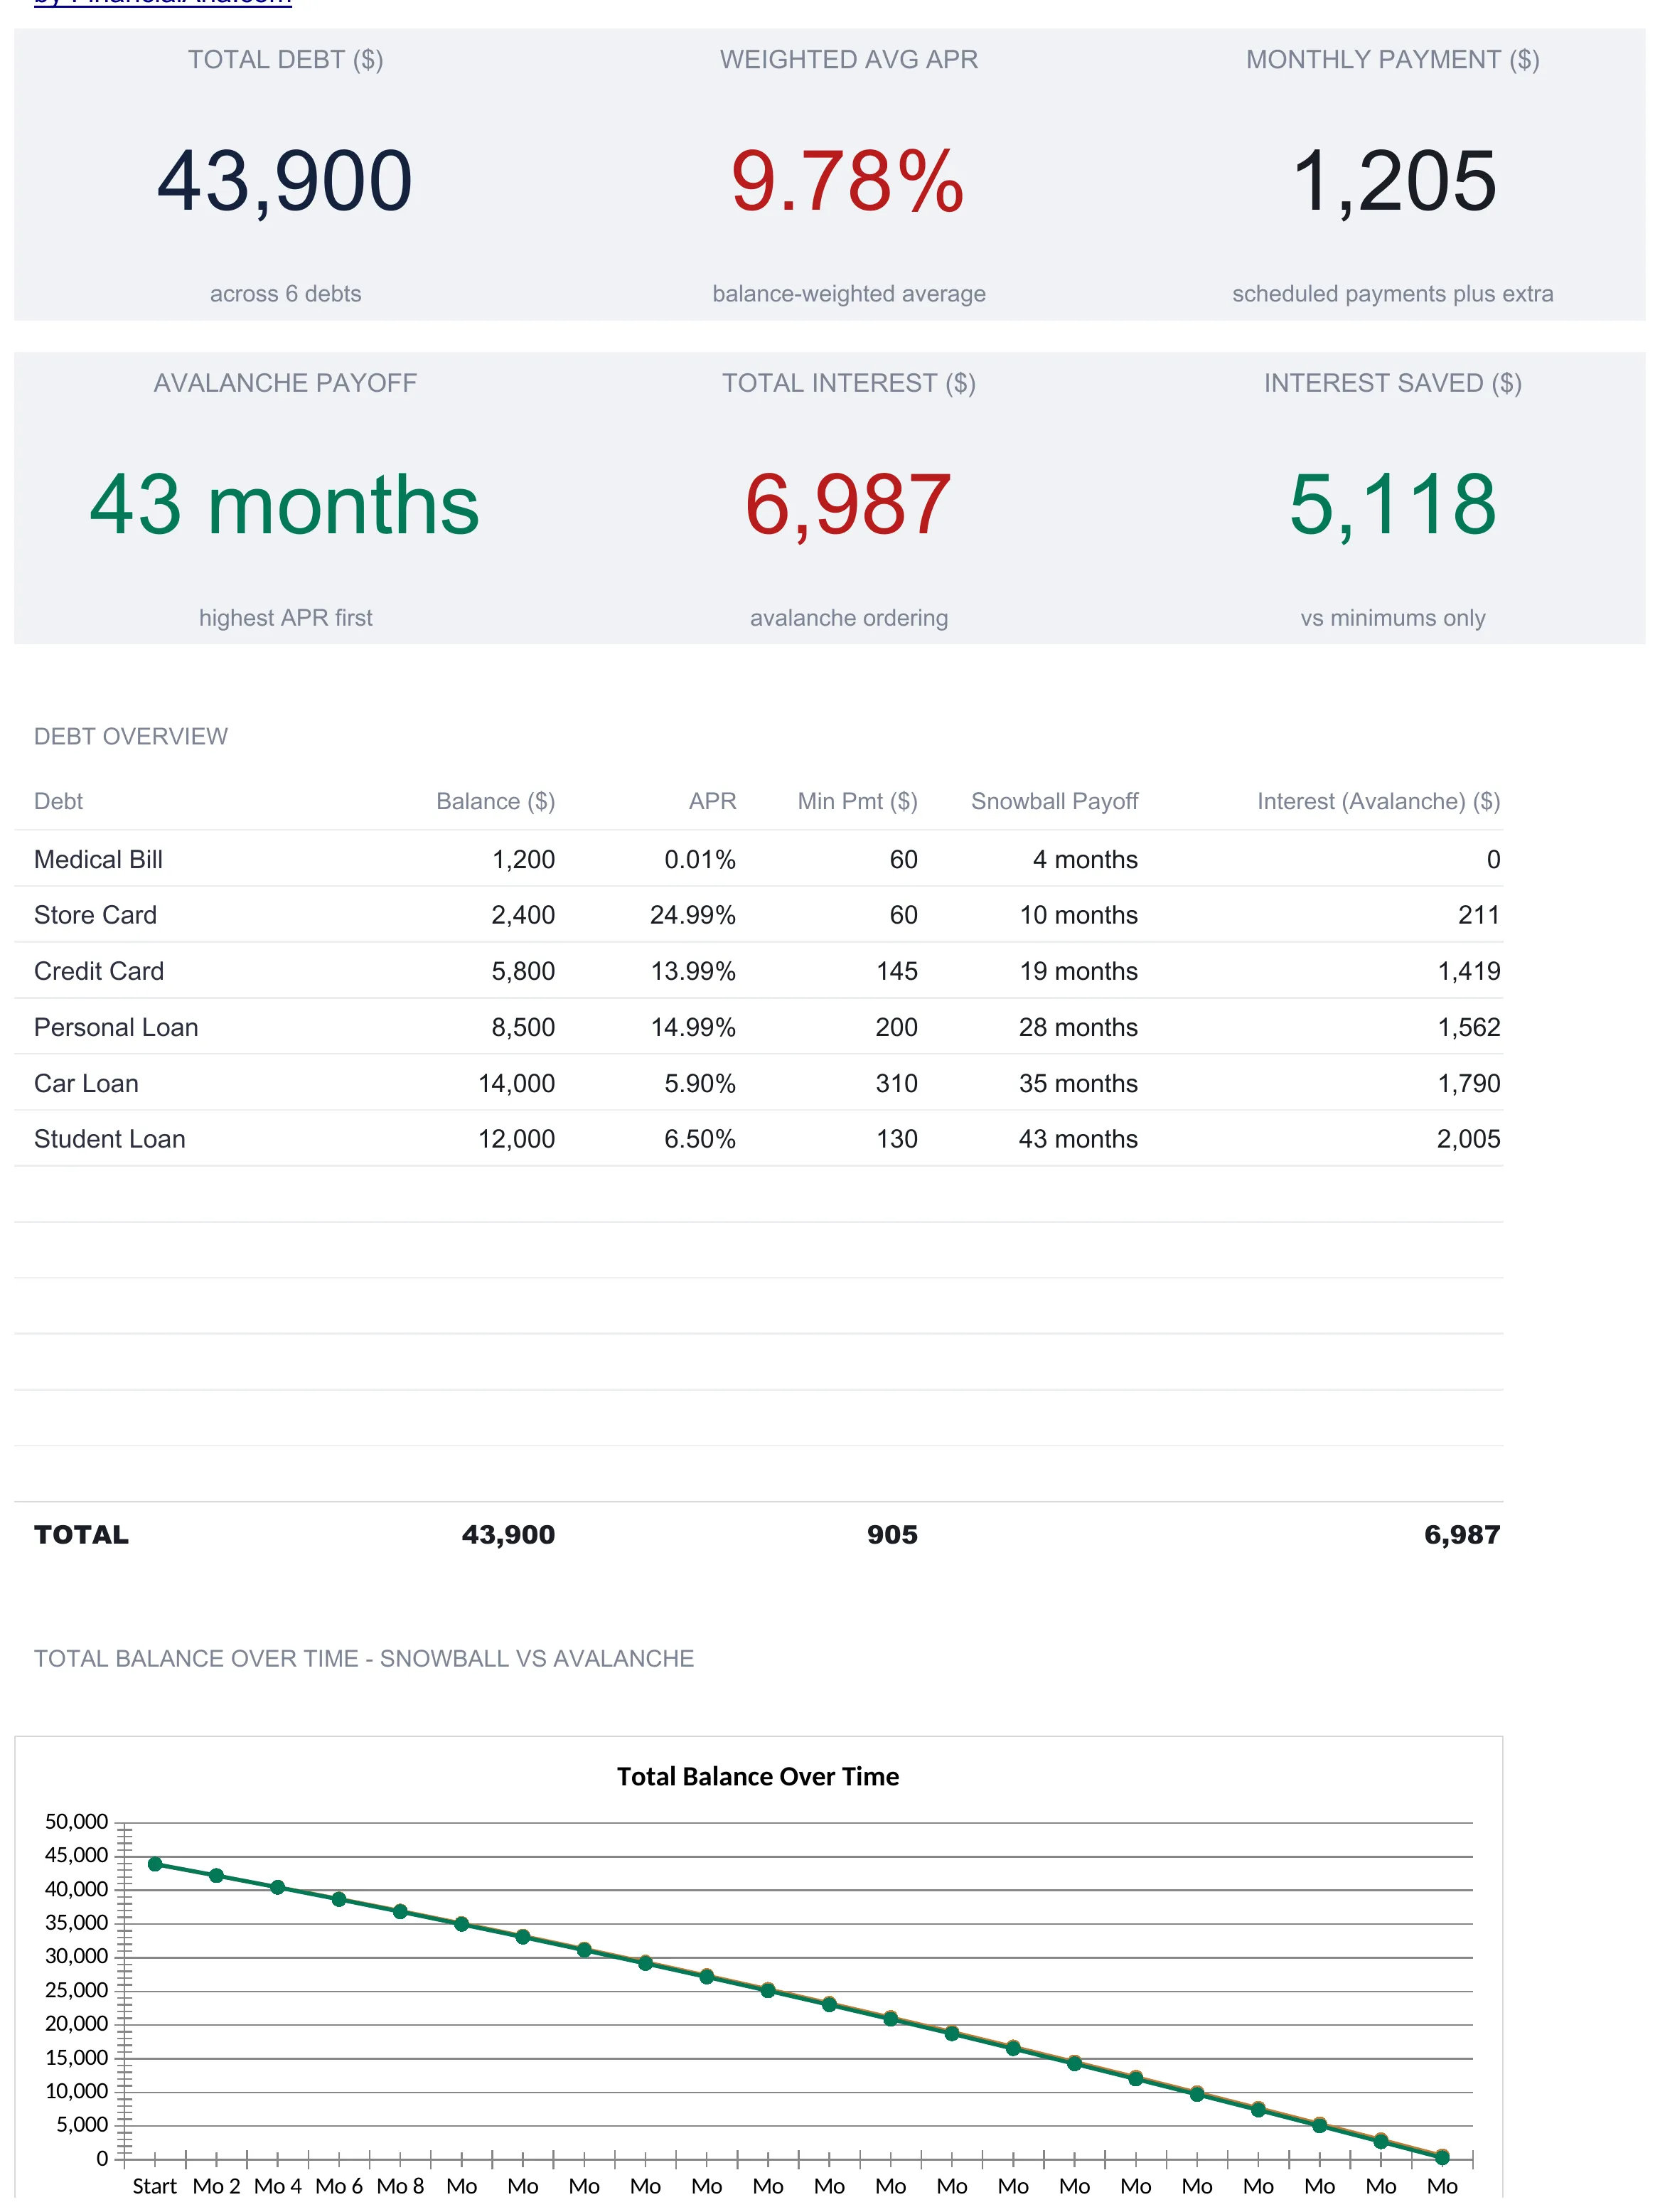
With the inputs entered, the Dashboard, shown at the top of this article, states the plan on one screen. A line above the tiles summarizes it in a sentence, reading “6 debts tracked - avalanche payoff in 43 months” for the sample, and six KPI cards carry the headline figures:
| KPI | Sample value | What it means |
|---|---|---|
| Total Debt | $43,900 | Sum of all balances, across 6 debts |
| Weighted Avg APR | 9.78% | Balance-weighted blended rate |
| Monthly Payment | $1,205 | Scheduled payments plus the extra |
| Avalanche Payoff | 43 months | Time to clear everything, highest APR first |
| Total Interest | $6,987 | Interest paid under the avalanche ordering |
| Interest Saved | $5,118 | Versus minimums only |
The dashboard leads with the avalanche figures because avalanche is the ordering that leaves the least total interest, so it makes a natural default headline, but the other orderings are one sheet away and nothing on this screen instructs you to pick it. The pairing of Total Interest and Interest Saved is worth pausing on, because the two cards answer different questions. Total Interest is the cost of the plan itself, the $6,987 the avalanche ordering hands to lenders on the way to zero. Interest Saved is a relative figure, the $5,118 that separates that plan from doing nothing extra. One is the price of the plan, the other is what the plan buys against the slow path.
Below the cards, a Debt Overview table lists each debt with its balance, APR, minimum payment, the month it is cleared under the snowball ordering, and the interest it accrues under avalanche, ending in a total row. Two charts sit under that. The first, “Total Balance Over Time - Snowball vs Avalanche,” plots the two trajectories together so you can see how close they run. The second, “Interest Paid Per Debt,” shows where the interest lands under each of those two orderings. None of these outputs is typed; every one recalculates from Debt Setup, so change a balance and the whole screen moves.
Snowball, avalanche, custom, and minimum-only in plain terms
Four phrases do most of the work in this template, and it helps to keep them straight.
The snowball pays every minimum, then aims the extra at the smallest balance, rolling each cleared payment onto the next-smallest debt. The order follows balances rather than interest rates, so the early wins come quickly.
The avalanche aims the extra at the highest-APR debt instead, on the logic that the most expensive balance costs the most to carry. Because it starves the high-rate balances first, it is the ordering that leaves the least total interest on any given set of debts, which is why the file uses it for the dashboard headline.
The custom order clears credit cards first, the highest rate among them ahead of the rest, and then everything else by rate. It is a middle path for someone who wants the plastic gone before term loans, and on the sample debts it lands between the other two on total interest.
Minimum-only is the do-nothing-extra baseline: the same debts with no extra payment at all. It is not a strategy anyone chooses so much as the reference the other three are measured against, and in the sample it is the slow, costly path at 62 months and $12,105 of interest, against which each ordering saves 19 months and roughly $5,000.
Excel or Google Sheets for a debt payoff calculator
The template is an .xlsx file built on plain formulas, with no macros and no add-ons, so it runs the same way in Microsoft Excel and in Google Sheets after upload, and in LibreOffice Calc as well. A currency dropdown on the Dashboard relabels every money column and KPI across the workbook; it changes the label shown, not the underlying numbers, so it does not convert anything. Whichever program you prefer, the structure described here, one debt list feeding three orderings feeding a set of read-outs, is the same, and it is buildable by hand in either if you would rather assemble your own spreadsheet template than start from a finished one.
Which debt template fits
- Debt Payoff Calculator Ultimate Spreadsheet Template ($29) is the workbook this walkthrough follows: one debt list, one extra-payment cell, and three orderings computed side by side against a minimum-only baseline, with the snowball schedule, the milestones, and the what-if tester behind them. There is also a free Debt Payoff Calculator ($0), a single sheet that turns one balance, one APR and one monthly payment into months to payoff, total paid and total interest, and an Essentials version ($19) that sets snowball against avalanche across up to eight debts.
- Debt Snowball Ultimate Spreadsheet Template ($29) is the sibling for someone who has already settled on the smallest-balance approach and wants a file built around it alone. It runs the one snowball ordering in depth and measures it against paying minimums, without the avalanche and custom columns this calculator adds.
Related
- How to Build a Debt Snowball in a Spreadsheet - the single-strategy walkthrough this comparison template generalizes
- Debt Payoff Calculator: Snowball vs. Avalanche Compared - the conceptual version of the choice this template computes
- Debt Snowball vs. Debt Avalanche: Which Actually Works? - the strategy debate in plain terms
Frequently asked questions
How is this different from a plain debt snowball spreadsheet?
A snowball-only file computes one ordering, smallest balance first, and usually measures it against paying minimums. This calculator runs three orderings on the same debts and the same extra payment: snowball, avalanche, and a custom credit-cards-first order. It lays their months-to-debt-free and total interest side by side, with a minimum-only baseline behind all three. The comparison is the point of the file rather than a footnote to it.
Does the calculator tell me whether to use snowball or avalanche?
No. It computes both orderings, and the dashboard headlines the avalanche figure because avalanche is the ordering that leaves the least total interest on any set of debts, but the file does not tell you which to follow. The Consumer Financial Protection Bureau lays out both methods and says to choose the strategy that fits your situation, so the numbers are there and the choice stays yours.
Why do all three strategies finish in the same number of months in the sample?
Because every ordering spends the same $1,205 a month, so the total debt is retired at almost the same pace. On the sample debts all three land on 43 months. What changes with the ordering is the total interest, since attacking a higher-rate balance sooner leaves less of it to accrue, and the month each individual debt clears. On a different set of balances and rates the timelines can separate too, which is what re-running your own numbers shows.
How many debts can it hold, and what does each one need?
The Debt Setup sheet takes up to 12 debts, one per row, with unused rows left blank. The sample fills six. Each debt needs a name, a type from a dropdown, the balance, the APR, and the minimum payment, plus an optional monthly payment where the schedules apply the larger of that and the minimum. An interest-free balance is entered as a 0 percent APR.
Do the projected milestone dates change over time?
Yes. The Payoff Milestones sheet counts forward from the month you open the file, so the projected dates shift as the calendar moves while the months-away figures stay tied to the schedule. In the sample the first marker is about 2 months out and the all-cleared marker lands at month 43, roughly three and a half years from the opening month.
Sources
- How to reduce your debt - Consumer Financial Protection Bureau
About this article
Sheets, inputs, sample figures and formulas re-checked on 2026-09-10 against the shipped Debt Payoff Calculator Ultimate workbook (Dashboard, Debt Setup, Payoff Schedule, Strategy Comparison, What-If Analysis, Payoff Milestones, How to Use). The snowball and avalanche definitions checked against the live Consumer Financial Protection Bureau page at writing time. Last reviewed September 2026.