Quick Summary
In 2025, financial planning spreadsheets in Google Sheets or Excel remain superior to apps. They offer transparency, flexibility, and projection capabilities that apps often lack. Learn how to build your own spreadsheet for better money management.
Spreadsheets and finance apps solve different problems. Apps automate transaction tracking. Spreadsheets enable projection - modeling what happens to finances over years under different assumptions.
The distinction matters: looking backward vs looking forward.
For a head-to-head comparison, see Budget Spreadsheets vs Apps or the personal take in Why I Switched From Apps to Spreadsheets.
What Spreadsheets Do That Apps Cannot
| Capability | Apps | Spreadsheets |
|---|---|---|
| Auto-import transactions | Yes | No |
| Custom expense categories | Limited | Unlimited |
| Net worth projection | Rarely | Yes - with adjustable return assumptions |
| Retirement scenario modeling | Basic | Full control - change any variable |
| “What if” analysis | No | Yes - change one input, see all downstream effects |
| Formula transparency | Hidden | Every calculation visible |
| Survival after company shutdown | No | Yes - your file, forever |
Building a Financial Plan in 4 Layers
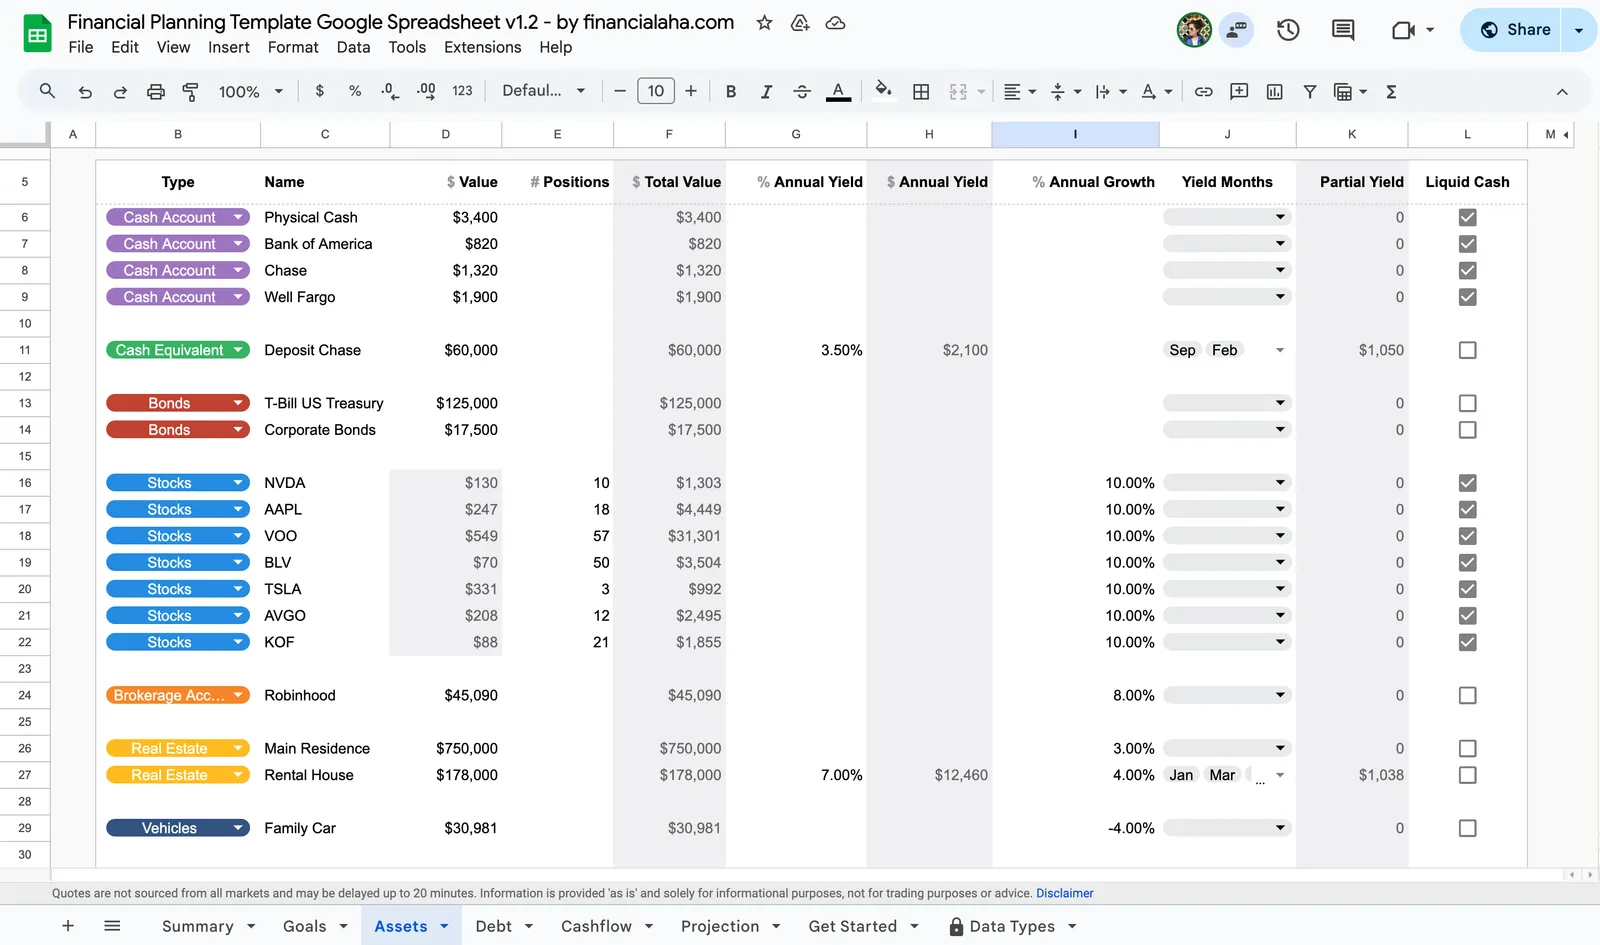
Layer 1: Balance sheet. List every asset (cash, investments, retirement accounts, property) and every debt (mortgage, student loans, credit cards, car loans). Assets minus debts equals net worth - the foundation.
Layer 2: Cash flow. Track monthly income and expenses by category. The gap between the two is savings rate - the single most impactful number for long-term wealth building.
Layer 3: Growth assumptions. Add expected return rates (5-7% after inflation for diversified portfolios is a common range), inflation (2-3%), and contribution amounts. The =FV() function projects how contributions grow over time.
Layer 4: Scenarios. Model different futures:
- Retire at 65 vs 55 - how does the savings target change?
- Pay off mortgage early vs invest the difference
- 6% returns vs 8% returns over 30 years
This forward-looking capability is the core difference. Apps tell you what happened. Spreadsheets help explore what might happen.
Who Gets the Most Value from Spreadsheets
| Situation | Why a Spreadsheet Helps |
|---|---|
| Freelancer with variable income | Model best/average/worst case scenarios |
| FIRE community | Compare 3% vs 4% withdrawal rates across 40+ years |
| Family with overlapping goals | See how college savings, mortgage payoff, and retirement interact |
| Career changer | Model income gaps and runway calculations |
Templates vs Building from Scratch
Building from scratch provides full control but takes time. Templates offer a structured starting point with formulas already built - useful for getting past the blank spreadsheet barrier.
The Financial Planning Template includes balance sheet, cash flow, projections, and retirement modeling in one spreadsheet. All formulas are visible and editable.
Related
- Budget Spreadsheets vs Apps - Feature-by-feature comparison
- Why I Switched From Apps to Spreadsheets - Personal experience
- How to Create an Advanced Personal Finance Tracker - DIY tutorial
- Financial Planning Template - Ready-made spreadsheet
- Personal Finance Spreadsheet Templates Compared - Hands-on review