
Tax drag is the slice of return lost each year to taxes on dividends, interest, and realized gains, typically 0.5% to 2% in a taxable account. On $100,000 invested for 30 years at 8%, a 1.5% annual drag costs roughly $345,000 of the potential growth. The largest lever is account placement, holding tax-inefficient assets inside a 401(k), IRA, or Roth so their distributions compound untaxed.
Nobody writes you a bill for tax drag. There is no line item on a brokerage statement that says “taxes quietly ate this much of your returns this year.” It just happens, a fraction of a percent here, another fraction there, and over decades the cumulative cost is startling.
The Tax Drag Calculator puts a concrete number on what taxes cost your portfolio. No signup required.
The Invisible Fee
Think of tax drag as an extra fee layered on top of your investment costs. Expense ratios get plenty of attention. Tax drag often gets none. Yet for many investors in taxable accounts, it costs more than their fund fees.
Tax drag comes from three sources, each taking a small bite every year:
Dividends. A stock portfolio yielding 2% in qualified dividends, taxed at the 15% long-term capital gains rate for most middle-income investors, generates 0.30% in annual tax drag. The dividends arrive, the taxes go out, and your effective return drops by a third of a percentage point.
Bond interest. Taxed at ordinary income rates, not the preferential capital gains rates. A 3% bond yield in the 24% bracket creates 0.72% in drag. Bonds are especially tax-inefficient in taxable accounts - a detail that matters for asset placement decisions.
Turnover and realized gains. When a fund sells holdings at a profit, you owe tax on the distributed capital gains even if you never sold a share yourself. Actively managed funds with 50-80% annual turnover can generate meaningful tax drag. Index funds with 3-5% turnover generate very little.
Add those together and a typical balanced portfolio in a taxable account faces 0.5% to 2.0% in annual tax drag, depending on the investments and the investor’s tax bracket.
Small Percentages, Large Dollars
Here is where it gets uncomfortable. Take $100,000 invested for 30 years at 8% gross return and see what different levels of tax drag do:
| Annual Tax Drag | Net Return | 30-Year Value | Lost to Drag |
|---|---|---|---|
| 0% (tax-free account) | 8.0% | $1,006,266 | - |
| 0.5% | 7.5% | $875,496 | $130,770 |
| 1.0% | 7.0% | $761,226 | $245,040 |
| 1.5% | 6.5% | $661,437 | $344,829 |
| 2.0% | 6.0% | $574,349 | $431,917 |
At 1.5% annual drag, you lose $344,829 over 30 years. That is more than a third of the potential growth, gone. Not to bad investment decisions, not to high fees, just to the annual tax friction of holding investments in the wrong type of account.
Plug your own balance, annual contribution, expected return, annual tax rate, and investment period into the calculator. It compares tax-advantaged growth against the same money taxed every year, and reports the cost of the drag in dollars:
Not All Investments Drag Equally
The variation across investment types is significant:
Growth stocks that pay no dividends and sit in a buy-and-hold portfolio have almost zero tax drag until sold. They compound quietly without annual tax events.
A total stock market index fund generates modest drag, maybe 0.2% to 0.4% annually, from its dividend distributions and minimal capital gains distributions.
Actively managed stock funds, with their higher turnover and more frequent capital gains distributions, typically create 0.5% to 1.5% in annual drag.
Bond funds are the worst offenders in taxable accounts. Interest income taxed at ordinary rates (not preferential capital gains rates) means a bond fund can generate 0.6% to 1.2% in drag for someone in the 22-24% bracket.
REITs (real estate investment trusts) distribute most of their income as ordinary dividends rather than qualified dividends, which pushes their tax drag to 0.8% to 1.5% for many investors.
The Fix Is Account Placement
The single most effective way to reduce tax drag is putting tax-inefficient investments in tax-advantaged accounts. This is sometimes called “asset location” - distinct from asset allocation.
Hold the same overall portfolio, but rearrange which account holds what:
In your 401(k) or IRA: Bonds, REITs, actively managed funds - the things that generate the most taxable income. Inside a tax-advantaged account, their distributions compound without any annual tax hit.
In your taxable brokerage: Index funds, growth stocks, tax-managed funds - investments with low turnover and qualified dividends. Their tax drag is already low, and that is where you want it.
In your Roth IRA: The investments you expect to grow the most. A Roth never taxes growth, so the highest-return assets benefit most from being there.
This rearrangement does not change your risk level or overall allocation. It just reduces the tax friction across the whole portfolio.
Tax Drag Stacks With Fees
Both tax drag and expense ratios reduce your net return, and they compound against you simultaneously.
An actively managed fund might charge a 0.75% expense ratio and generate 1.0% in tax drag. That is 1.75% eaten before you see any return. A low-cost index fund at 0.04% expense ratio with 0.3% tax drag costs 0.34% total. Over 30 years, the 1.41% annual difference between those two approaches turns $100,000 into about $915,000 versus $616,000.
The message is not complicated: both costs matter, and the cheapest investment in terms of fees can still be expensive in terms of taxes if it is in the wrong account.
Why Most People Underestimate This
Tax drag is invisible in all the usual places people check. Brokerage statements show pre-tax returns. Fund fact sheets show pre-tax performance. Portfolio tracking apps show pre-tax growth. The entire industry defaults to reporting numbers before the tax bite, which means most investors have never seen their actual after-tax return.
This is not deception - it is convention. But the result is that an investor looking at their portfolio and seeing “8% return” genuinely believes they earned 8%. They did not. They earned 8% minus whatever the IRS took along the way. For someone in a taxable account with a balanced portfolio, the real return might be closer to 6.5%.
The difference between believing you earn 8% and actually earning 6.5% compounds into a planning error over time. Retirement projections based on pre-tax returns overestimate the final number. Savings rate calculations based on pre-tax returns suggest you need less than you do. Tax drag is the cost nobody budgets for because nobody sees it on a statement.
The Annual Tax Planner Template logs dividends, capital gains, and interest as dated income lines and applies a rate you enter for each income type, so the year’s investment tax sits in one place. The Financial Planning Template lists holdings by asset type with a value, annual yield, and annual growth on each, and projects the total forward to an end year you pick. Neither one models tax drag or separates holdings by account type.
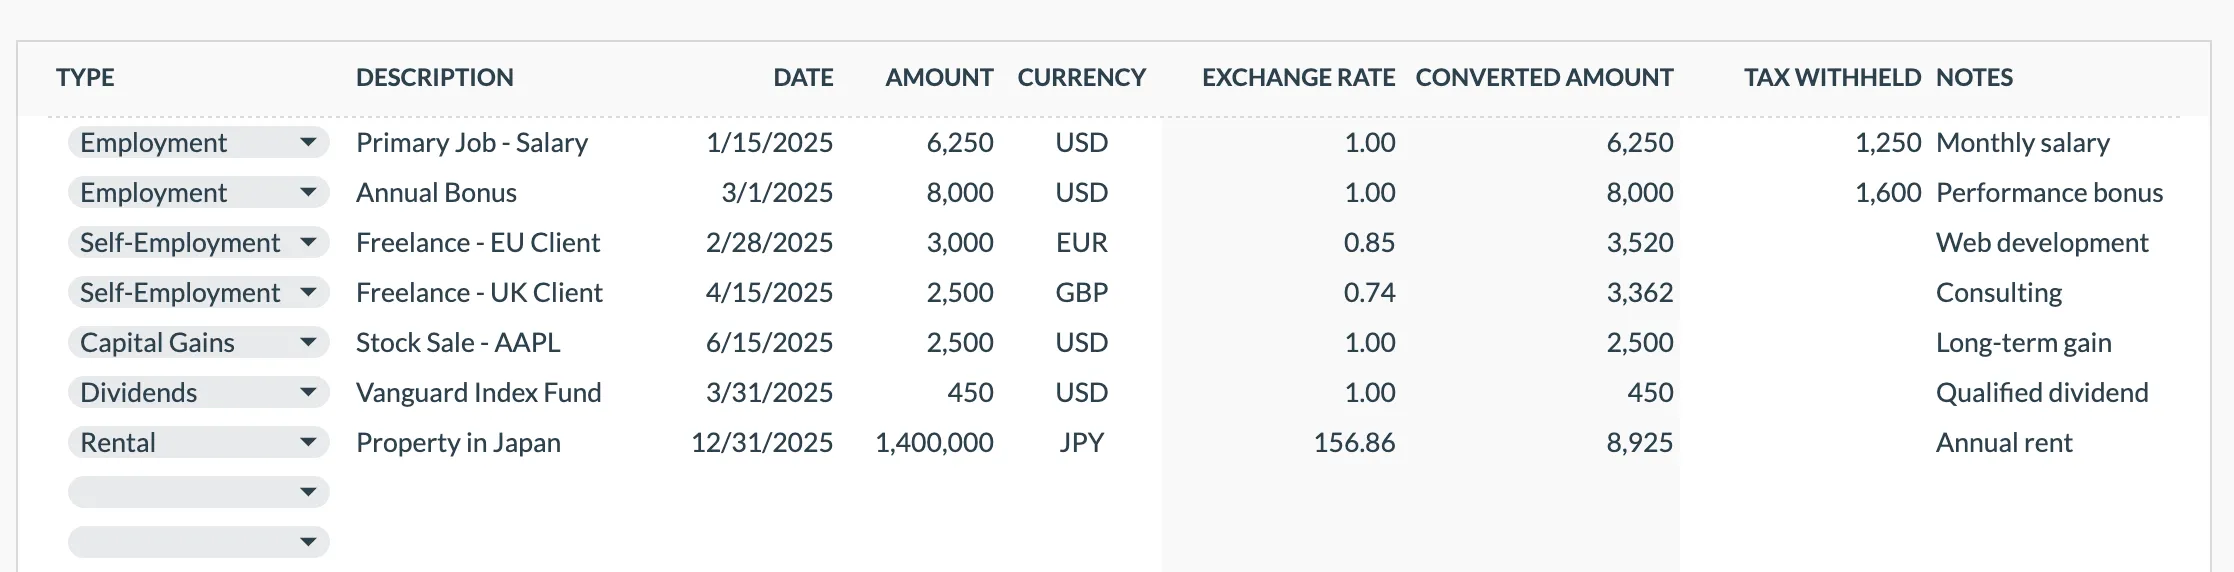 The Annual Tax Planner (Premium tier) logs each income source with its date, amount, and currency, including dividend and capital gains lines, and carries a Tax Withheld column for tax already paid.
Tax-Aware Investing Guides
- After-Tax Return Calculator - What investments actually earn after all taxes
- Capital Gains Tax Calculator - Tax on selling stocks, funds, and other investments
- HSA Calculator: Triple Tax Advantage - The most tax-efficient investment vehicle
Related
Frequently asked questions
Do I owe tax drag if I never sell my investments?
Partly. Selling nothing avoids capital gains tax on your own trades, but dividends and bond interest are still taxed in the year they are paid, and mutual funds can pass through capital gains distributions even when you hold every share. Those annual events are what create drag in a buy-and-hold taxable account.
Do municipal bonds create tax drag?
Much less at the federal level. Interest from most municipal bonds is exempt from federal income tax, so it does not add to federal tax drag the way a taxable bond fund does. State tax treatment varies, and muni yields are usually lower to begin with, so the comparison is about after-tax yield rather than headline rate.
Is tax drag the same as expense ratios?
No. Expense ratios are fund management fees charged regardless of return. Tax drag is the cost of taxes on dividends, interest, and realized gains. Both reduce net return, and they stack: a fund can be cheap on fees and still expensive on taxes if it sits in the wrong account.
Does tax drag matter in retirement accounts?
Not while the account is growing. Tax-deferred and tax-free accounts have zero tax drag during accumulation. Traditional 401(k) and IRA balances face income tax on withdrawal, while a Roth is never taxed on growth, which is why the highest-return assets are often placed there.
Sources
- Topic no. 409, Capital gains and losses - Internal Revenue Service
- Topic no. 404, Dividends - Internal Revenue Service
- Topic no. 403, Interest received - Internal Revenue Service
About this article
Tax treatment of qualified dividends, capital gains, and interest checked against IRS Tax Topics 409, 404, and 403. Growth figures computed from stated inputs: $100,000 compounded for 30 years at the net return in each row. Calculator inputs and outputs verified against the live Tax Drag Calculator, and the template descriptions against the shipped Annual Tax Planner (Dashboard, Income) and Financial Planning (Assets, Projection) spreadsheets, on 2026-09-10. Last reviewed September 2026.