
Four patterns drive most seasonal budget misses: the December holiday spending that peaks as January bills, utility bills that swing sharply between heating and cooling seasons, the late-summer back-to-school spike, and annual bills that land in a single month. The common fix is a sinking fund that spreads each cost evenly across the year, so no one month has to absorb the whole hit.
Most budgets pretend every month is the same. They assign flat numbers to categories, say $500 for groceries, $200 for utilities, and $150 for entertainment, and then act surprised when December costs twice what March does. Anyone who has lived through more than one calendar year already knows that spending has a shape. The interesting question is what to actually do about it.
12-month view: The Annual Budget Template shows all months side-by-side, which makes seasonal patterns obvious at a glance.
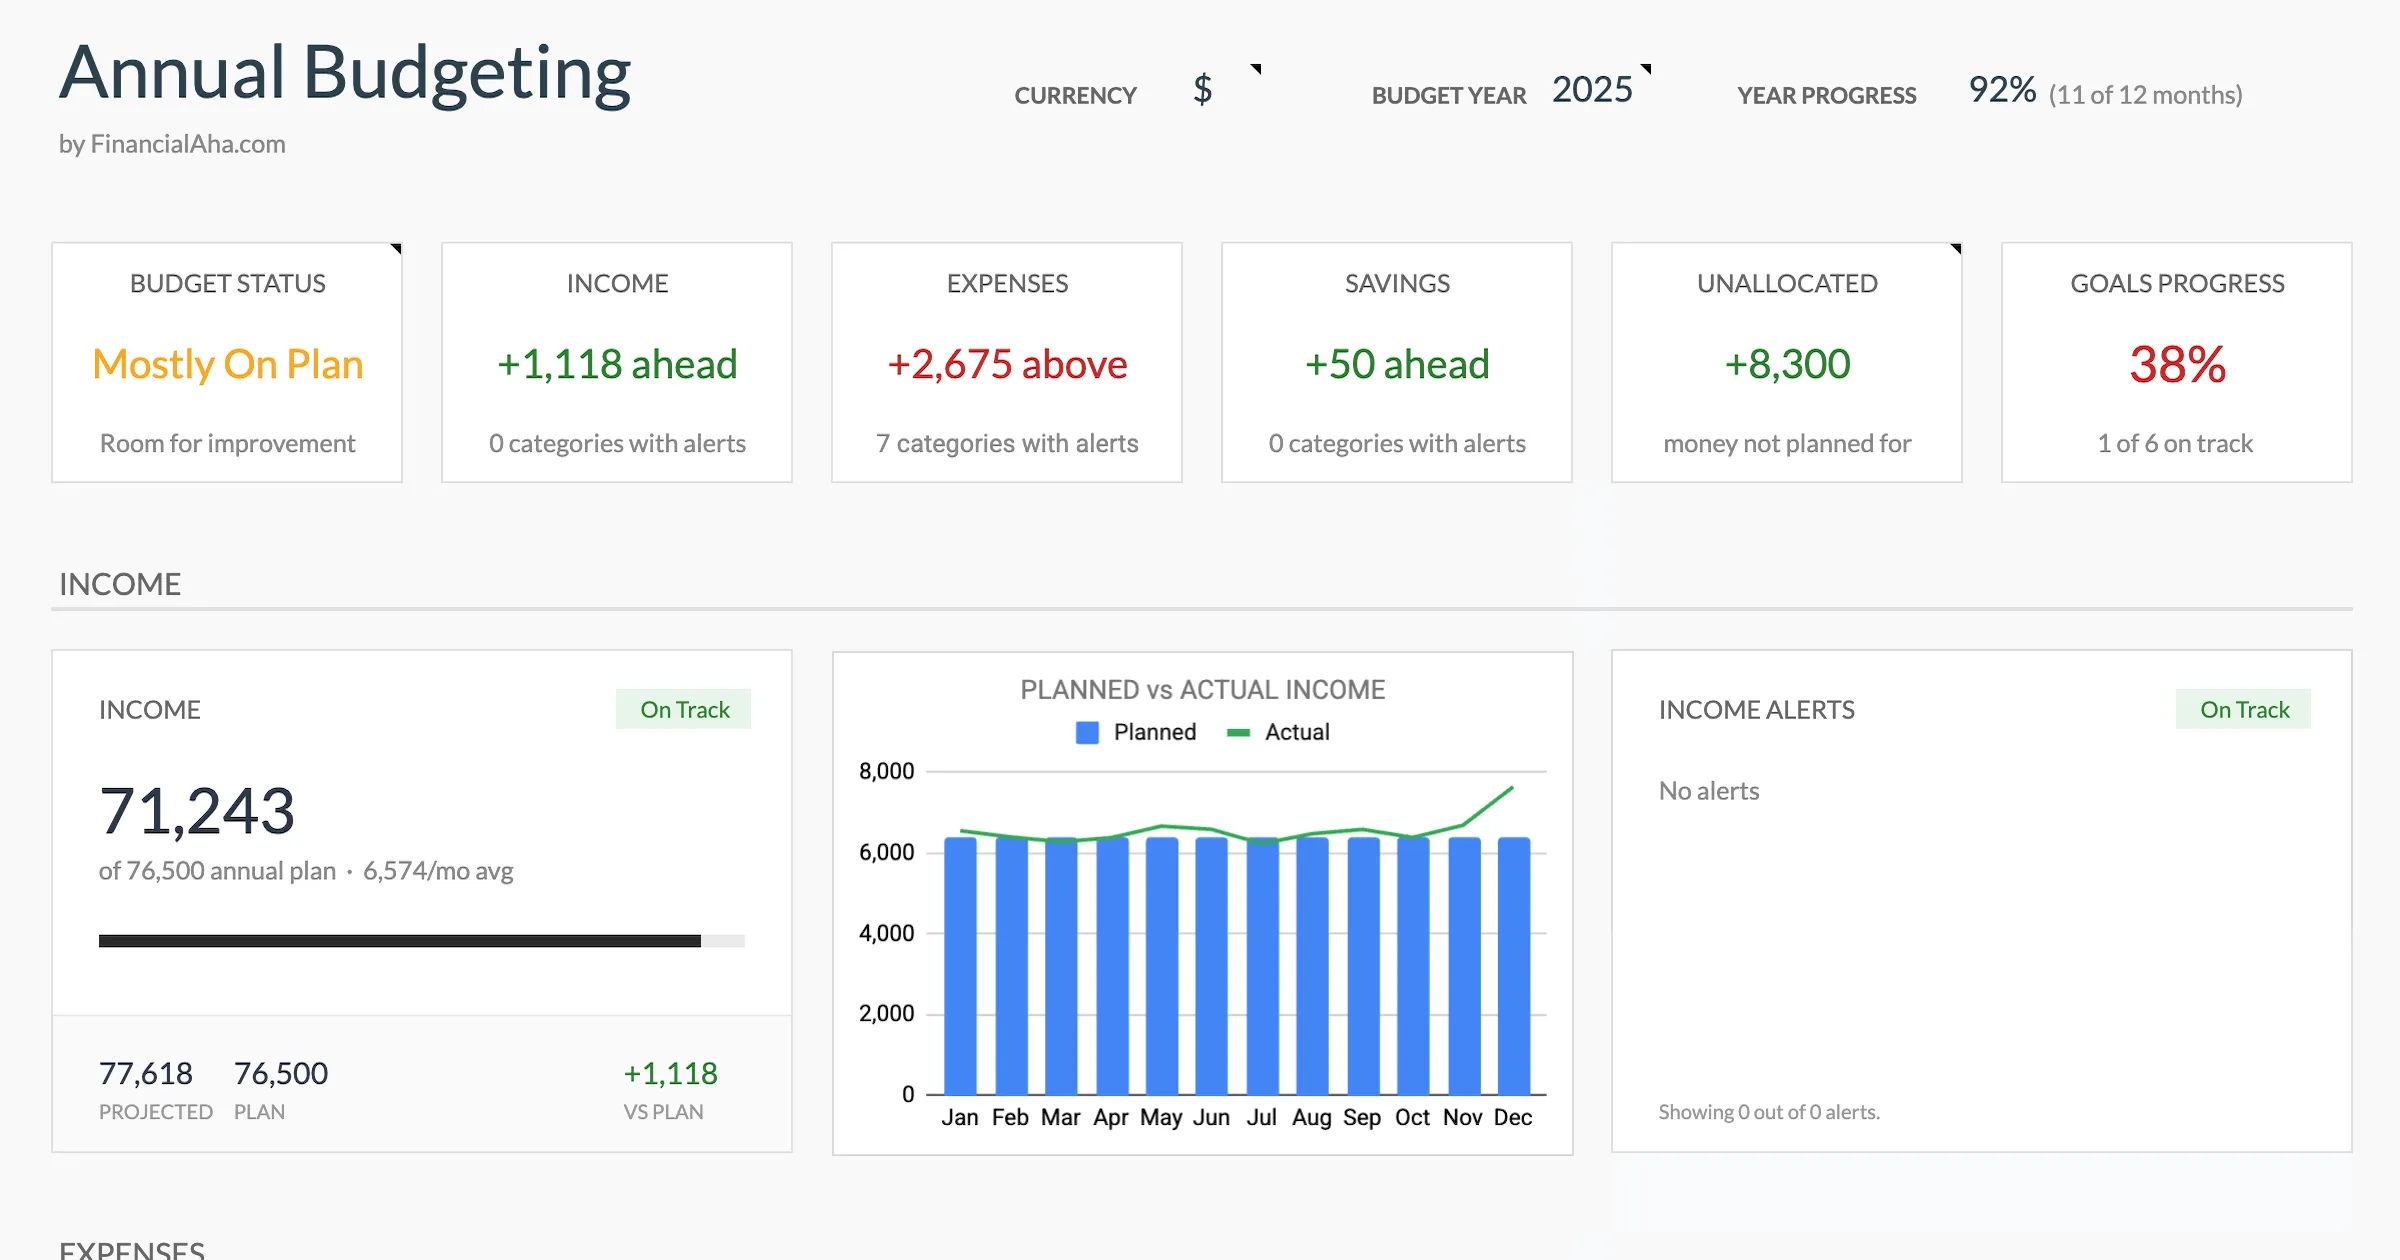
The Annual Budget Template (Premium tier) lays out all twelve months at once, so the shape of a year, the high months and the low ones, is visible without flipping between tabs.
The December Echo
The biggest seasonal spending event is obvious: the winter holidays. But the part that catches people off guard isn’t December itself - it’s January.
December spending is high and everyone knows it. Gifts, travel, food for gatherings, decorations, charitable donations. These add up, and most people at least vaguely expect it. The real damage happens when the credit card statement arrives in January and collides with heating bills at their peak, a new year’s worth of annual subscriptions renewing, and maybe an insurance deductible resetting.
January is consistently one of the tightest months for household budgets, and it’s not because January spending is high. It’s because December spending hasn’t finished hurting yet.
The practical response: start funding December in July. This is the classic sinking fund approach. If your holiday spending typically runs $1,200-1,500 (gifts, food, travel, everything), setting aside $200-250 per month from July through December means the money is there when you need it. The spending still happens, but it doesn’t crash into January’s bills.
Looking at last year’s bank and credit card statements for November and December is useful here. Most people underestimate their holiday spending when guessing from memory. The actual number, once you add up the mid-December grocery runs, the last-minute online orders, and the restaurant meals with visiting family, is usually higher than the figure that comes to mind.
The Utility Swing
Utility bills are the most mathematically predictable seasonal expense, and also the one that generates the most month-to-month budget frustration.
Space heating and air conditioning made up 52% of the average U.S. household’s energy use in 2020, and the Energy Information Administration notes those uses are mostly seasonal. That is why the same house can see a large gap between its cheapest and most expensive utility months. A $180 gas bill in January and a $40 gas bill in July aren’t unusual. Air conditioning in August might push an electric bill to $220 when it was $120 in April. These swings are large enough to throw a flat monthly budget off by a meaningful amount.
Three approaches work for handling this:
Budget the actual amount. Look at last year’s bills month by month and use those numbers (adjusted slightly for rate changes). This is more accurate but means your budget looks different every month. The Annual Budget Template makes this practical by showing all twelve months at once - you can see the full arc instead of one month at a time.
Budget the average and save the difference. If your annual utility cost is $3,000, that’s $250 per month. Budget $250 every month. During the $180 months, the extra $70 goes into a utility sinking fund. During the $320 months, the fund covers the difference. This keeps your monthly budget consistent while acknowledging reality.
Use level billing. Many utility companies offer this - they average your annual cost and charge the same amount each month. It’s essentially automated sinking fund management. Worth checking whether your providers offer it.
Any of these works. The one that doesn’t work is budgeting $200 for utilities in January and being surprised when the bill is $320.
The Back-to-School Crunch
For households with kids, August is a second December. School supplies, new clothes and shoes (because kids grow), technology requirements, activity fees, sports equipment. The total varies wildly by age, since a first grader needs different things than a high schooler, but the pattern is consistent: a concentrated spending spike in late summer.
What makes this tricky is that it overlaps with the tail end of summer spending. August is often the month of the last family trip, the last round of summer camp, and the back-to-school shopping - all at once.
The numbers vary, but $300-700 per kid per year is a common range for the school-related portion. Spreading that across six months (February through July, say) turns a $500 August spike into a barely noticeable $83 per month.
One useful habit: keep a running list during the school year of things that will need replacing or buying for next fall. Shoes that are getting small, a backpack showing wear, a teacher’s note about technology requirements for next year’s classes. By the time August arrives, the list already exists and the money is already set aside.
College brings the same lumpiness at a larger scale, since tuition, housing, and books all land at the start of each term. The student budget template for college handles it with a semester layer for those big charges and a monthly layer for everything in between.
Annual Bills That Ambush
The least seasonal-sounding pattern that acts the most seasonal: annual and semi-annual bills, the kind of irregular expenses that never show up on a monthly line. Car insurance paid every six months. Renter’s or homeowner’s insurance annually. Vehicle registration. Professional memberships. Amazon Prime. That one software subscription you forgot charges yearly.
Each of these individually ranges from $50 to $1,500. Collectively, they might total $2,000-4,000 per year, landing in specific months that are easy to forget about until the charge appears.
The fix is straightforward but requires a one-time effort: list every non-monthly bill with its due date and amount. Then divide by 12 and set that amount aside each month. If your annual bills total $2,400, that’s $200 per month into a dedicated sinking fund.
The initial exercise of finding all these bills is the tedious part. Bank statement searches for the past 12 months catch most of them. Look for any charge over $100 that only appears once or twice. Once the list exists, maintaining it is simple - just add new annual subscriptions as they happen.
Why Flat Budgets Break
All of these patterns share a root cause: real spending is lumpy, but budgets assume it’s smooth.
A flat budget set to your average monthly spending will be wrong every single month. It’ll be too high in some months and too low in others. The months where it comes up short, whether that’s December, January, August, or whatever month your insurance renews, feel like budget failures even though they were entirely predictable.
Seasonal budgeting isn’t about tracking every minor fluctuation. It’s about acknowledging the 3-4 major patterns that affect your household and building a plan that accounts for them. For most people, that means: holiday spending, utility swings, back-to-school (if applicable), and annual bills.
Everything else, from slightly higher grocery costs in summer to the occasional seasonal car expense, tends to fall within normal budget variance. It’s the big predictable swings that deserve specific planning.
Getting Started
Pull up last year’s bank statements. Look at total spending by month. The shape of your year will be immediately obvious - which months ran high, which ran low, and by how much.
Then pick the pattern that causes the most stress and address that one first. For most people, that’s either December holidays or an annual bill that catches them off guard. Set up one sinking fund. Get that working. Then add the next pattern.
The Monthly Budget Template covers a single month in detail, with a budget figure and an actual figure on every category row plus the difference and the percentage spent, so a heavy month can be planned at different numbers than a quiet one. The Annual Budget Template gives the full year view, all twelve months side by side, which makes the seasonal shape visible in a way that single-month tracking can’t.
Get the Annual Budget Template →
Related
- Annual Budget Template - 12-month view
- Monthly Budget Template - Adjustable per month
- Sinking Funds Explained
- Budget for Irregular Expenses
Frequently asked questions
How detailed should a seasonal budget be?
For most households, tracking the 3-4 patterns with the biggest swings is enough: holidays, utilities, back-to-school if it applies, and annual bills. Smaller month-to-month wobbles tend to fall within normal budget variance, so adding a line for every seasonal quirk usually creates more upkeep than it saves.
What if my income varies by season too?
When income and spending both move with the calendar, some people time their sinking-fund contributions to the higher-earning months and draw on the fund during the leaner ones. An annual view that shows all twelve months at once makes it easier to see where the surplus and shortfall months line up.
How do sinking funds fit with seasonal budgeting?
A sinking fund is the mechanism behind almost every fix here. You set aside a small amount each month, then draw it down when a predictable peak arrives, so a $1,200 holiday season or a six-month insurance premium never lands on one month's budget in full.
What if I start a sinking fund partway through the year and can't fully fund the next peak?
Partial funding still helps. If December is four months out and you can only set aside part of the total, the fund covers what it covers and the rest comes from that month's cash flow. The following year, starting the same fund in January spreads the full amount across all twelve months.
Does utility level billing actually save money?
Level billing does not lower the total you pay over a year; it averages the same annual cost into equal monthly charges so no single bill spikes. Providers usually reconcile the difference periodically, so a colder-than-expected winter can still leave a true-up charge. It is a smoothing tool, not a discount.
Sources
- Use of energy in homes: heating and cooling - U.S. Energy Information Administration
About this article
Utility seasonality checked against U.S. Energy Information Administration residential energy-use data (space heating and air conditioning were 52% of household energy consumption in 2020, and are mostly seasonal). Dollar amounts in the examples are illustrative figures for planning, not survey averages. Template claims checked on 2026-09-10 against the shipped Annual Budgeting Planner (Summary, Annual Plan tabs) and Monthly Budgeting (Summary, Budget Plan, Transactions tabs) Google Sheets. Last reviewed September 2026.