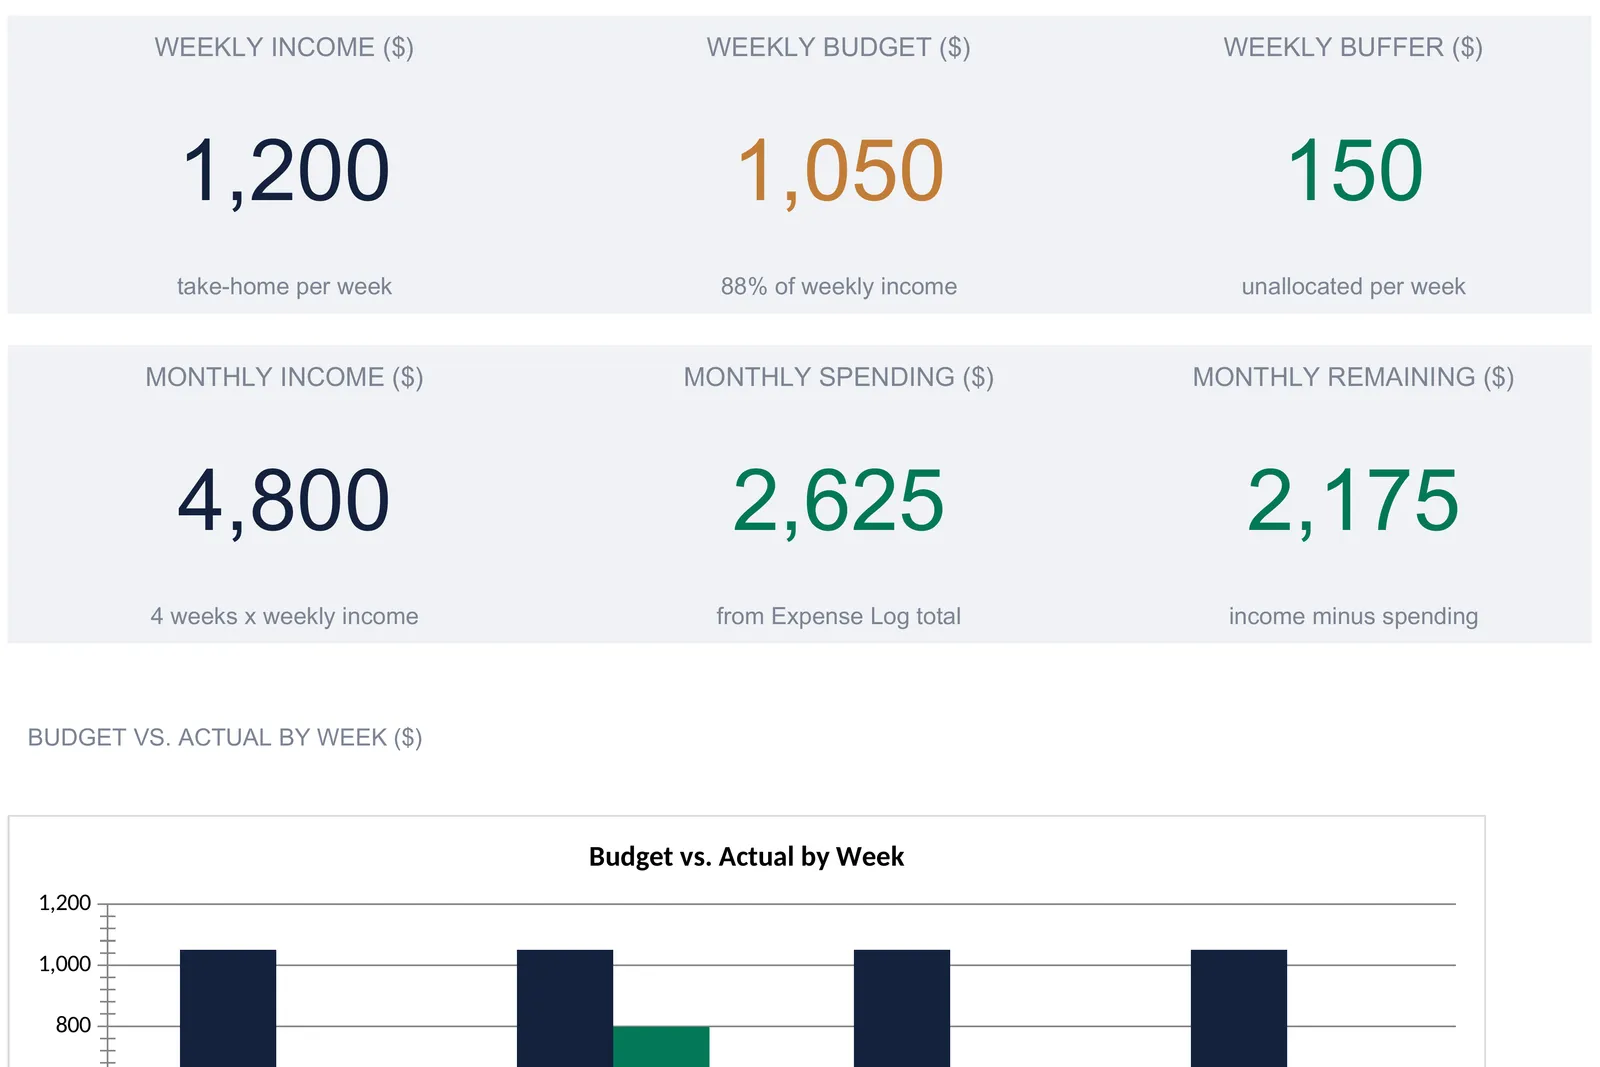
A weekly budget splits the month into four weekly buckets instead of one monthly total, so overspending shows up within days rather than at month-end. This walkthrough builds the structure sheet by sheet from the workbook's own sample: $1,200 take-home a week, ten category targets adding to $1,050, a $150 buffer, forty logged transactions totaling $2,625.34, and a 52-week overview that reaches $50,083 for the year. The Weekly Budget Ultimate ($29) ships the whole thing ready for Excel and Google Sheets.
Most budgets run on the month. One income figure at the top, a column of spending underneath, and a total at the bottom that tells you, on the last day, whether the two balanced. The trouble is the timing. By the time a monthly budget reports that dining out ran high, the month is over and the money is already spent. A weekly budget shortens that feedback loop. It asks a smaller question four times a month: did this week land inside its targets? If not, there are still three weeks left to adjust.
The arithmetic is not complicated. A week has a clear beginning and end, ten or so spending categories each get a weekly number, and every purchase lands in one of them. What makes a spreadsheet the right tool is the bookkeeping around that simple idea, keeping four weeks, a running transaction log, a monthly rollup, and a full year lined up so they never drift apart. The walkthrough below follows our Weekly Budget Ultimate Spreadsheet Template ($29), which ships the whole structure ready for Excel and Google Sheets. Every number here comes from the workbook’s own sample data, so you can match it cell for cell, and the layout is reproducible by hand if you would rather build your own.
What a weekly budget tracks
Strip away the framing and a weekly budget holds only four kinds of information:
- The weekly inputs. One take-home figure for the week and a target amount for each spending category. These are the only numbers you decide; everything else is computed from them.
- Actual spending, week by week. What you spent in each category, either typed as a weekly total or built up from a running transaction log.
- A monthly rollup. The four weeks combined, compared against the monthly version of each target, and totaled by category.
- A full-year view. Each month’s totals tracked across twelve columns, so seasonal swings are visible rather than hidden inside a single month.
The Weekly Budget Ultimate gives each of these its own sheet. There are six working tabs: Weekly Setup, the Week 1-4 Budget tracker, the Expense Log, the Monthly Summary, the 52-Week Overview, and a Dashboard on top. A seventh sheet, How to Use, carries the instructions. The walkthrough follows the same path, starting with the inputs and ending at the dashboard that reads everything back.
Start with the inputs: the Weekly Setup sheet
Everything the workbook calculates traces back to the Weekly Setup sheet, which is why it comes first. The instruction line at the top states the convention the whole file follows: the tinted cells are the ones you fill in. The How to Use sheet carries the other half of the rule, that white cells hold formulas and update on their own.
The sheet opens with income. Weekly Take-Home Pay is $1,200 in the sample, and an Other Weekly Income line sits below it at $0 for anyone with a second stream. Total Weekly Income sums the two to $1,200, and a Monthly equivalent cell beside it multiplies by four to show $4,800. That times-four relationship is the hinge the entire workbook turns on, so it is worth noticing this early: the file treats a month as four weeks throughout, a planning convention rather than a calendar count.
Below income sits the Weekly Budget Allocation table, ten categories each with a weekly target. In the sample they read Housing & Utilities $300, Groceries & Food $130, Transportation $90, Health & Insurance $75, Dining Out $60, Entertainment $35, Shopping $70, Personal Care $20, Savings $220, and Other $50. Three columns are computed from each weekly figure. Monthly Total multiplies it by four, so Housing & Utilities shows $1,200 and Groceries & Food shows $520. The % of Weekly column divides the target by weekly income, putting Housing & Utilities at 25.0 percent, Savings at 18.3 percent, and Personal Care at 1.7 percent. A Weekly Target column mirrors the weekly budget, and it is the value the Week 1-4 tracker pulls in later.
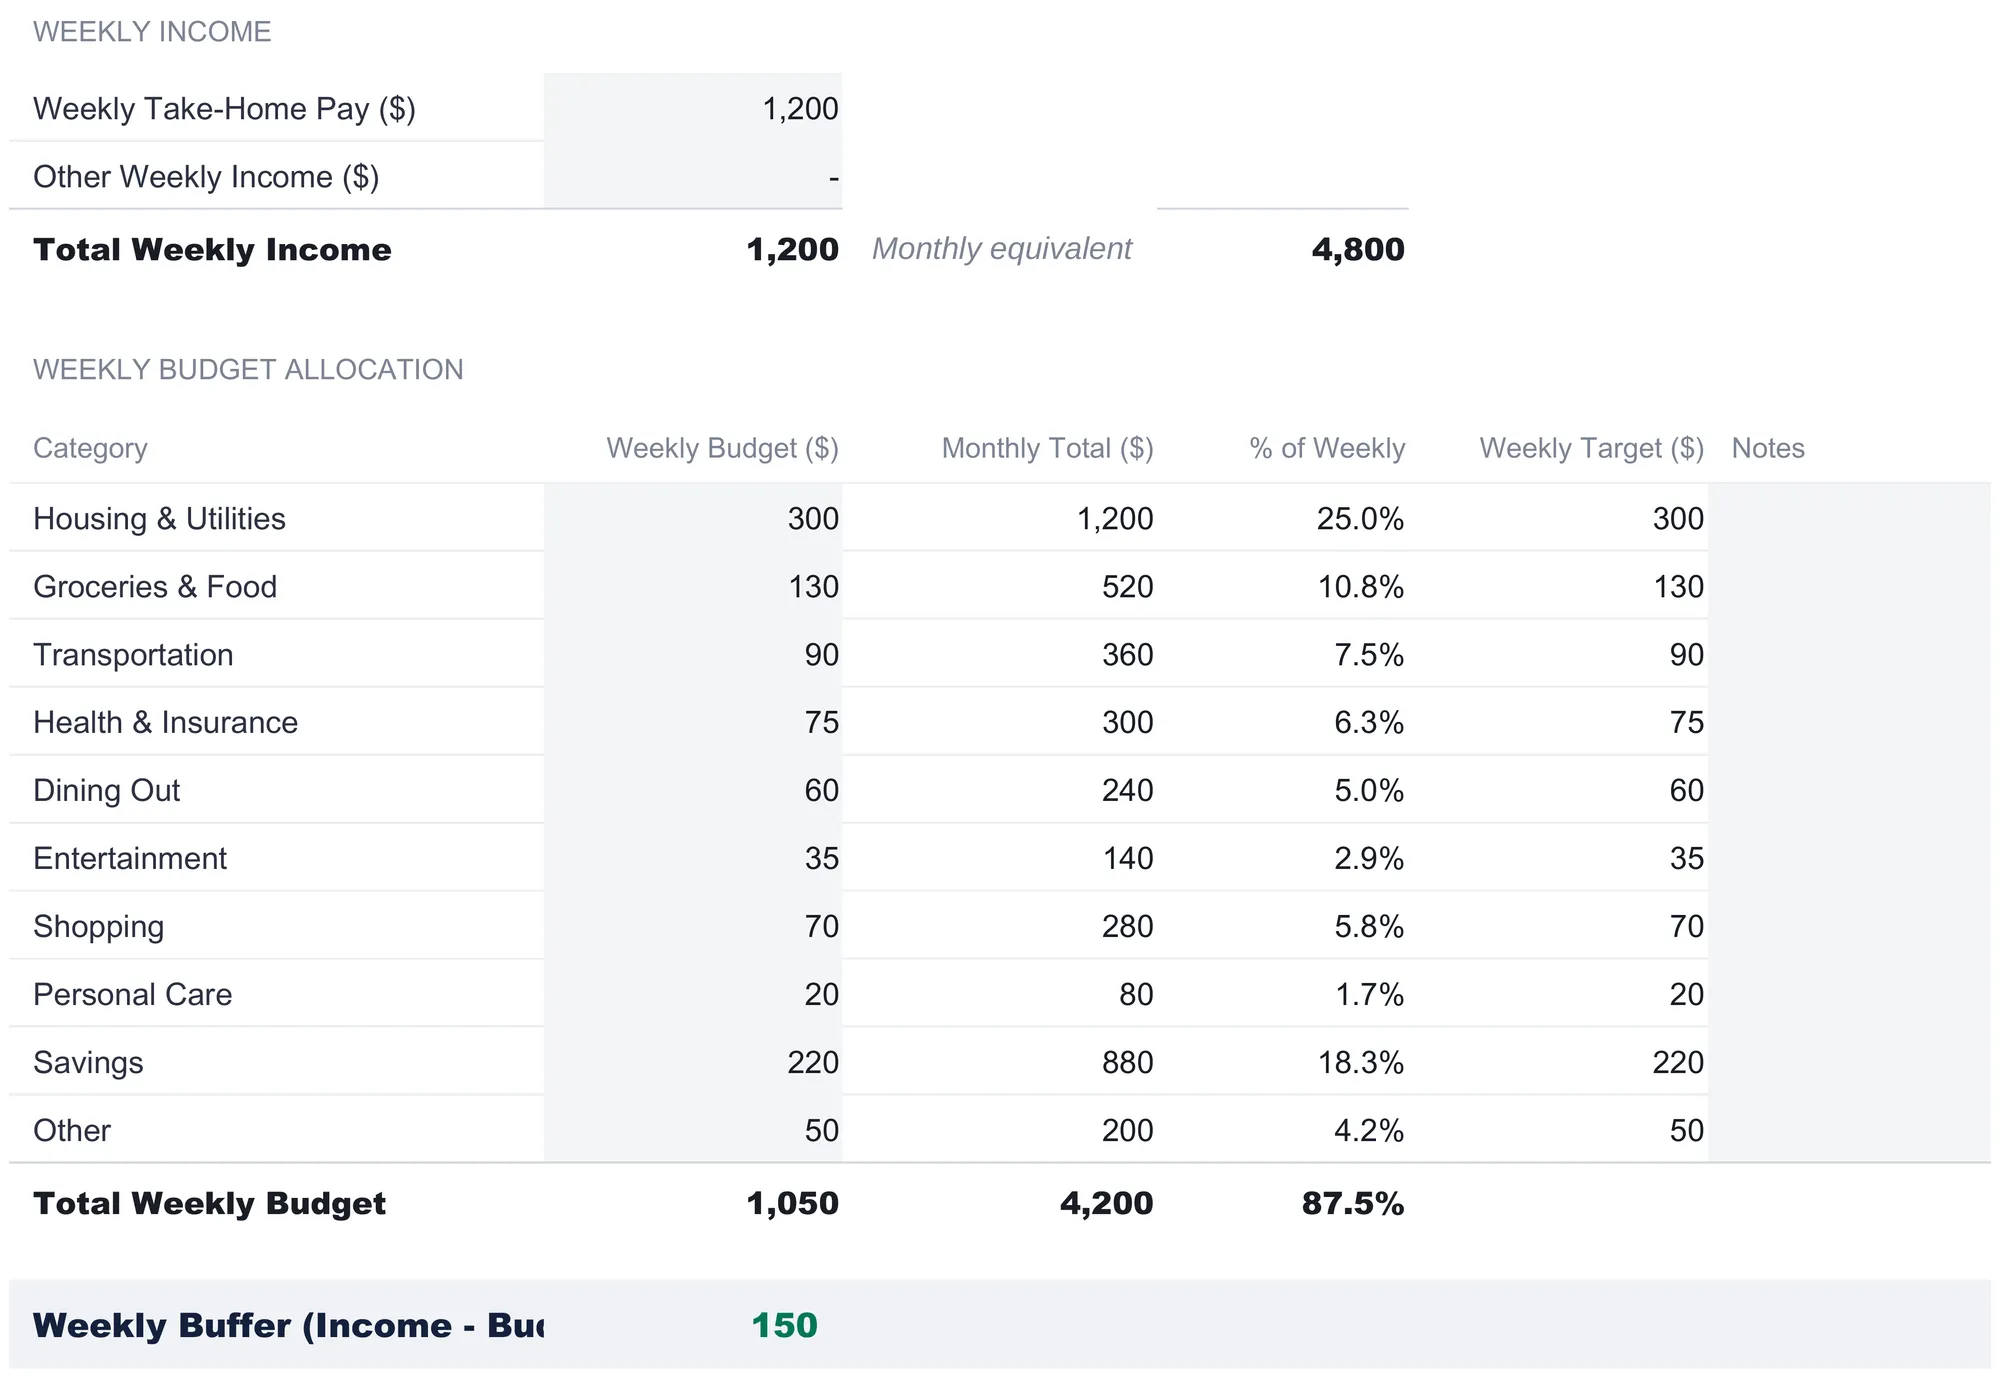
Two totals close the sheet, and they are the numbers the dashboard leads with. Total Weekly Budget sums the ten targets to $1,050, its Monthly Total column reads $4,200, and its share of income comes to 87.5 percent, which the dashboard rounds to 88 percent. Below that, the Weekly Buffer line subtracts the budget from income, $1,200 minus $1,050, and lands at $150. That buffer is the part of each week’s income the plan has not assigned to any category. The workbook computes it and shows it; it does not tell you what the buffer is for or where it should go. Those ten targets, the income figure, and the category names are the editable inputs a household would change to fit its own situation. Everything past this sheet is arithmetic on them.
Track the four weeks: the Week 1-4 Budget sheet
The Week 1-4 Budget sheet is where planning meets reality. It stacks four identical sections, one per week, and each carries the same ten categories with five columns: Weekly Budget, Actual Spent, Difference, Status, and Notes. The Weekly Budget column is not typed here; each cell reads the matching Weekly Target from the setup sheet, so all four weeks start from the same $1,050 plan. The Actual Spent column is yours to fill in, and the Difference column subtracts actual from budget. The Status column runs a plain test: if the budget is at least the actual, it reads On Track, otherwise Over.
Week 1 in the sample shows how the sheet reports a mixed week. Housing & Utilities was budgeted $300 and spent $95, leaving $205 On Track, because only a couple of bills fell in that week. Groceries & Food came in at $128.20 against $130, Transportation at $45 against $90, and Savings landed exactly on its $220 target. One category tipped over: Dining Out was budgeted $60 and spent $71.75, which the sheet flags Over in red. Money is shown rounded to whole dollars throughout the workbook, so that difference of $11.75 over reads as -12 on screen. The Week 1 Total row sums the column to a $1,050 budget against $599.94 actual, a difference of $450.06, and because the total budget still exceeds the total spent, the week reads On Track overall.
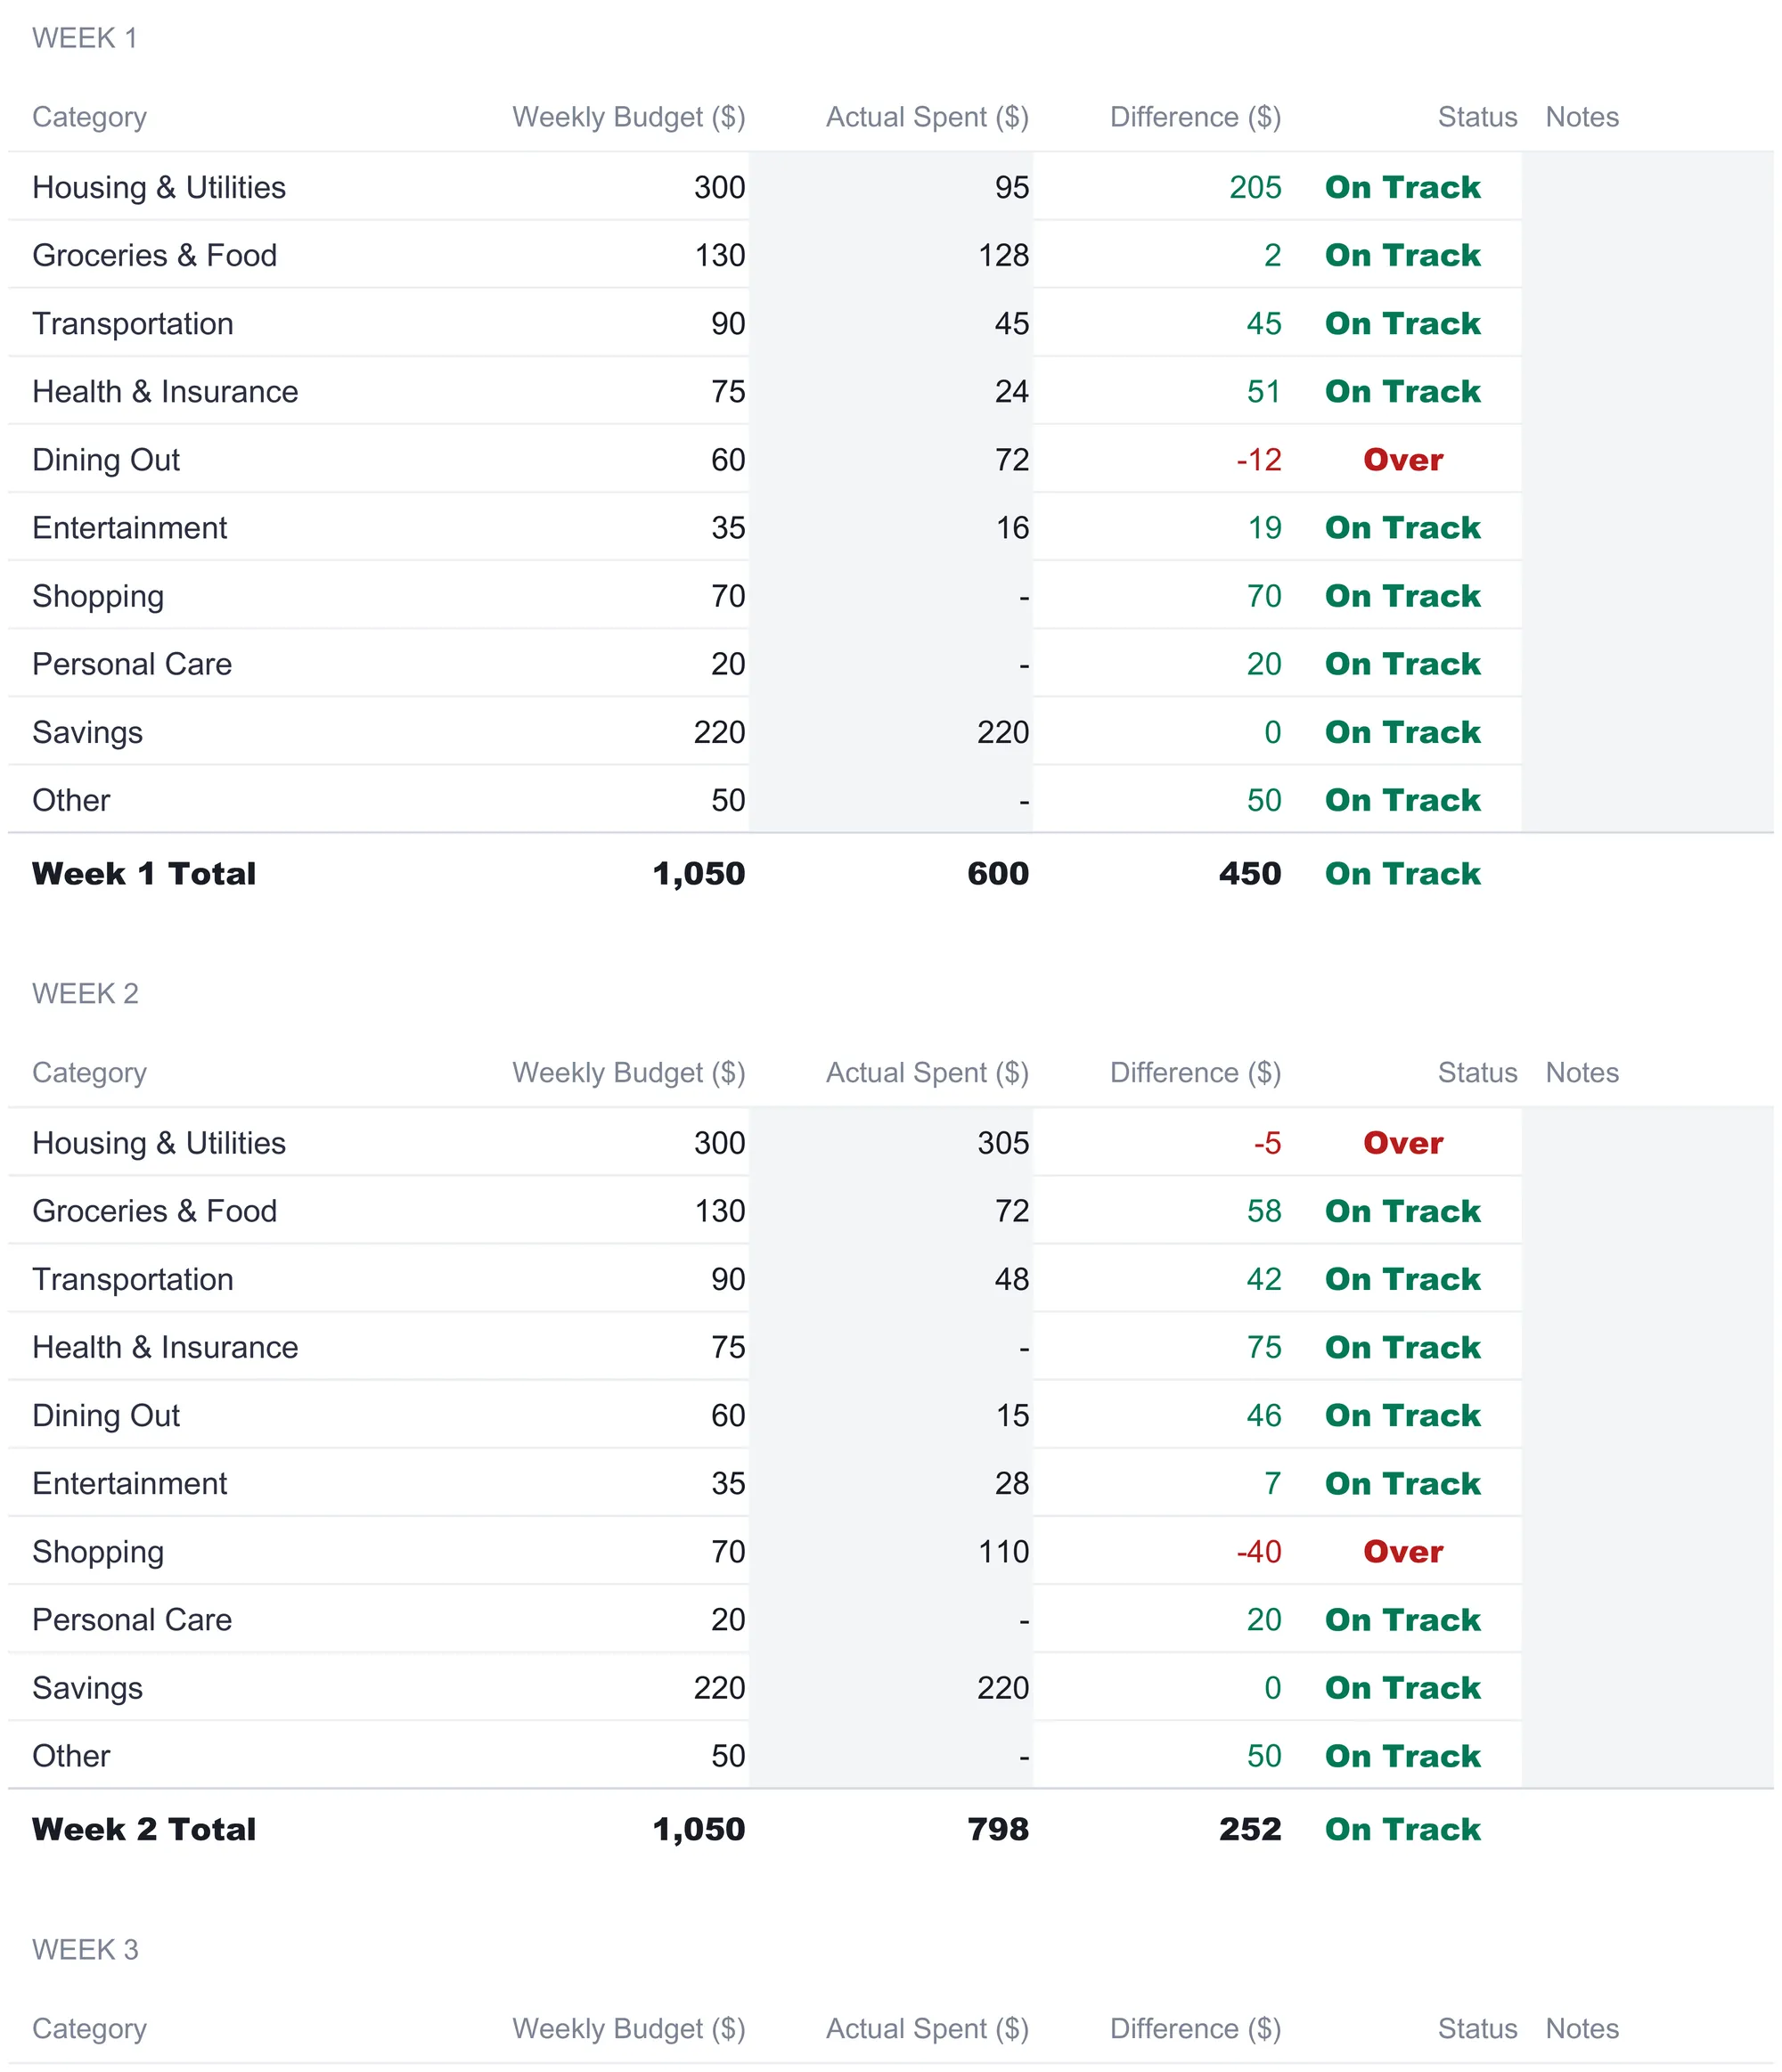
The four weeks are deliberately uneven, which is the whole reason for splitting the month. Week 2 totals $797.90, its heaviest, with Housing & Utilities at $305 just over its $300 target and Shopping at $110 against $70, both flagged Over even though the week as a whole stays On Track. Week 3 comes in lightest at $576.50, with only Entertainment over after a $42 concert against a $35 target. Week 4 totals $651, with Groceries, Shopping, and Other each a few dollars past their lines. A monthly budget would have reported one average; the weekly view shows a quiet week, a heavy week, and two in between, along with exactly which categories drove each.
A Monthly Summary block sits at the foot of the same sheet and ties the four weeks together in three cells. Total Monthly Spending reads its budget as the four weekly budgets added, $4,200, and its actual as the four weekly actuals added, $2,625.34. The third cell subtracts that spending from monthly income, $4,800 minus $2,625.34, for $2,174.66 remaining. Nothing in this block is typed; it is a live read on the four weeks above it.
One design detail is worth copying into any hand-built version. The Actual Spent cells are the entry points, and the Week Total rows already sum them, so a change to any category updates the week total and the monthly block at the foot of the sheet at once. There is no formula to drag and no range to extend, which is the usual place a hand-built weekly budget quietly breaks. The Monthly Summary and the dashboard are wired to the Expense Log rather than to this tracker, so those move when a transaction is logged.
Log every transaction: the Expense Log
The Week 1-4 tracker holds one number per category per week. The Expense Log holds the purchases behind those numbers, one transaction to a row. Its columns are Date, Description, Category, Week number, Amount, and Notes, and the sheet ships with 100 rows pre-formatted so there is room to log a full month without touching the structure.
The sample fills 40 of those rows across August, from a $68.50 grocery run and a $45 gas station stop on August 2 through a $52 miscellaneous purchase on August 31. Reading down the log shows the texture a category total hides: four Weekly savings transfers of $220 each, one per week and all marked Automated in the Notes column; an Electric bill of $95, a $200 rent payment, a $60 phone bill, and a $45 internet bill all tagged Housing & Utilities; a $59.20 Costco run noted as a bulk trip. The Week number column, stamped 1, 2, 3, or 4 on every transaction, is what lets the log feed the dashboard’s budget-versus-actual-by-week chart, which totals the Amount column with SUMIFS on that number.
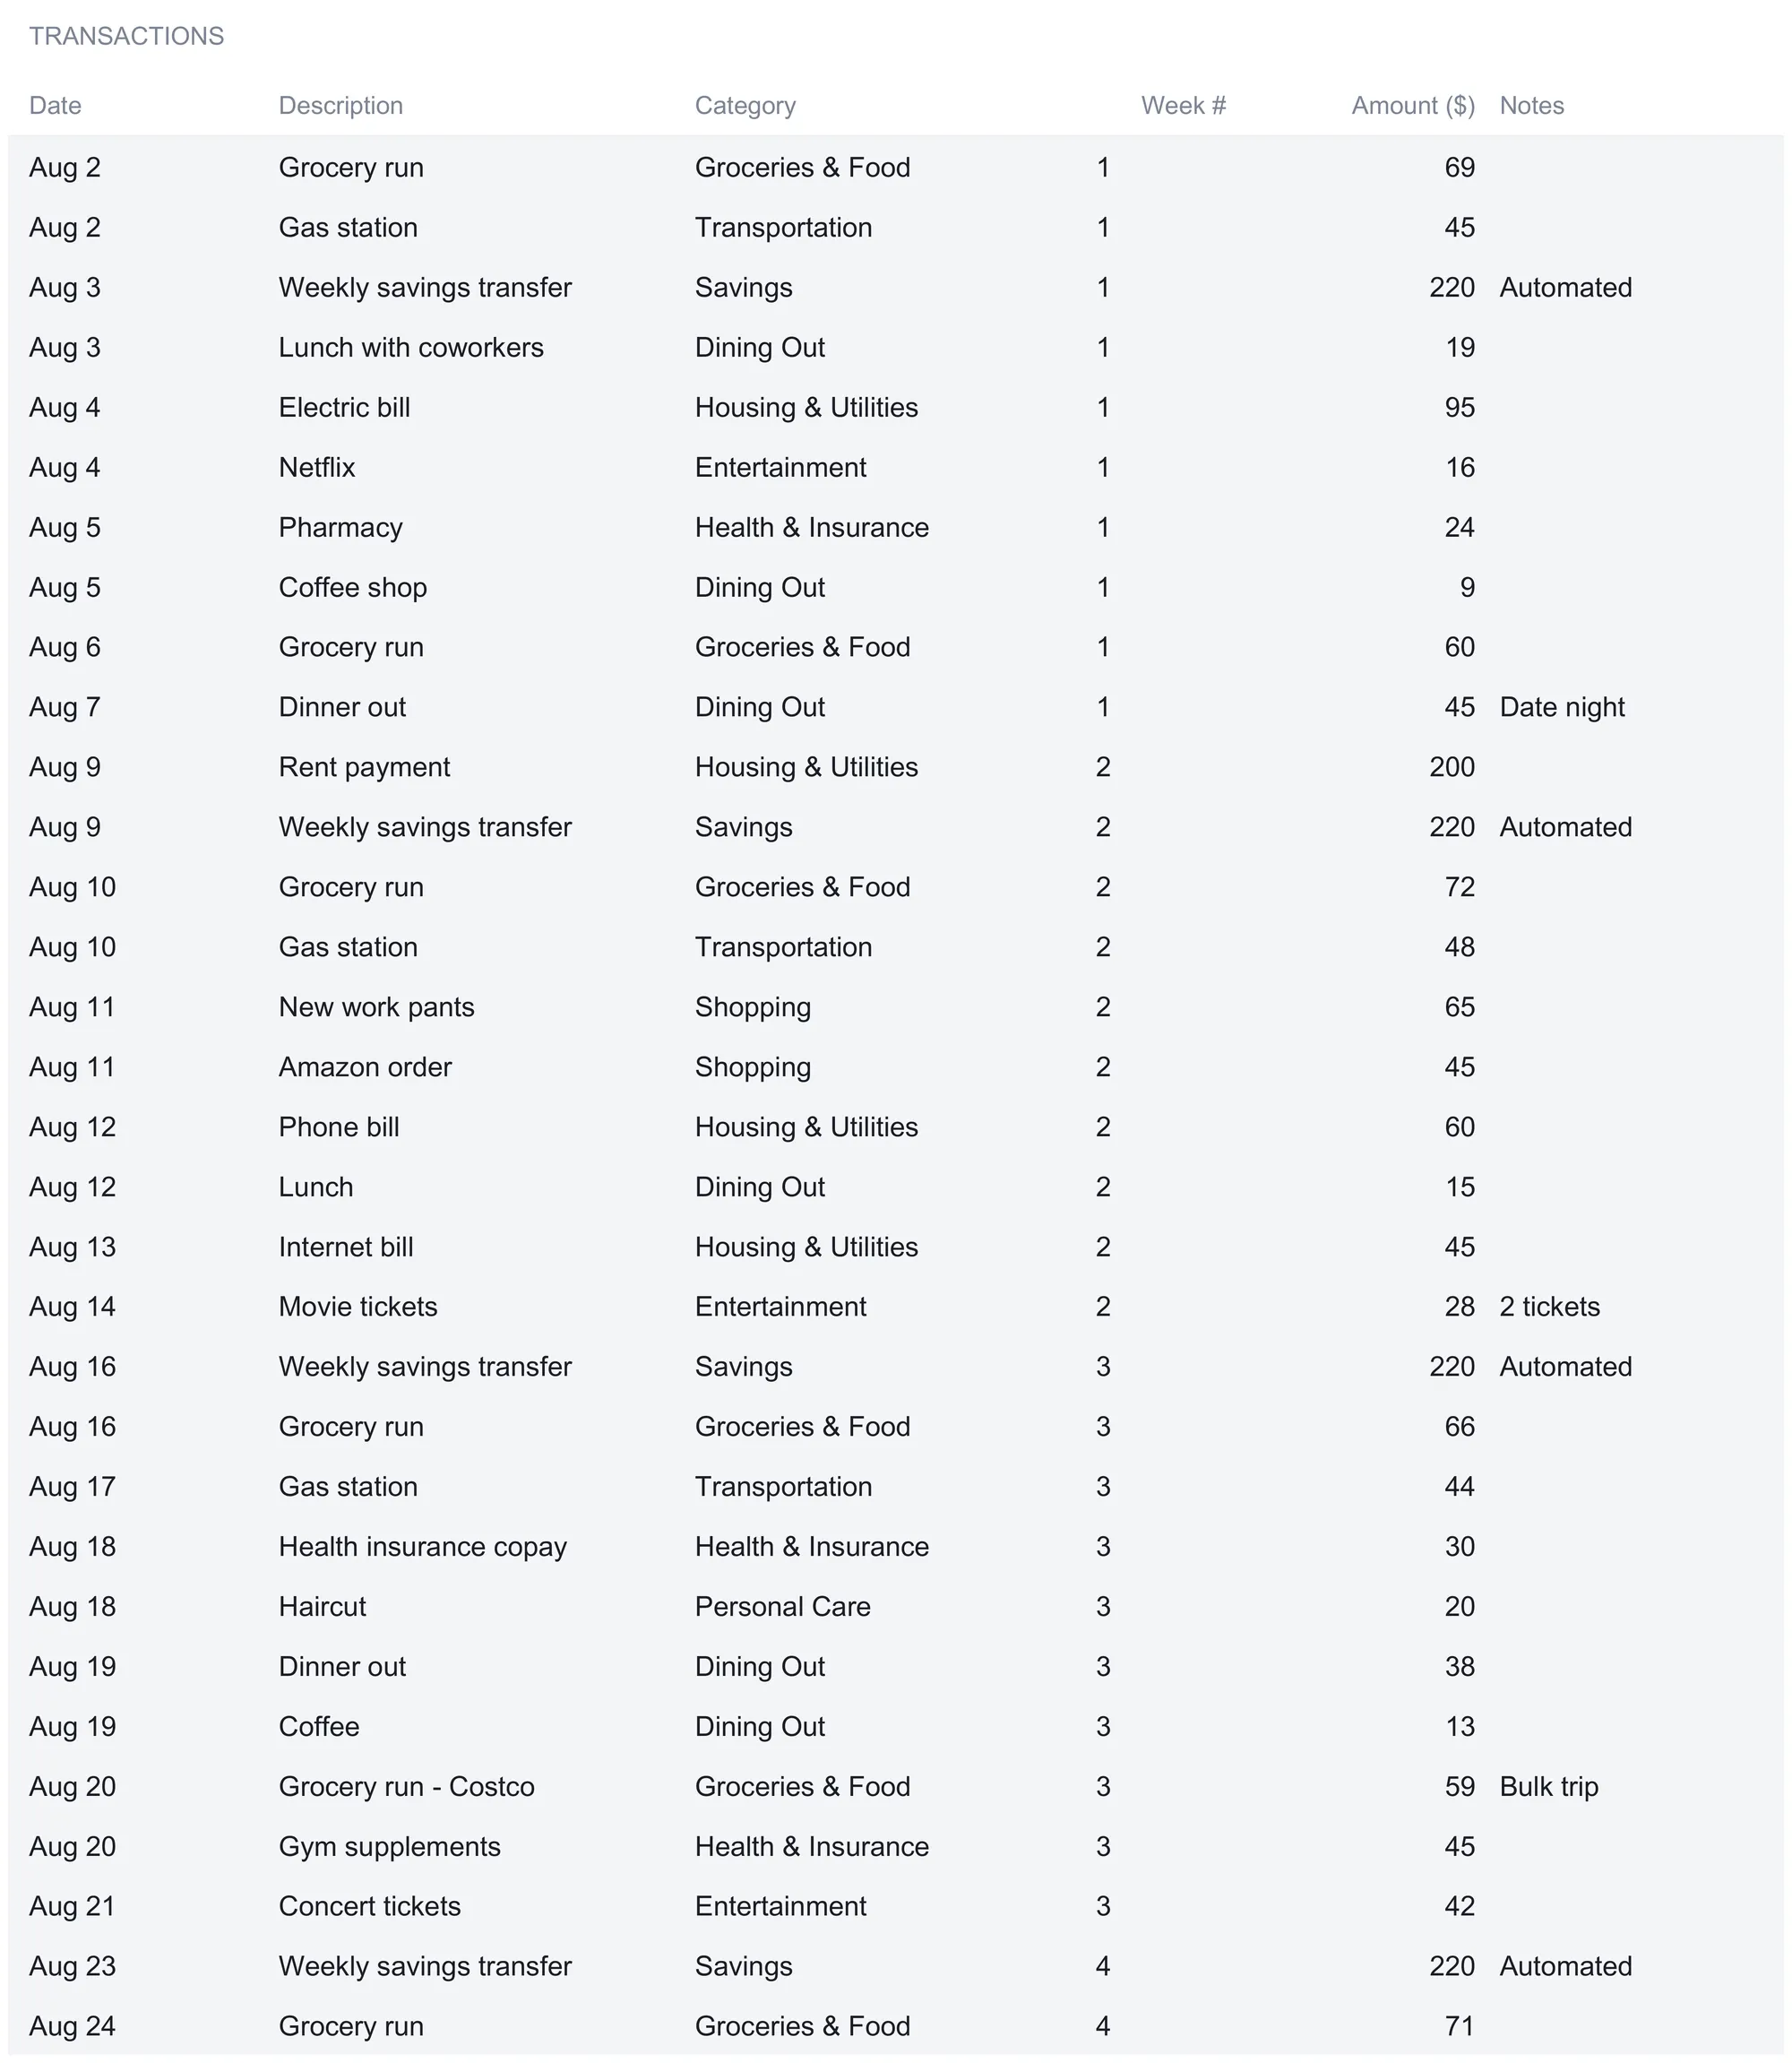
At the bottom of the log, a TOTAL row sums the Amount column to $2,625.34, the same figure the Week 1-4 block reported and the number the dashboard reads for monthly spending. This is the sheet the How to Use tab calls the detailed way to track. The alternative, typing weekly totals straight into the Week 1-4 sheet, is faster but leaves the log empty, and because the Monthly Summary and the dashboard’s monthly spending both total from the log rather than from the tracker, they stay at zero until transactions are entered here. The sample was built both ways at once, which is why the log’s week-1 rows add to the same $599.94 the tracker shows. Worth knowing before choosing a method: the two are not redundant so much as wired to different readouts.
Total by category: the Monthly Summary sheet
The Expense Log records transactions in the order they happen. The Monthly Summary sheet turns that stream into a category scorecard for the month, and every figure on it is computed. Each of the ten category rows carries a Monthly Budget, an Actual Spent, a Difference, and a Count. The Monthly Budget column reads each category’s weekly setup figure and multiplies by four, so Housing & Utilities shows $1,200 and Savings shows $880. The Actual Spent column runs a SUMIF across the Expense Log, adding every amount whose category matches that row’s label. The Count column does the same with COUNTIF, reporting how many transactions fell in each category.
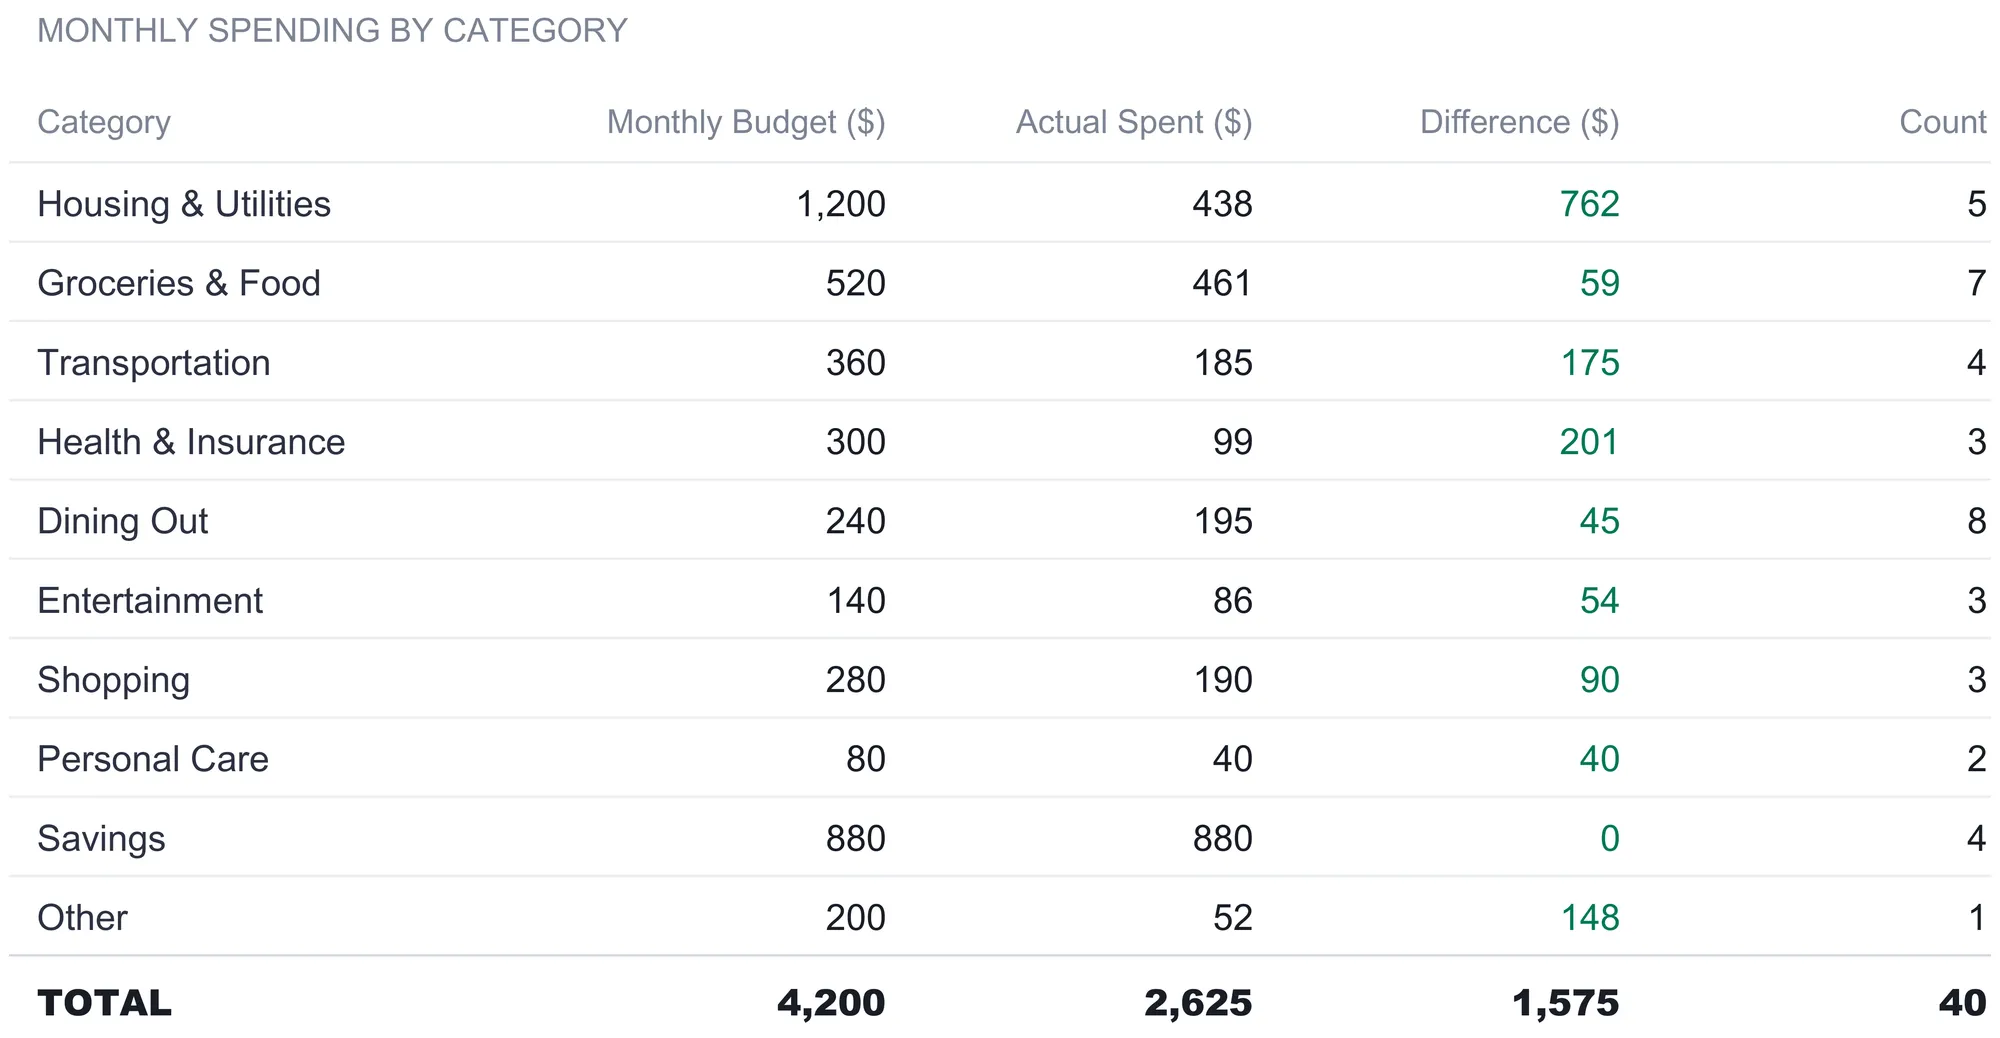
The sample month reads clearly once the columns are lined up. Housing & Utilities was budgeted $1,200 and spent $438 across 5 transactions, so its difference is $762 under. Groceries & Food spent $460.60 against $520 across 7 transactions, Dining Out $194.75 against $240 across 8 transactions (the most frequent category), and Savings landed exactly on its $880 target across 4 transfers. The TOTAL row sums the sheet to a $4,200 budget, $2,625.34 actual, a $1,574.66 difference, and 40 transactions in all. The Count column is the detail a weekly tracker alone would not surface. Eight dining-out transactions against three shopping ones says something about where the small, frequent spending lives, without prescribing anything about it. Because the totals key on the category text, this sheet is also the one that fixes how categories must be named: a label here has to match what the log carries, or the SUMIF finds nothing to add.
See the whole year: the 52-Week Overview
The first five sheets describe a single month in detail. The 52-Week Overview zooms out to the year. It lays the ten categories down the left and the twelve months across the top, with an Annual Total column on the right, and treats each month as one column of four weekly budgets combined. Unlike the Monthly Summary, these monthly figures are entered as each month closes rather than pulled from the log, which is why they vary slightly from month to month instead of repeating one number.
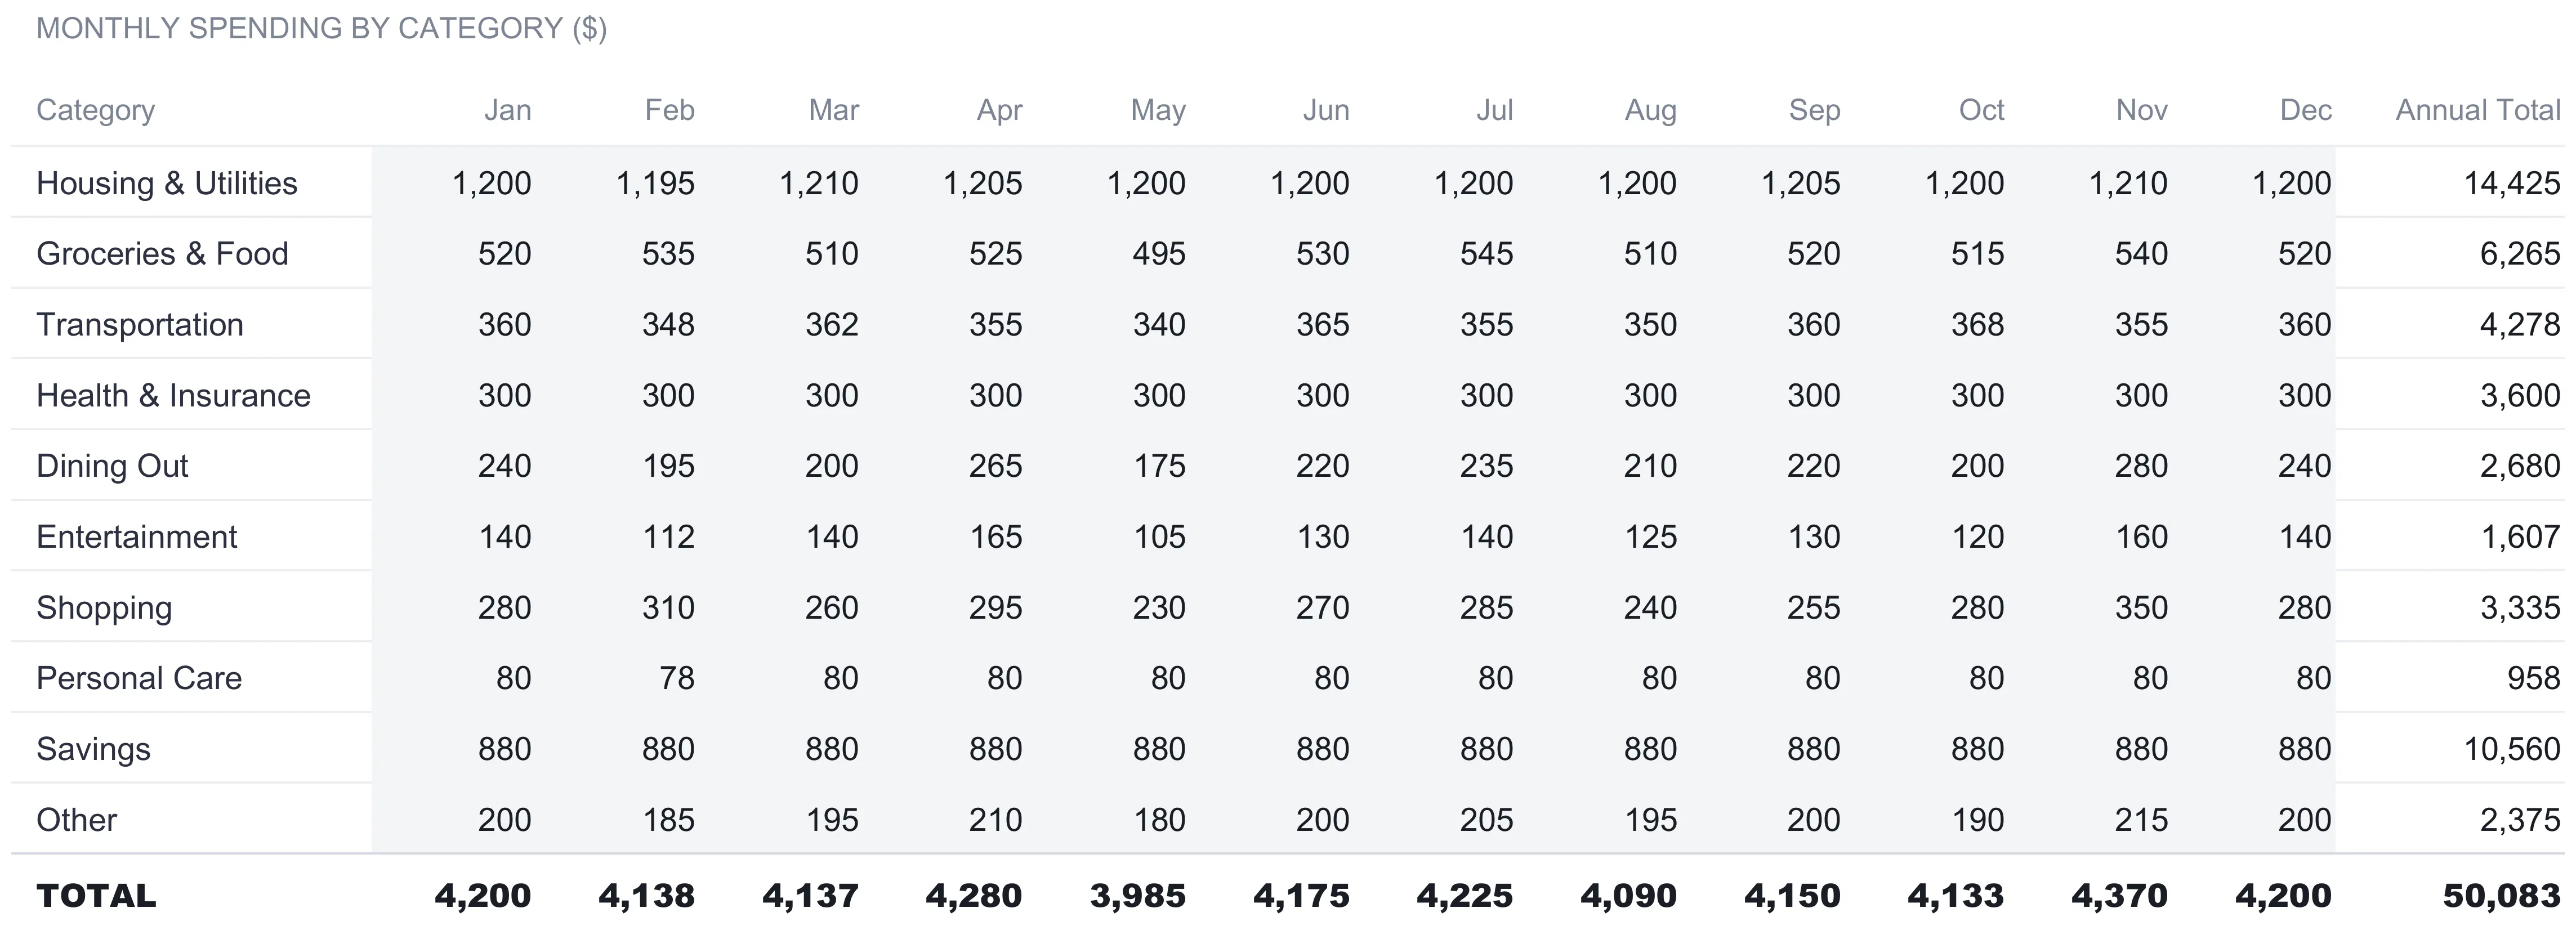
The sample year makes the seasonality visible. The monthly TOTAL row runs from a low of $3,985 in May to a high of $4,370 in November, with most months clustered near the $4,200 plan. Reading across a single row shows where the swing comes from: Shopping climbs to $350 in November against a $230 low in May, and Dining Out ranges from $175 in May to $280 in November, while Health & Insurance holds flat at $300 every month and Savings holds at $880. The Annual Total column adds each row across the year, reaching $14,425 for Housing & Utilities, $10,560 for Savings, $6,265 for Groceries & Food, and $50,083 for the year as a whole. That yearly figure is the one number none of the monthly sheets can show, and it is where a category that drifts a little each month finally adds up to something you can see.
The dashboard: six numbers and two charts
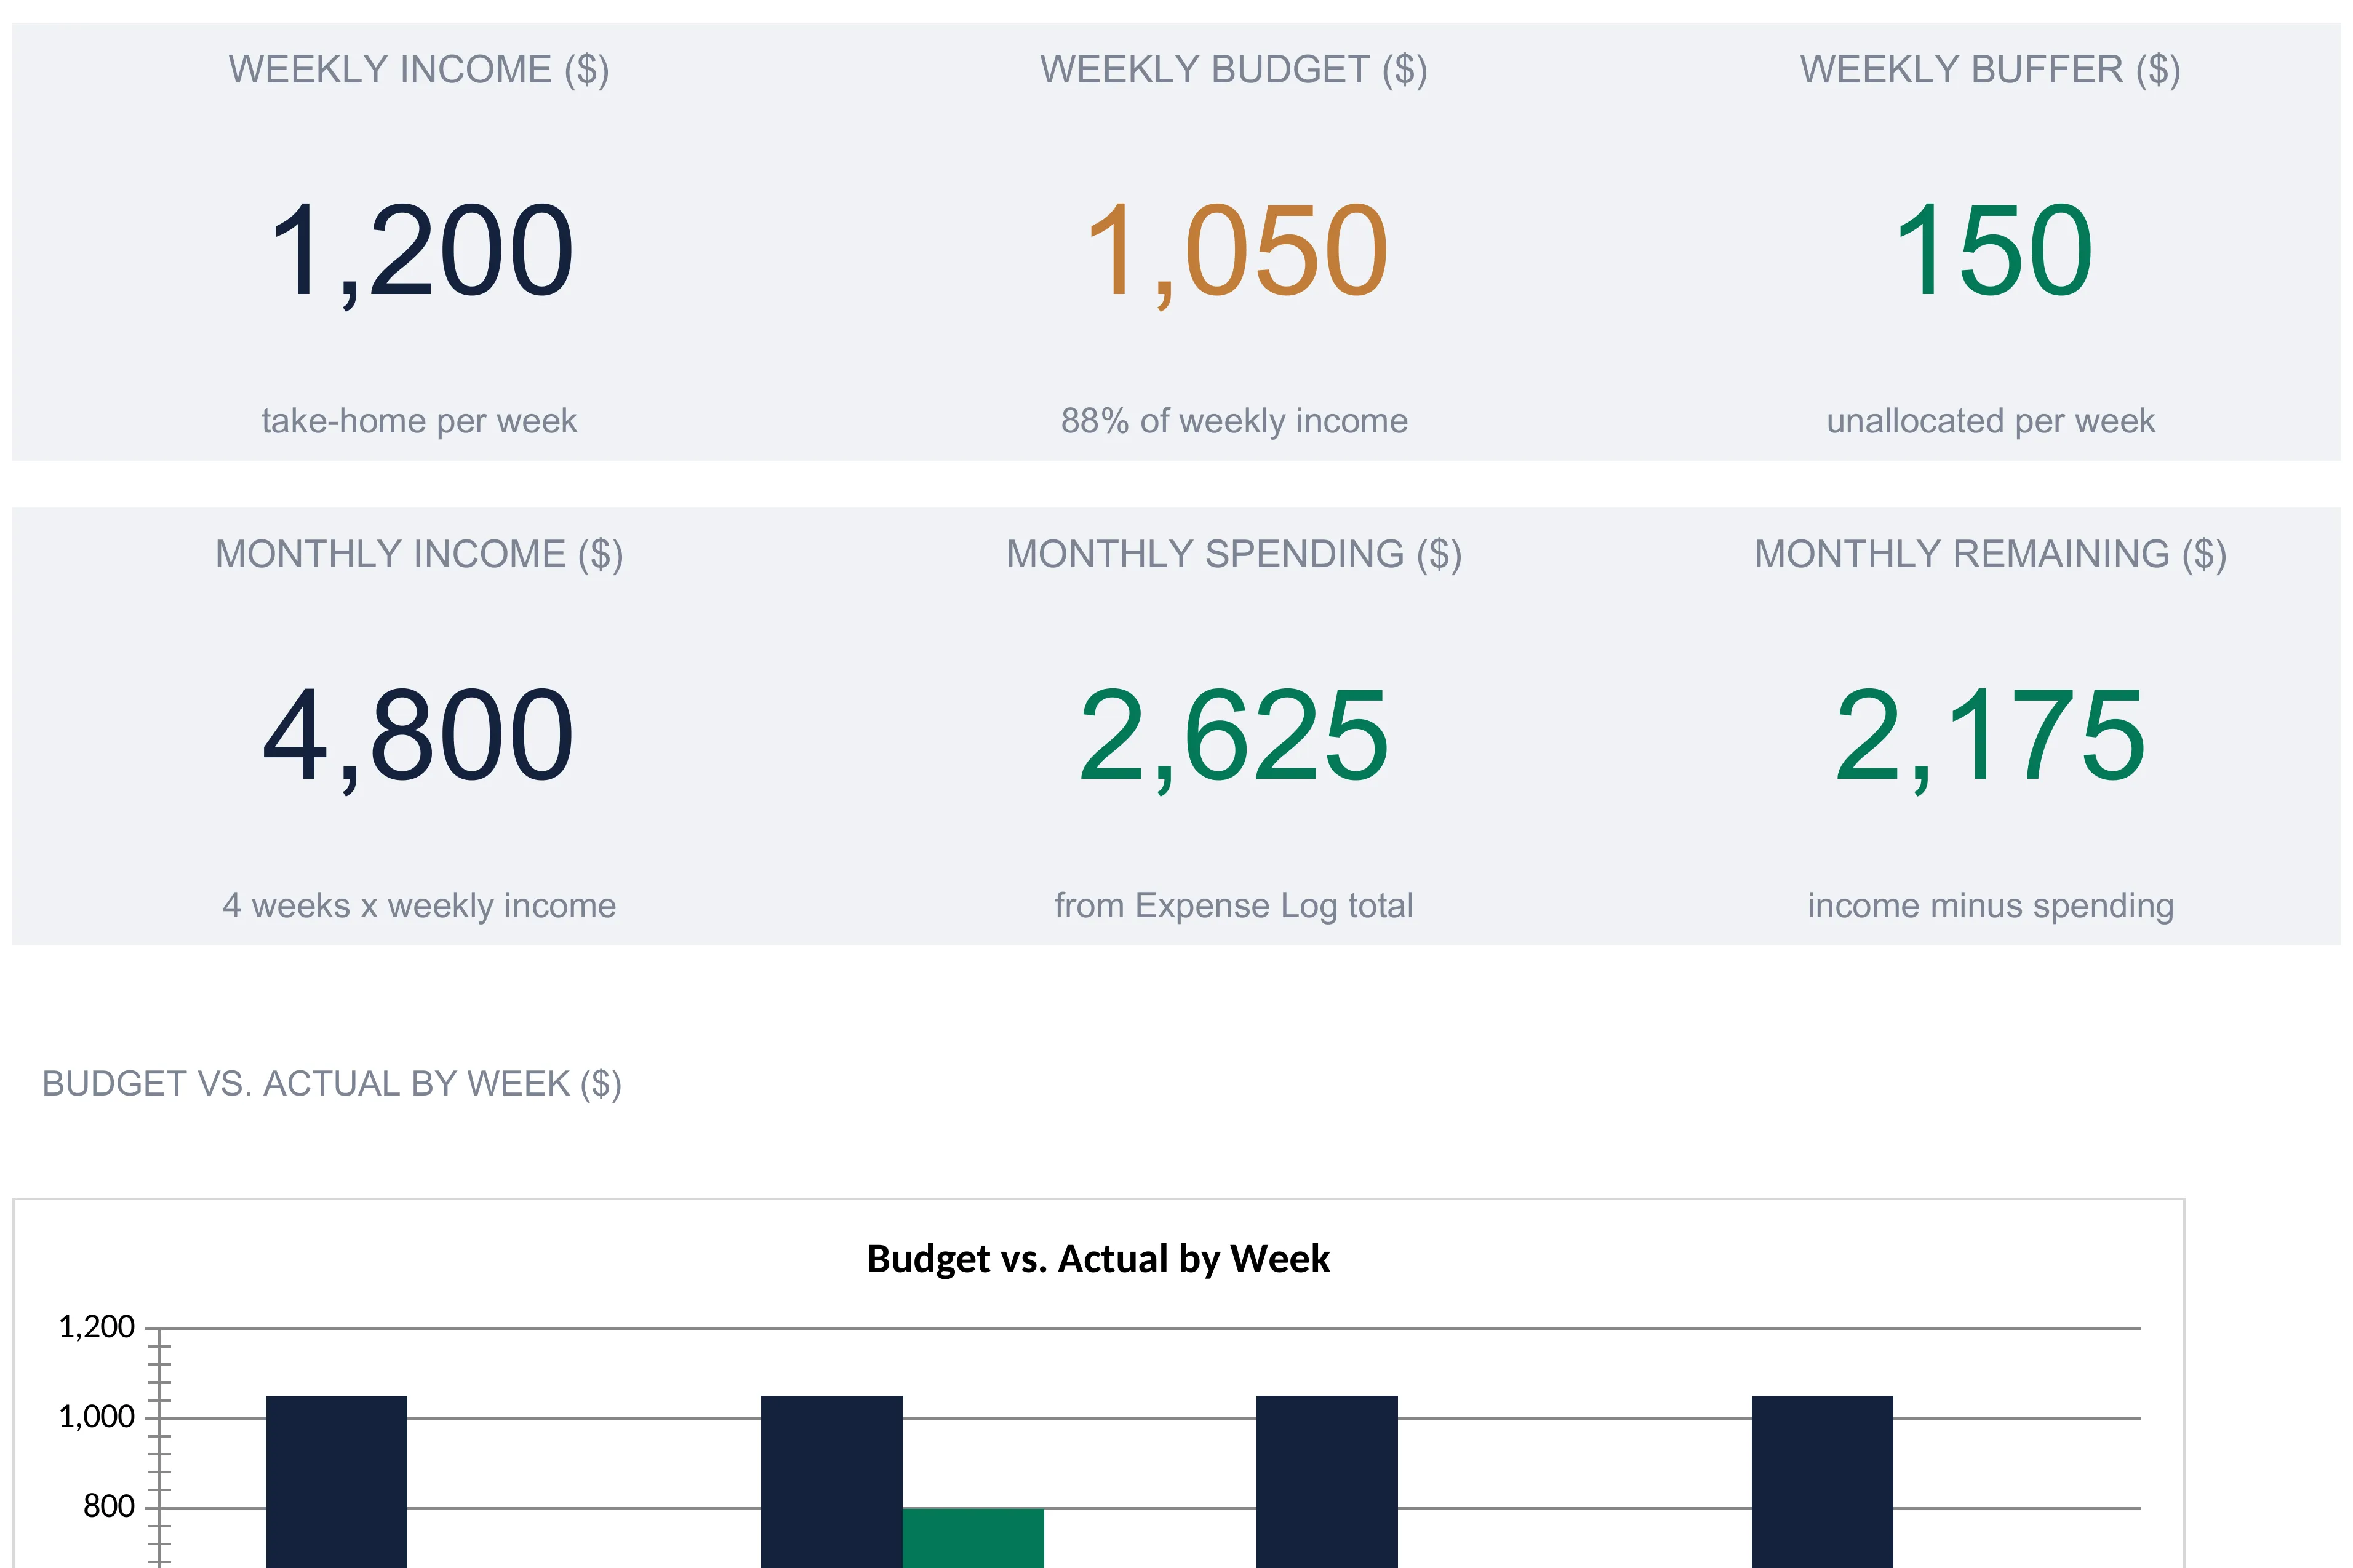
The Dashboard sits on top of the file and invents nothing. It reads the sheets below and presents them as six KPI tiles and two charts, shown in the cover image above. Each tile carries a one-line description beneath its number, so the sheet reads without a manual.
The top row of tiles covers the week. Weekly Income is $1,200, the take-home figure from setup. Weekly Budget is $1,050, labeled as 88 percent of weekly income. Weekly Buffer is $150, the unallocated remainder. The second row scales those to the month: Monthly Income is $4,800, described as four weeks times weekly income; Monthly Spending is $2,625, drawn from the Expense Log total; and Monthly Remaining is $2,175, income minus spending. The monthly spending and remaining tiles round the log’s $2,625.34 and the $2,174.66 remainder to whole dollars for display, but they are the same figures the sheets below carry.
Two charts sit under the tiles. Budget vs. Actual by Week is a clustered column chart that pairs a flat $1,050 budget bar for each week with a second bar for that week’s actual, totaled from the Expense Log by week number, so the sample’s $599.94, $797.90, $576.50, and $651 read as four bars of visibly different heights beside four identical ones. Monthly Spending by Category is a pie chart fed by the ten Monthly Summary totals in order, largest first, so Savings at $880 leads, followed by Groceries & Food at $460.60 and Housing & Utilities at $438, down to Personal Care at $40. Those ten add back to the same $2,625.34, so the chart is a second angle on the month’s spending rather than a new number.
A currency control sits beside the dashboard title. Choosing from its dropdown relabels every money column header and KPI across the workbook to any of more than thirty symbols, from dollars and euros to rupees, złoty, and dirham. As the How to Use sheet notes, this changes only the label shown and does not convert the underlying numbers, so the figures stay exactly as entered while the sign in front of them changes.
Buffer, difference, and “on track” in plain terms
Three ideas do most of the work in this workbook, and none is complicated once the labels are unpacked.
The buffer is weekly income minus the weekly budget, $1,200 minus $1,050, or $150 in the sample. It is the slice of each week’s income the plan has not assigned to a category. A larger set of targets would shrink it, and targets adding up past income would drive it negative, which the sheet would show plainly rather than prevent.
The difference is budget minus actual, and it appears on both the weekly tracker and the monthly summary. A positive difference means spending came in under the target, which the sheet colors green; a negative one means it went over, colored red. On the Week 1-4 sheet, Dining Out’s $60 target against $71.75 spent shows as a negative difference; on the Monthly Summary, Housing & Utilities’ $1,200 against $438 shows as $762 under. The sign is the entire message.
On Track and Over are the Status labels, and they read the same difference at the level of a whole row or a whole week. The formula asks whether the budget is at least the actual: if it is, the row reads On Track; if not, it reads Over on a category row and Over Budget on a week total. It is a threshold, not a judgment. A category can read Over by a dollar or by a hundred, and the label looks the same, so the number beside it is what carries the weight. The workbook’s job is to compute these three and put them on the screen; what to make of a week that ran heavy is left to the person reading it. That neutral framing is the same one the CFPB describes as the core of any budget: identify what comes in, note what goes out, and put the two together in one place so you can see them clearly.
Excel or Google Sheets for a weekly budget
The template is a plain .xlsx file built on standard functions. The How to Use sheet is explicit that there are no macros, no VBA, and no array formulas, so it behaves the same in Microsoft Excel 2016 and later, in Google Sheets after an upload, and in LibreOffice Calc. The cross-sheet references use the standard tab names, which is why that sheet asks you not to rename the tabs; the SUMIF on the Monthly Summary and the per-week pulls on the tracker all reach across sheets by name. Google Sheets suits anyone who wants to add a transaction from a phone as it happens, since the Expense Log is just a running list; Excel suits those who prefer a local file. The structure described here is equally buildable by hand in either program, and the workbook’s value is in having the four weeks, the log, the rollup, and the year already wired together so a single entry updates all of them.
Which weekly budget fits
- Weekly Budget Ultimate Spreadsheet Template ($29) is the workbook this walkthrough follows: the Weekly Setup inputs, the four-week tracker, the transaction-level Expense Log, the SUMIF-driven Monthly Summary, the twelve-month 52-Week Overview, and the six-tile dashboard, ready to use in Excel or Google Sheets. The same template comes in a free version with a single weekly-budget sheet for anyone who wants to try the method first, and an Essentials version ($19) that sits between the free sheet and the full workbook.
- Paycheck Budget Ultimate Spreadsheet Template ($29) organizes the same pay-period thinking around the checks you receive rather than the weeks of the month, assigning each bill to a specific paycheck and tracking the two extra checks a bi-weekly year produces. It suits people whose bills line up with paydays more naturally than with calendar weeks, and our walkthrough of budgeting by paycheck builds that workbook sheet by sheet the same way this one does.
Whichever version fits, the habit underneath is the one the CFPB frames as the whole of a budget: know what comes in, know what goes out, and keep them side by side. Doing that a week at a time, rather than waiting for the month to close, is the only thing a weekly budget changes.
Related
- How to Budget by Paycheck in a Spreadsheet - the same pay-period idea organized around each paycheck instead of each week
- Bi-Weekly Budgeting: How to Create a Budget Based on Paychecks - the concept behind aligning bills with the money that arrives before they are due
Frequently asked questions
How is a weekly budget different from a monthly budget?
A monthly budget compares one income figure against one pile of spending for the whole month, so you learn whether you overspent only when the month closes. A weekly budget divides that same month into four weekly buckets per category and checks each week on its own. In the sample workbook the monthly budget of $4,200 is just the weekly budget of $1,050 multiplied by four, but the four weeks came in at $599.94, $797.90, $576.50, and $651, which a single monthly total would blur into one number. The point is timing: a week has a clear start and end, so an overspend shows up within days instead of at month-end.
Do I have to use both the Expense Log and the Week 1-4 tracker?
No, and the How to Use sheet spells out the trade. The detailed way is to log every purchase in the Expense Log; the Monthly Summary and the dashboard's monthly spending total from those rows with SUMIF. The summary way is to type weekly category totals straight into the Week 1-4 Budget sheet, which is faster but leaves the Monthly Summary and the dashboard's monthly figure at zero, because those read only from the Expense Log. In the sample both were filled in consistently, which is why the Week 1 actual of $599.94 matches the log's week-1 rows. Mixing the two also works, logging some categories and typing others.
Does the workbook assume every month is exactly four weeks?
Yes. Every monthly figure in the file is the weekly number times four: monthly income is $4,800 from $1,200 a week, the monthly budget is $4,200 from $1,050, and each category's Monthly Total column is its weekly budget times four. A calendar year runs about 4.33 weeks a month, so the four-week model is a planning convention rather than a calendar count. The 52-Week Overview is where the full twelve months are tracked separately, and its annual total of $50,083 reflects the real month-to-month variation rather than twelve identical copies of one month.
Can I rename or change the ten budget categories?
The categories are plain text labels, so they can be renamed. The mechanism to know about is the Monthly Summary, which totals the Expense Log using SUMIF keyed on each row's category label. A category only totals correctly when the text you type in the Expense Log's Category column matches the label on the Monthly Summary row exactly. The Expense Log offers a category dropdown to keep those entries consistent, and its list is fixed in that sheet's data validation rather than read from the setup sheet. Renaming a category therefore means changing the label on every sheet that carries it and editing that validation list too, not just fixing one spot.
Is this only useful for people paid weekly?
No. The How to Use sheet describes it as useful for anyone paid weekly or bi-weekly, and for anyone who prefers tighter check-ins than a monthly review. The income input is a weekly take-home figure, $1,200 in the sample, plus an optional Other Weekly Income line. Someone paid twice a month or monthly can still divide their spending plan into four weekly targets; the pay schedule sets how the money arrives, while the weekly buckets are about how the plan is checked.
Sources
- Budgeting: How to create a budget and stick with it - Consumer Financial Protection Bureau
About this article
Sheets, inputs, formulas, sample figures, conditional formatting, and both charts checked on 2026-09-10 against the shipped Weekly Budget Ultimate workbook (Dashboard, Weekly Setup, Week 1-4 Budget, Expense Log, Monthly Summary, 52-Week Overview, How to Use). The budgeting reference was checked against the live CFPB page at writing time. Last reviewed September 2026.