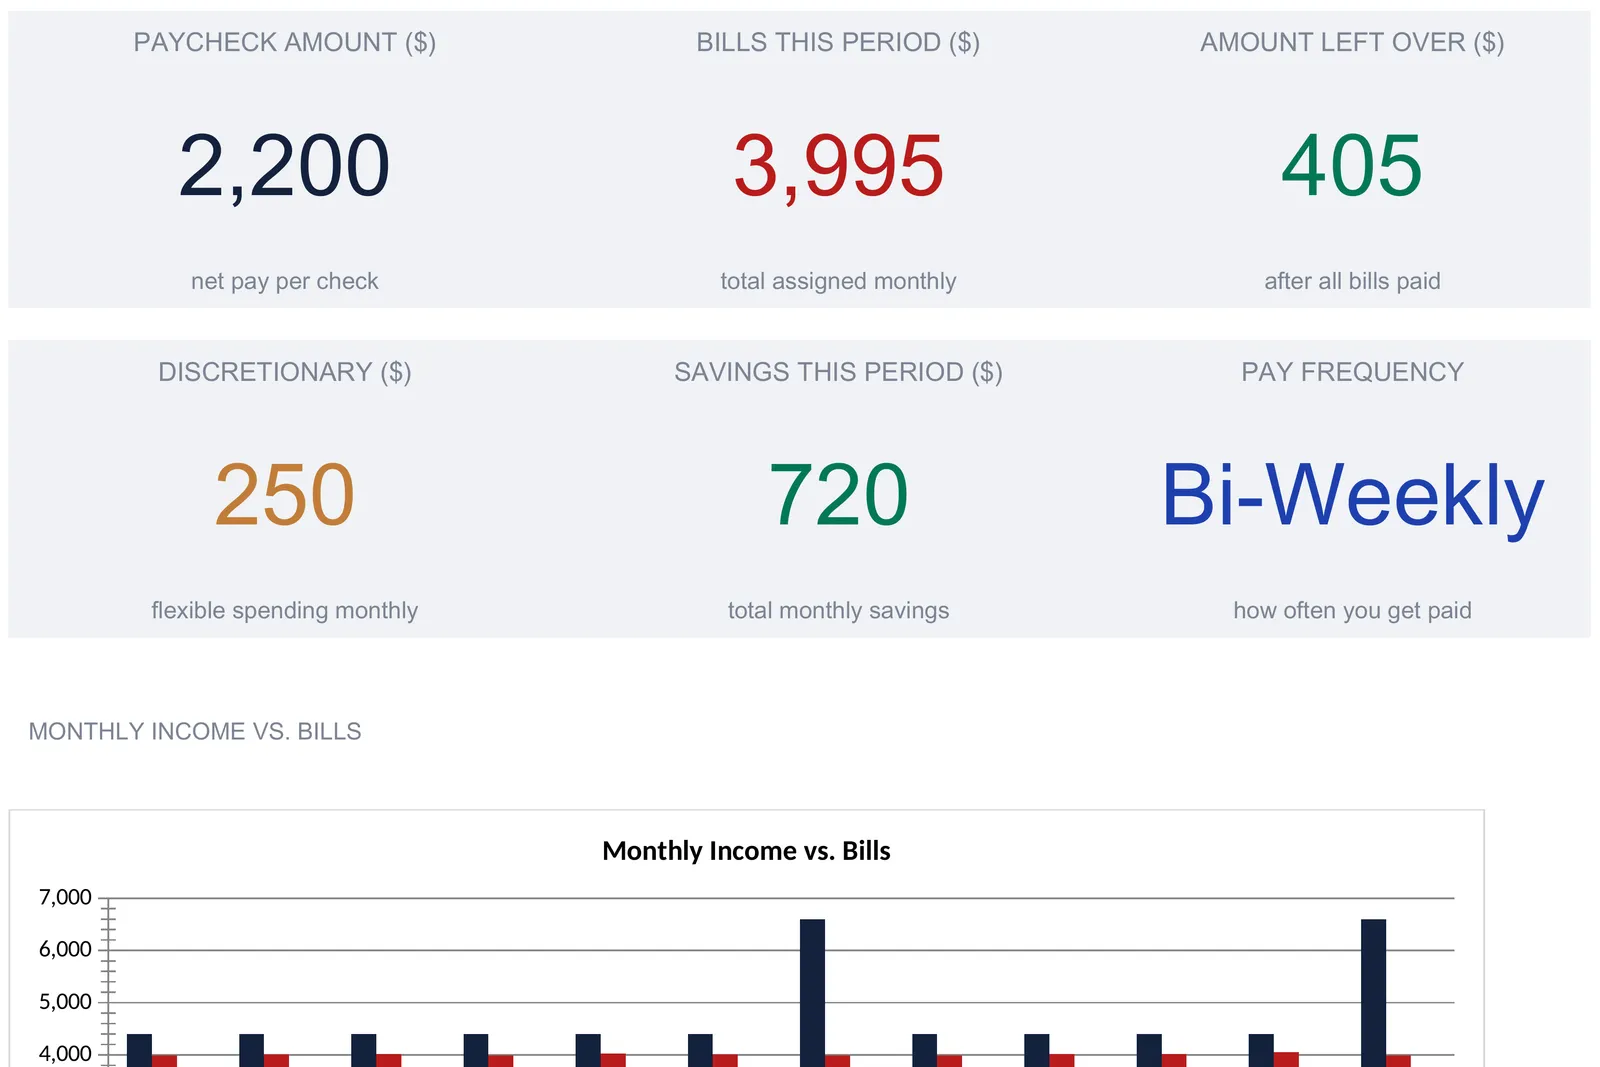
A paycheck budget assigns every bill to a specific check instead of to the month as a whole, so each paycheck's job is visible before it lands. This walkthrough builds the structure sheet by sheet from the workbook's own sample: bi-weekly pay of $2,200 a check, $3,995 in monthly bills split across two paychecks, $720 saved, and $405 left over, plus the two three-paycheck months bi-weekly pay produces. The Paycheck Budget Ultimate ($29) ships the whole thing ready for Excel and Google Sheets.
Most budgets are built around the month. One income number at the top, one column of bills underneath, and a total at the bottom that says whether the two balance. That works until the money arrives in pieces. If you are paid every two weeks, the rent that is due on the 1st and the car payment due on the 15th do not come out of the same paycheck. A monthly total says nothing about whether the check in your account right now covers what is due before the next one lands.
Budgeting by paycheck answers that narrower question. Instead of one monthly plan, you build a plan per check: this is what the first paycheck of the month has to cover, this is what the second one has to cover, and this is what is left in each case. The arithmetic is not complicated, but keeping it organized across two checks a month, twelve months a year, and the occasional third paycheck is exactly the kind of bookkeeping a spreadsheet is built for.
The walkthrough below follows our Paycheck Budget Ultimate Spreadsheet Template ($29), which ships the whole structure ready for Excel and Google Sheets. Every number here comes from the workbook’s own sample data, so you can match it cell for cell. The structure is reproducible by hand if you would rather build your own.
What “budgeting by paycheck” actually means
The idea has a longer history than the spreadsheet. The bi-weekly paycheck method is the concept version: line your bills up against the checks that arrive before they are due, and treat the two extra paychecks a bi-weekly schedule produces each year as their own event. Working out what actually reaches your account each payday, after taxes and deductions, is a separate exercise covered in our guide to take-home pay. This article is about neither the concept nor the tax math. It is about the workbook that turns the method into a set of linked sheets you fill in once and read all year.
Reduced to its parts, a paycheck budget holds only four kinds of information:
- Pay setup. How often you are paid, how much lands per check after tax, and how many checks a standard month contains. Three numbers, and everything downstream is built from them.
- Bills assigned to each check. A line per bill, with an amount, a due date, a category, and a status, sitting under the specific paycheck it comes out of.
- Combined and monthly rollups. The two checks added together, planned figures set against actual ones, and the same totals tracked across twelve months.
- The dashboard. Six headline numbers and two charts, all computed, that summarize the current pay period and the year.
The Paycheck Budget Ultimate gives each of these its own sheet. There are six working tabs (Pay Setup, Paycheck 1, Paycheck 2, Monthly Overview, Annual View, and a Dashboard on top) plus a How to Use sheet that carries the instructions. The How to Use sheet puts the filling order plainly: Pay Setup first, then Paycheck 1, then Paycheck 2, with the Dashboard, Monthly Overview and Annual View recalculating from what you enter. The walkthrough follows that path.
Start with the three inputs: the Pay Setup sheet
Everything the workbook calculates traces back to three cells on Pay Setup, which is why it comes first. The instruction line at the top spells out the convention the whole file follows: the tinted cells are the ones you fill in, and every other sheet updates on its own.
Pay Frequency. A cell you type into, with a note alongside it listing the four options the workbook is written around: Weekly, Bi-Weekly, Semi-Monthly, or Monthly. The sample is set to Bi-Weekly. This is the label that appears on the dashboard and sets the context for the three-paycheck tracking later on.
Net Pay Per Check. The after-tax take-home amount for one paycheck, $2,200 in the sample. The cell note is explicit that this is take-home pay, not gross salary, so the entire workbook reasons in the dollars that actually reach your account.
Number of Checks Per Month. How many pay dates fall in a standard month, set to 2 here. It is the multiplier behind the two income totals directly below it, so it sets the monthly figure the rest of the file works from just as much as the pay amount does.
From those three inputs the Monthly Income Summary computes the rest. Total Monthly Income is net pay times checks per month, $2,200 x 2 = $4,400. Two annual figures sit below it and are worth reading together, because they are not the same number. Annual Income (Standard Months) multiplies the monthly figure by twelve, $2,200 x 2 x 12 = $52,800, and its note says plainly that it excludes bonus paychecks. Annual Income (Bi-Weekly = 26 checks) instead multiplies the check by 26, $2,200 x 26 = $57,200. The $4,400 gap between them is the two extra paychecks a bi-weekly year contains, and seeing both numbers side by side is the first place the workbook makes that distinction concrete.
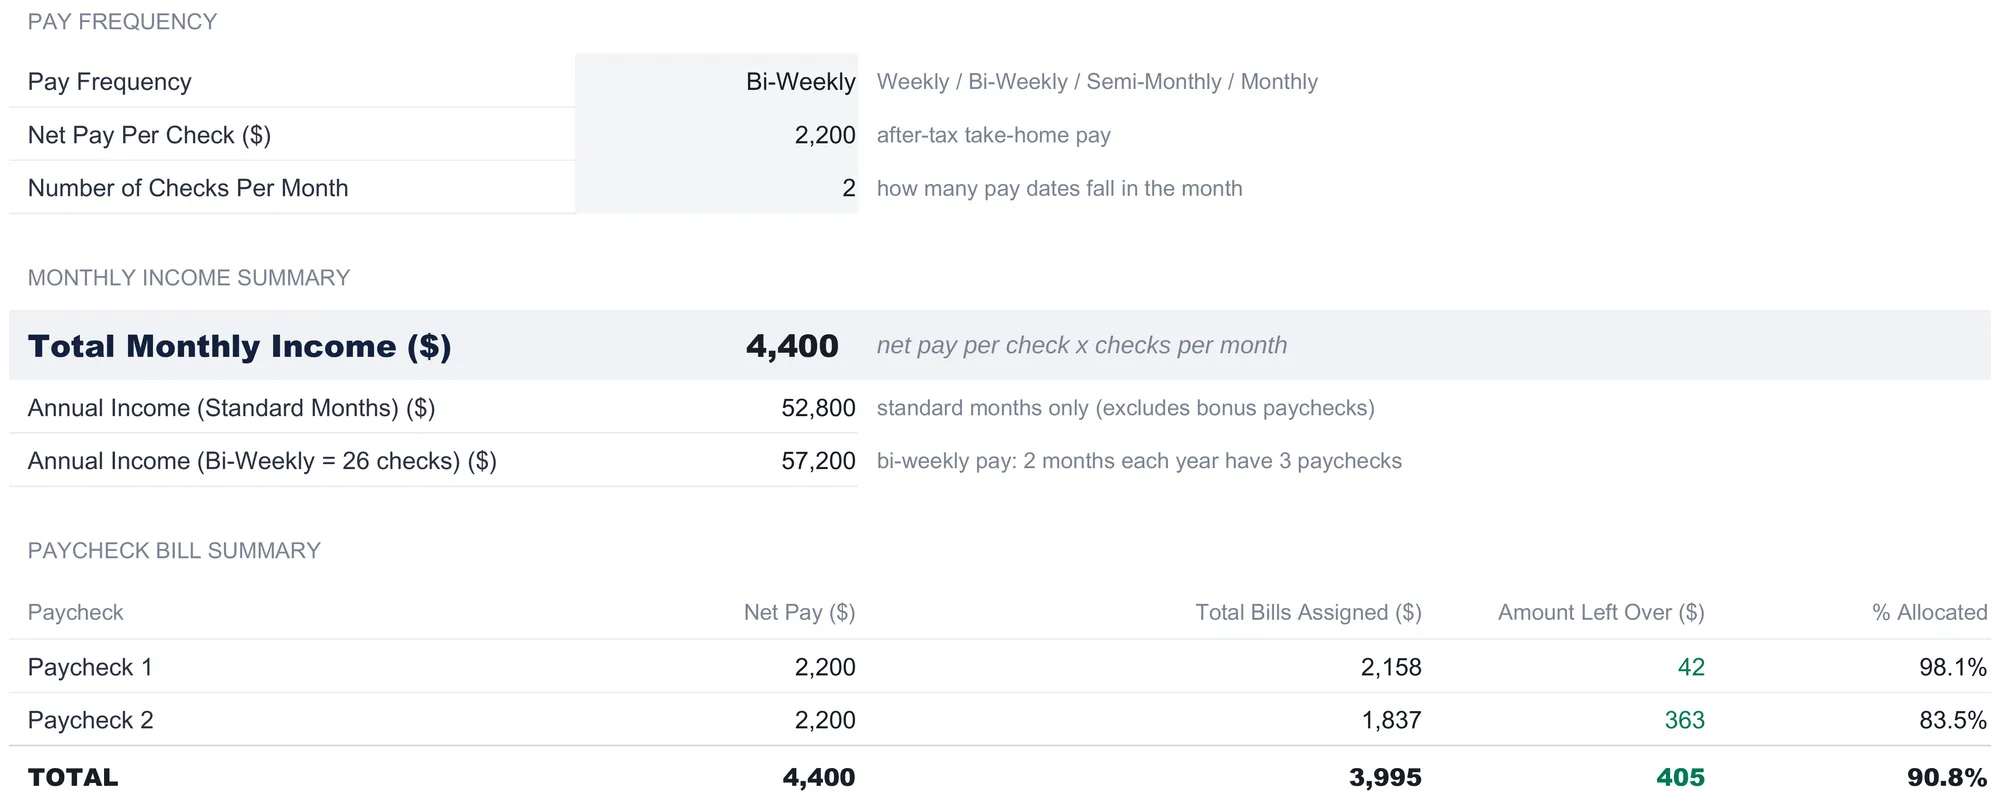
Below the income summary sits the Paycheck Bill Summary, and this is the payoff of the whole approach in a single small table. It pulls the total assigned to each check from the two paycheck sheets and shows what is left. Paycheck 1 takes home $2,200 and is assigned $2,158 in bills, leaving $42 and running 98.1 percent allocated. Paycheck 2 takes home the same $2,200 but is assigned only $1,837, leaving $363 at 83.5 percent allocated. Across the month the two checks total $4,400 of income against $3,995 of bills, $405 left over, 90.8 percent allocated. Nothing in this table is typed; it is a live read on how the two checks are carrying the month, and the lopsidedness between them is the exact thing a single monthly total would erase.
Assign the first check: the Paycheck 1 sheet
The two paycheck sheets are where the real entry happens, and they are identical in shape. Each lists the bills and expenses that come out of one check, one row apiece, with a name, an amount, a due date, a category, and a status. In the sample, Paycheck 1 carries the bills that fall in the first half of the month:
| Bill / Expense | Amount ($) | Due | Category |
|---|---|---|---|
| Rent | 1,400 | 1st | Housing |
| Electric | 95 | 3rd | Utilities |
| Internet | 60 | 5th | Utilities |
| Renter’s Insurance | 18 | 1st | Housing |
| Streaming Services | 40 | 8th | Entertainment |
| Phone | 50 | 10th | Utilities |
| Gym Membership | 45 | 1st | Health |
| Savings Transfer | 200 | 2nd | Savings |
| Emergency Fund | 100 | 2nd | Savings |
| Discretionary | 150 | Personal | |
| Total assigned | 2,158 |
The status field on every row reads Pending in the sample, and the How to Use sheet explains it is meant to be flipped to Paid or Skip as the period unfolds. That gives the sheet a second life beyond planning: it becomes a checklist of what has actually gone out.
Above the list, a Paycheck Summary block reads five computed lines. Net Pay This Paycheck is $2,200, pulled from Pay Setup. Total Assigned to This Paycheck sums the rows to $2,158. Remaining from Paycheck is the difference, $42. Then two lines add a cushion to the picture: Buffer Amount is a flat 10 percent of net pay, $220 here, and Remaining After Buffer subtracts it, landing at -$178. That negative is not an error in the sheet; it is the sheet doing its job. It is telling you that once you hold back a tenth of the check as a cushion, this particular paycheck’s assigned bills run $178 past what is left. Whether that matters is your call. The workbook’s role is to surface the number, not to tell you what to do about it.
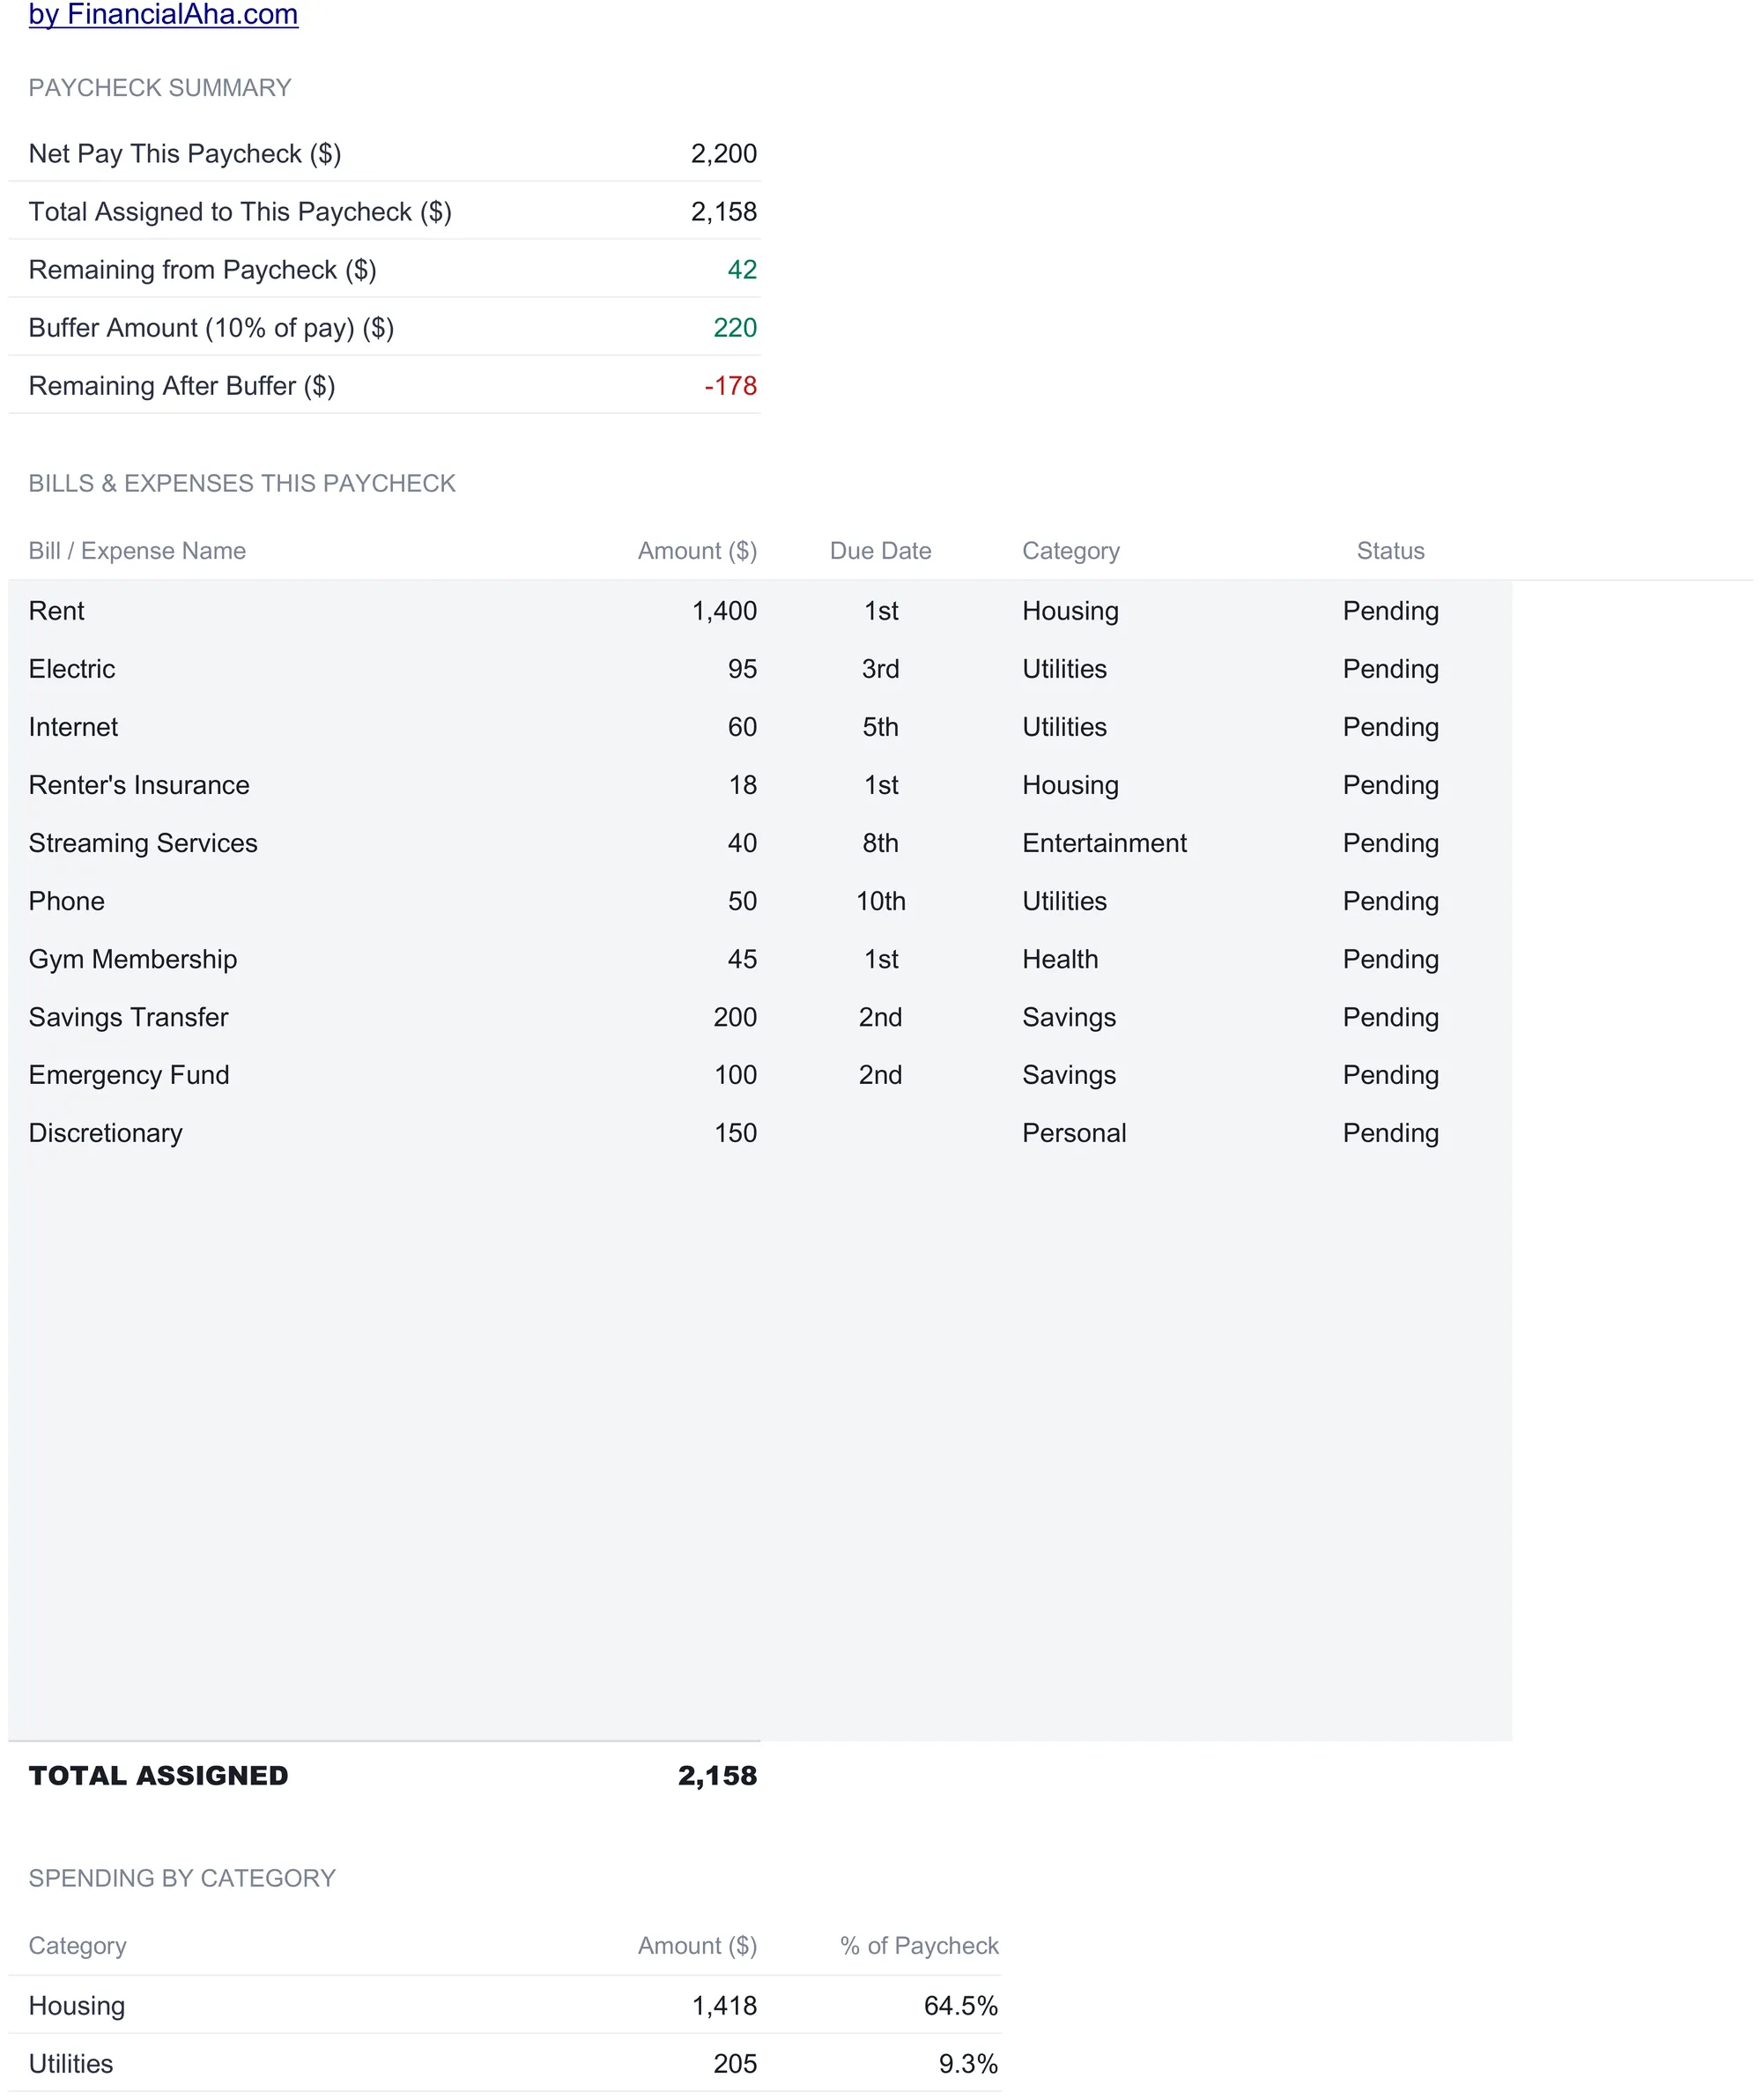
At the bottom, a Spending by Category block turns the row-level list into totals by type, using a SUMIF on the Category column. For the first check that reads Housing $1,418 (Rent plus Renter’s Insurance, 64.5 percent of the paycheck), Utilities $205 (9.3 percent), Entertainment $40 (1.8 percent), Health $45 (2.0 percent), Savings $300 (13.6 percent), and Personal $150 (6.8 percent). The percentages divide each category by the $2,200 net pay, so they answer a plain question: what share of this one check does each kind of spending consume. Because the summary keys on whatever text appears in the Category column, renaming or adding categories flows straight through.
Assign the second check: the Paycheck 2 sheet
Paycheck 2 works the same way, and comparing the two is where the paycheck view earns its keep. The second check in the sample carries a different set of bills, the ones that fall in the back half of the month:
| Bill / Expense | Amount ($) | Due | Category |
|---|---|---|---|
| Car Payment | 350 | 15th | Transportation |
| Car Insurance | 120 | 15th | Transportation |
| Groceries | 500 | Food | |
| Gas | 80 | Transportation | |
| Water / Sewer | 42 | 20th | Utilities |
| Health Insurance | 200 | 15th | Insurance |
| Subscriptions | 25 | 18th | Subscriptions |
| Savings Transfer | 200 | 16th | Savings |
| 401(k) Contribution | 220 | 15th | Savings |
| Discretionary | 100 | Personal | |
| Total assigned | 1,837 |
The summary block tells a different story from the first check. Net pay is again $2,200, but only $1,837 is assigned, so Remaining from Paycheck is $363. Subtract the same $220 buffer and Remaining After Buffer is a positive $143, shown in green rather than the first check’s red. The two checks are carrying uneven loads on purpose, and the workbook shows it without editorializing: one check is stretched past its buffer, the other has room to spare. What a household does with that observation, whether it shifts a bill from one check to the other or leaves things as they are, is not something the sheet decides.
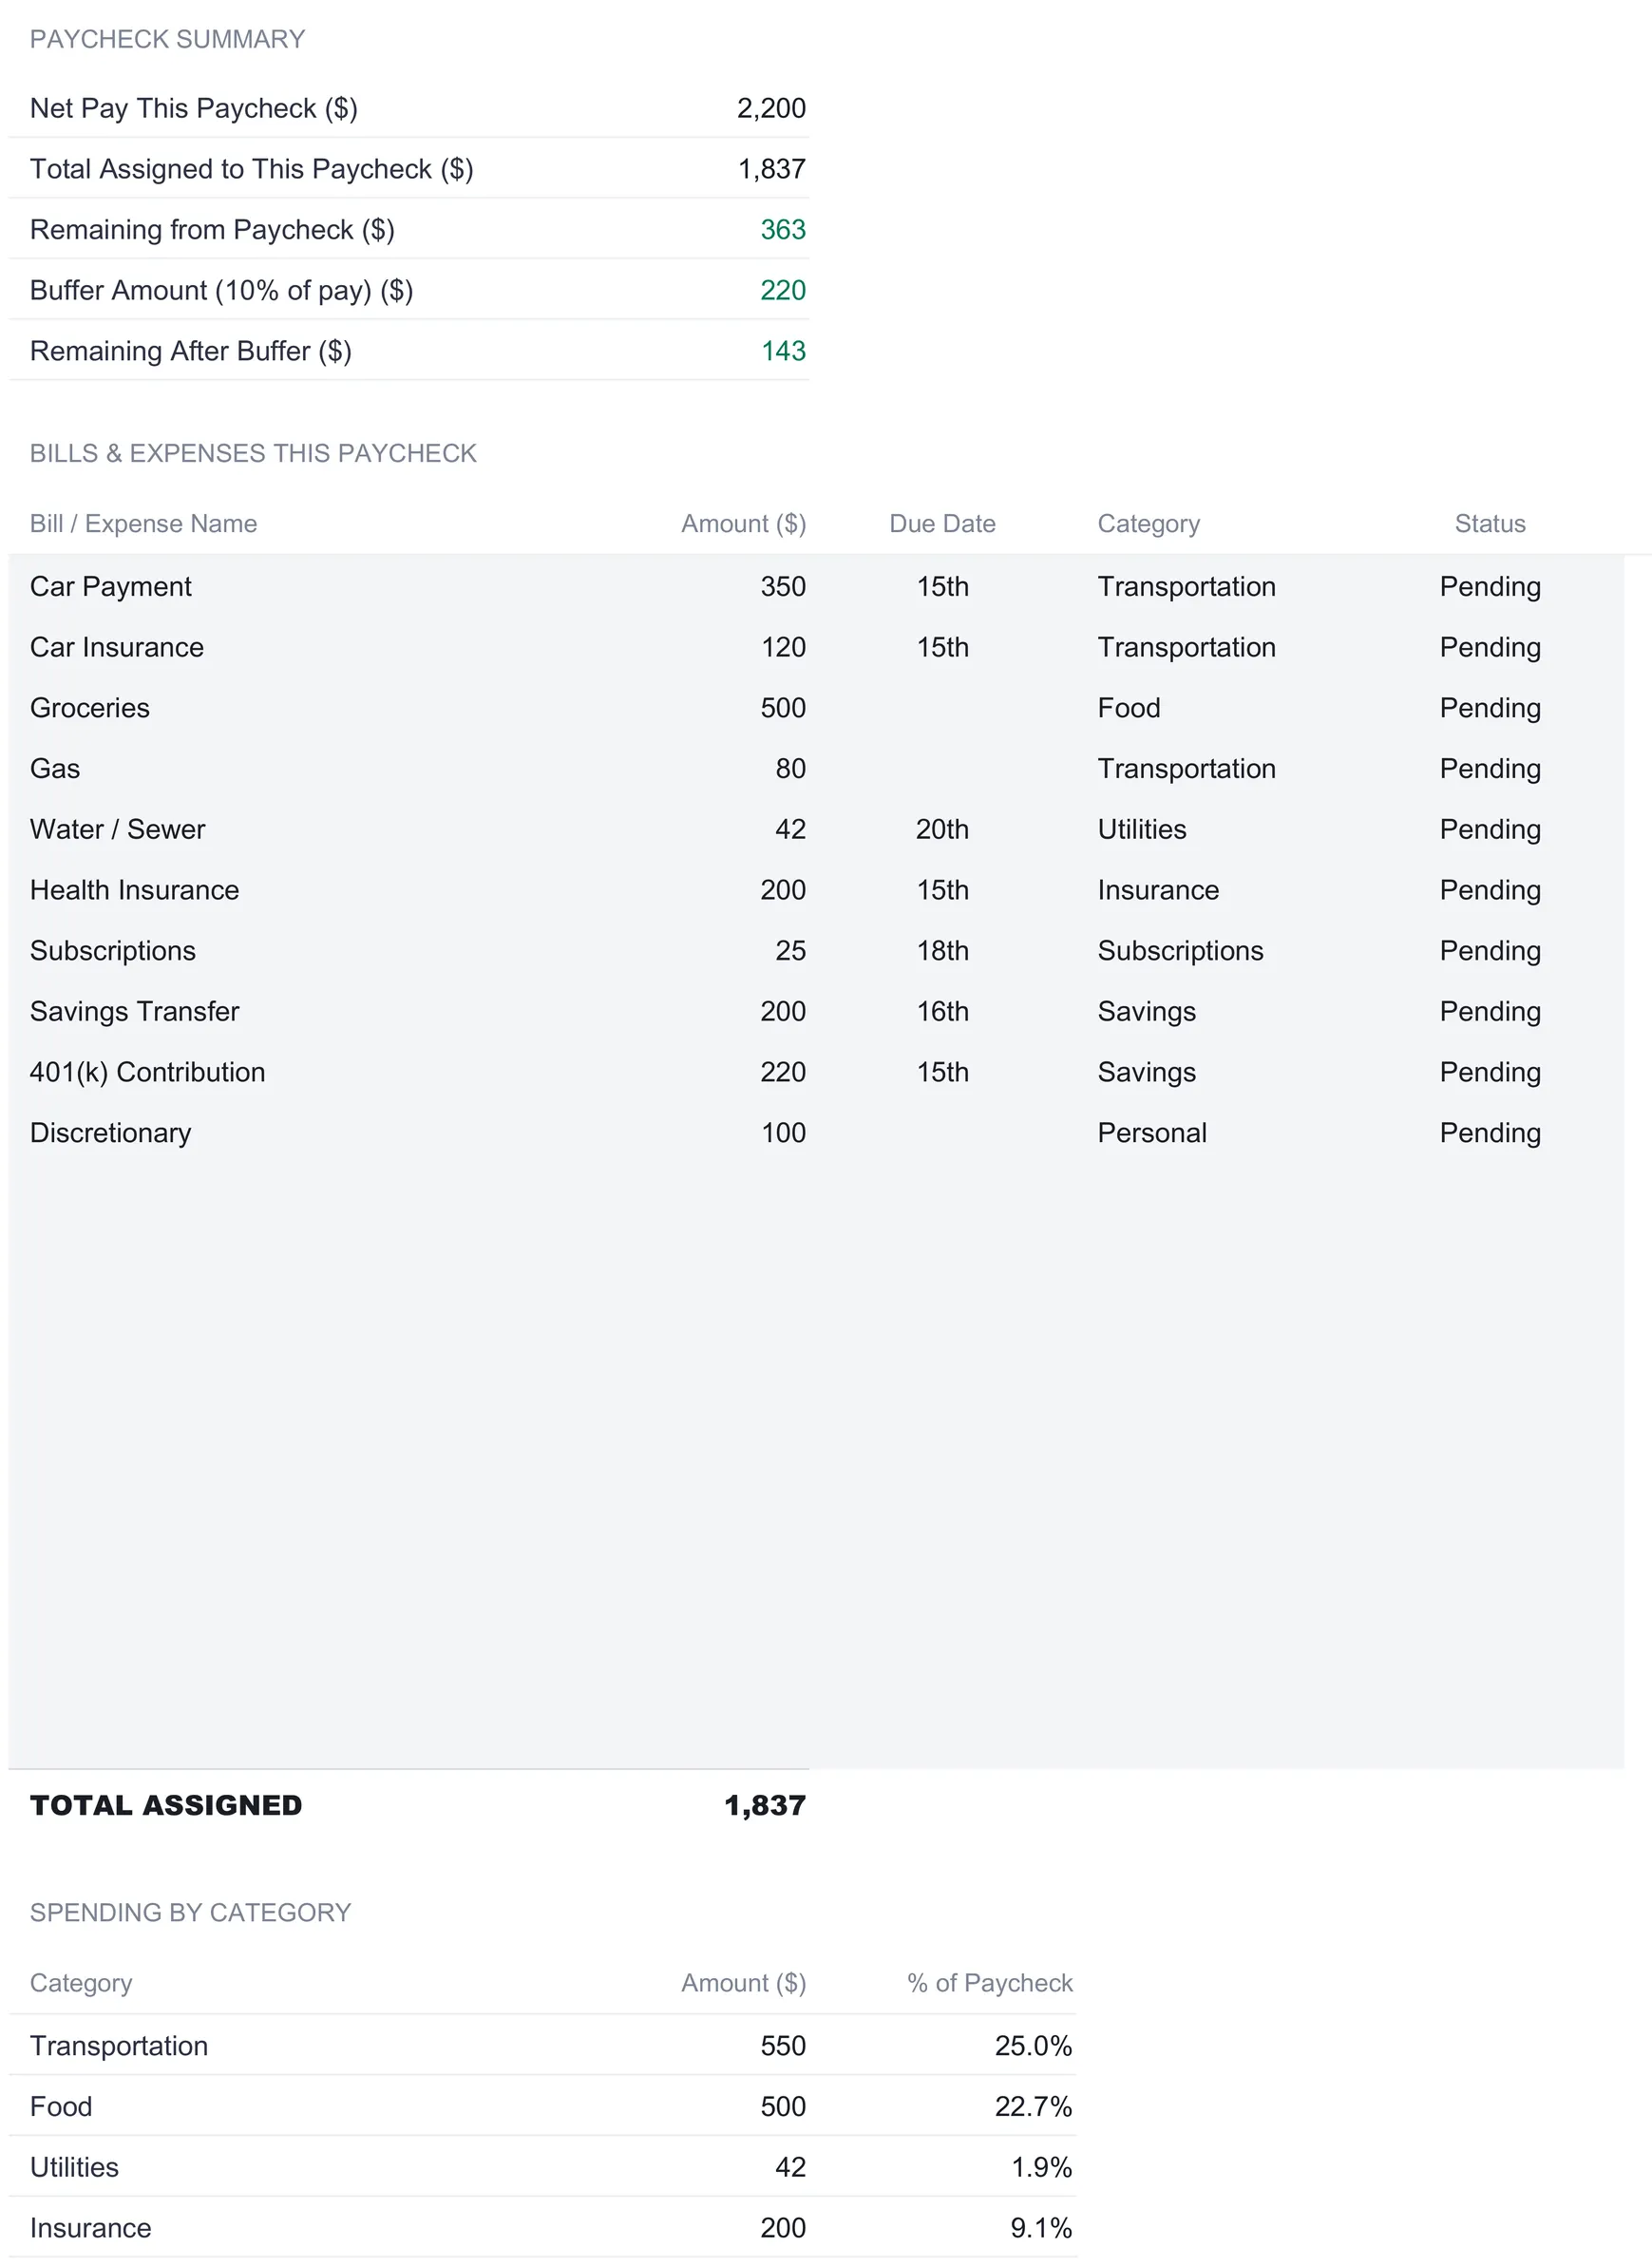
Its Spending by Category totals read Transportation $550 (25.0 percent of the check), Food $500 (22.7 percent), Utilities $42 (1.9 percent), Insurance $200 (9.1 percent), Subscriptions $25 (1.1 percent), Savings $420 (19.1 percent), and Personal $100 (4.5 percent). Set the two checks next to each other and the split of the month falls into place: housing and its utilities land on the first paycheck, transportation and food on the second, and savings is deliberately spread across both, $300 on the first check and $420 on the second, so no single payday carries the whole savings load.
One design detail is worth copying into any hand-built version. Both paycheck sheets leave spare rows below the sample bills, and those blank rows already sit inside the total and every downstream summary. A new bill goes on the first free row and the whole workbook updates. There is no formula to drag and no range to extend, which is the usual place a hand-built budget quietly breaks.
Combine the two checks: the Monthly Overview sheet
With both checks filled in, the Monthly Overview sheet stitches them back into a single month. Nothing on it is typed except one column, and that exception is the point of the sheet.
The top block, This Month Summary, lays the two checks side by side and adds a Combined column with each line as a share of income. Total Income is $2,200 and $2,200 for a combined $4,400 at 100 percent. Total Bills Assigned is $2,158 and $1,837 for $3,995, which is 90.8 percent of income. Total Savings is $300 and $420 for $720, a 16.4 percent savings rate. Discretionary is $150 and $100 for $250, 5.7 percent. Amount Left Over is $42 and $363 for $405, 9.2 percent. This is the monthly budget a conventional template would show, except every figure is built up from the per-check detail rather than estimated at the month level.
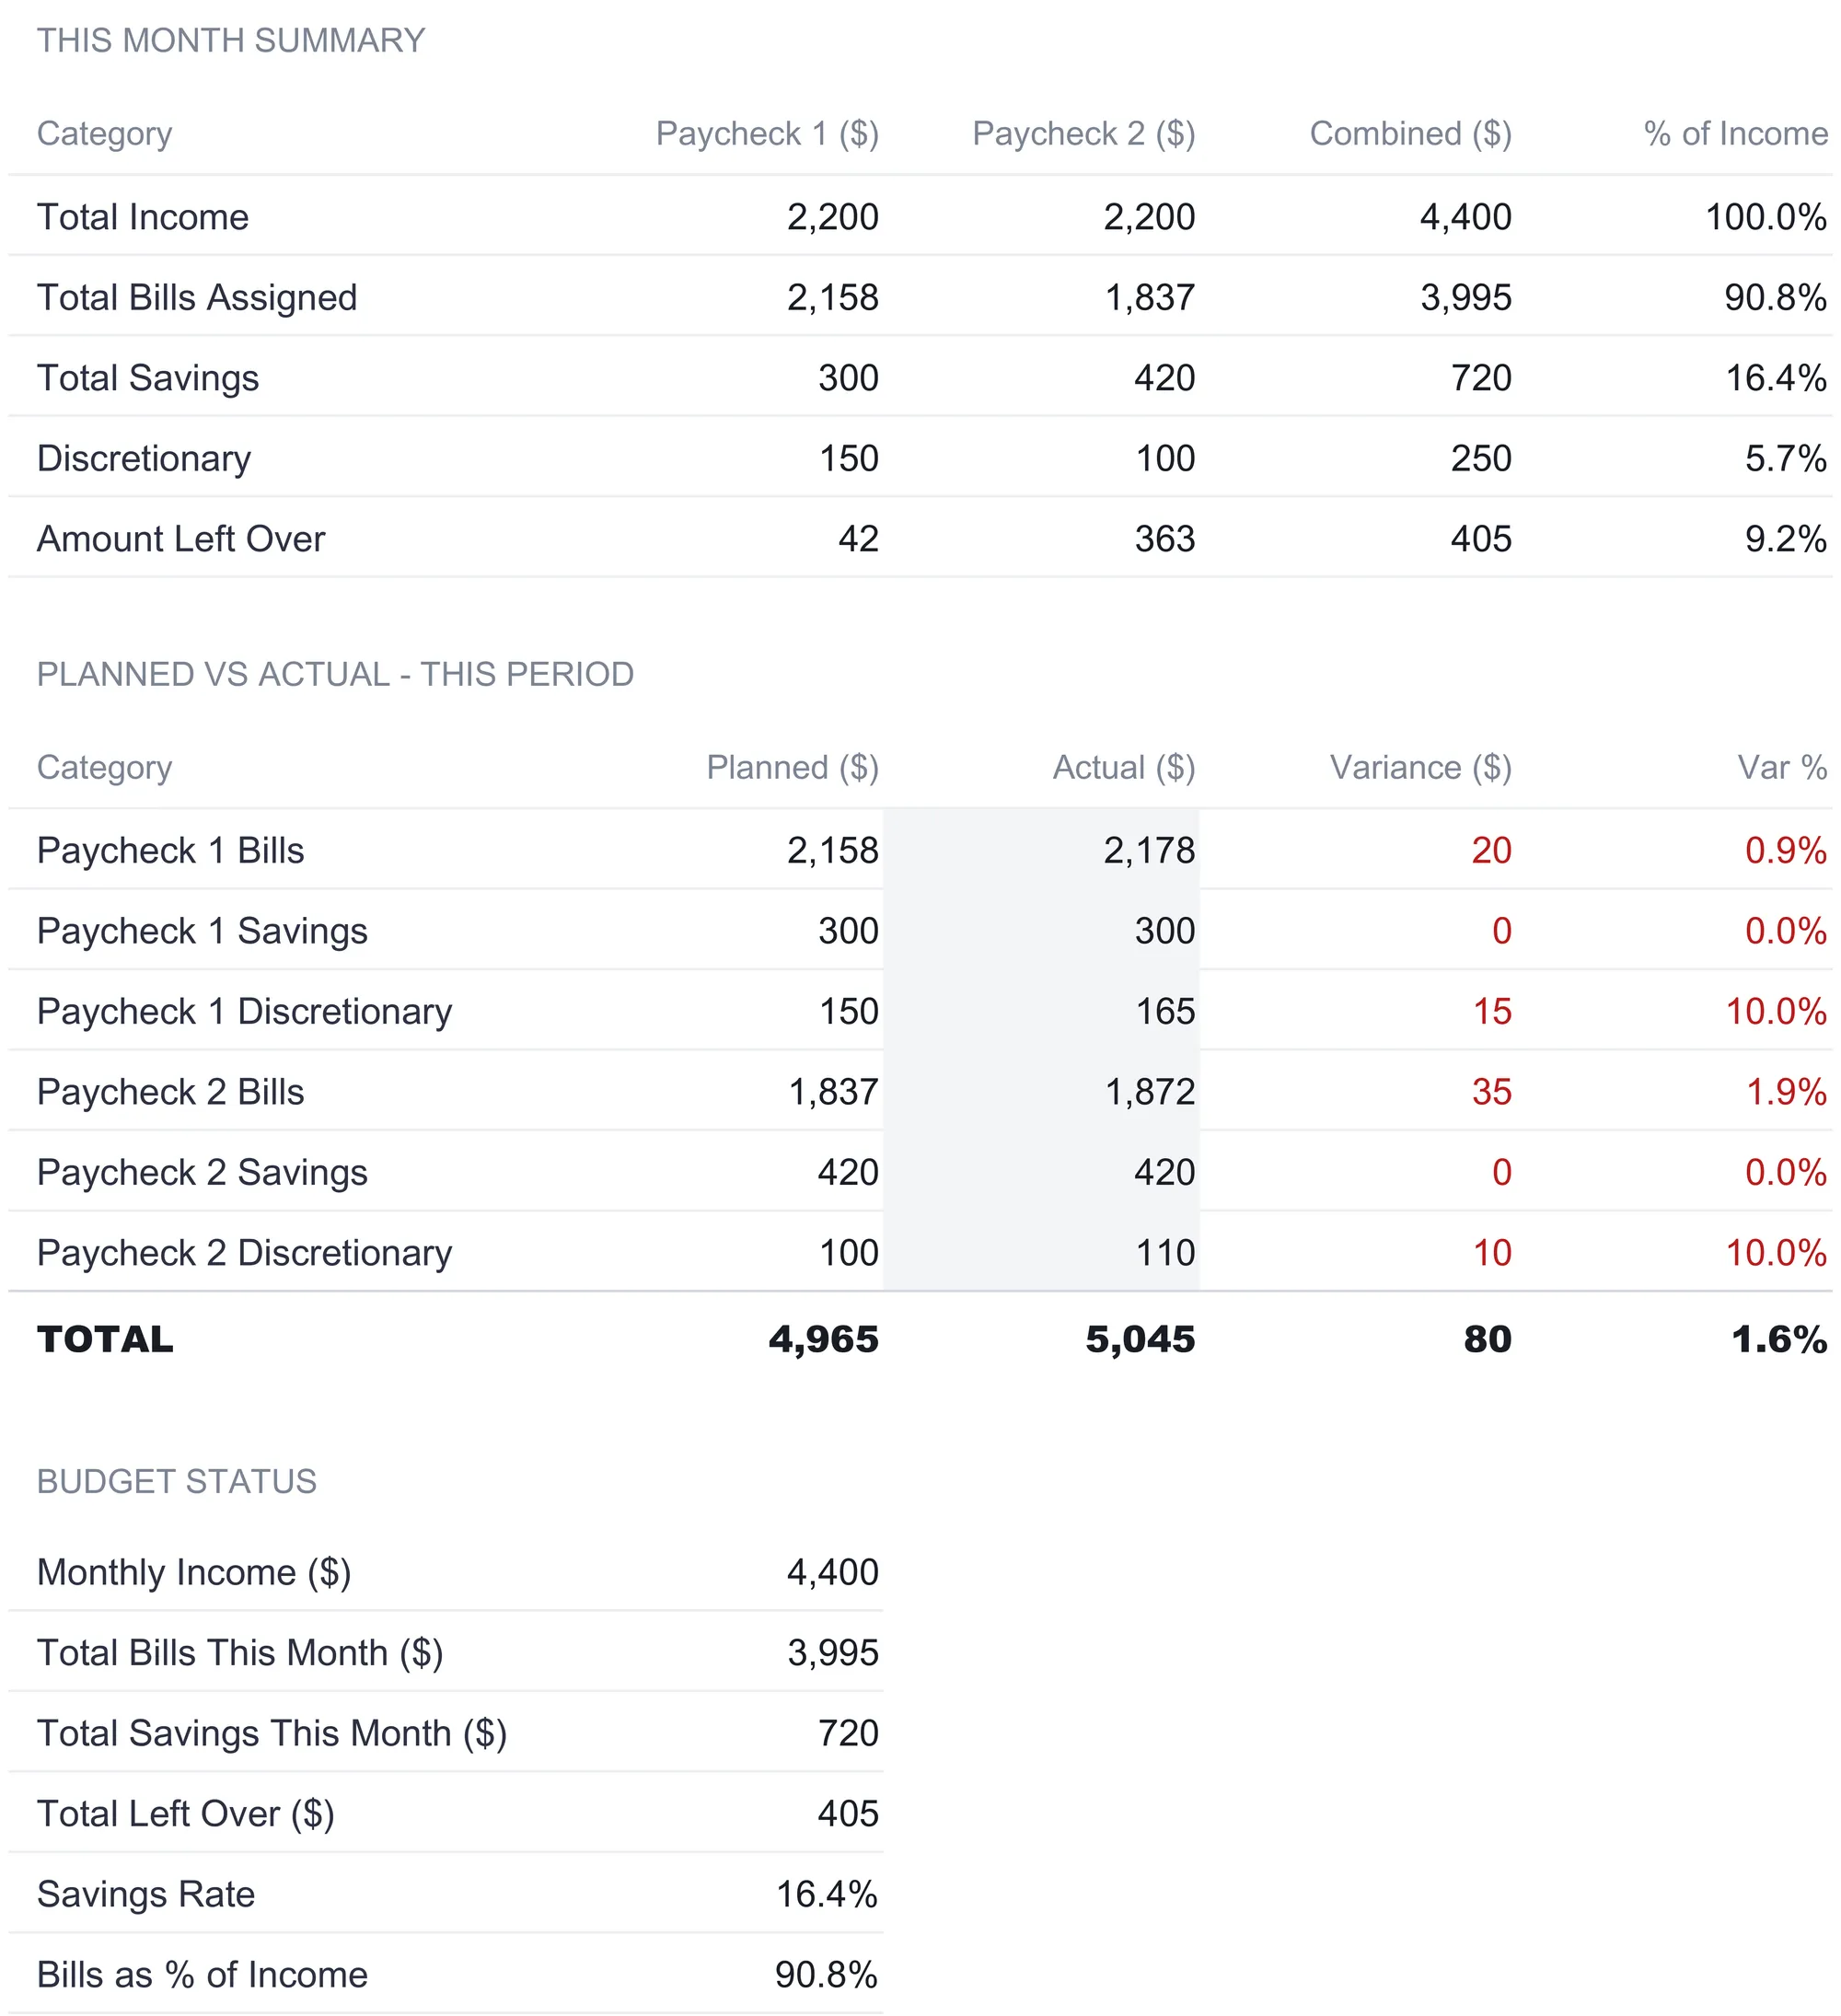
The middle block, Planned vs Actual, is where the one typed column lives. The Planned figures are pulled from the paycheck sheets; the Actual column is yours to fill in as the period closes. In the sample, Paycheck 1 Bills were planned at $2,158 and came in at $2,178, a $20 variance of 0.9 percent. Paycheck 1 Discretionary was planned at $150 and ran to $165, a $15 overshoot of 10.0 percent. Paycheck 2 Bills went from a planned $1,837 to an actual $1,872, up $35 or 1.9 percent, and Paycheck 2 Discretionary from $100 to $110, another 10 percent. Savings landed exactly on plan on both checks. The totals roll up to $4,965 planned against $5,045 actual, a combined variance of $80, or 1.6 percent over. The How to Use sheet notes that a positive variance on expenses means you spent more than planned and shows in red, which is why the variance figures here read as warnings rather than good news.
The bottom block, Budget Status, distills the month to six lines: Monthly Income $4,400, Total Bills This Month $3,995, Total Savings This Month $720, Total Left Over $405, Savings Rate 16.4 percent, and Bills as Percent of Income 90.8 percent. These are the same numbers the summary already computed, gathered in one place as the month’s scorecard.
See the whole year: the Annual View sheet
The Annual View sheet stretches the monthly picture across all twelve months and is where the bi-weekly quirk finally gets its own accounting. Three stacked tables track income, bills, and savings month by month, each with an annual total in the final column.
The income table carries three rows. Paycheck 1 Income and Paycheck 2 Income each run $2,200 a month for a $26,400 annual total apiece. The third row, Bonus Paycheck (3rd check), is the interesting one: it is zero in most months but holds $2,200 in the sample’s two flagged months, for a $4,400 annual total. Total Income therefore reads $4,400 in a standard month and $6,600 in a three-paycheck month, summing to $57,200 for the year, the same 26-check figure Pay Setup computed.
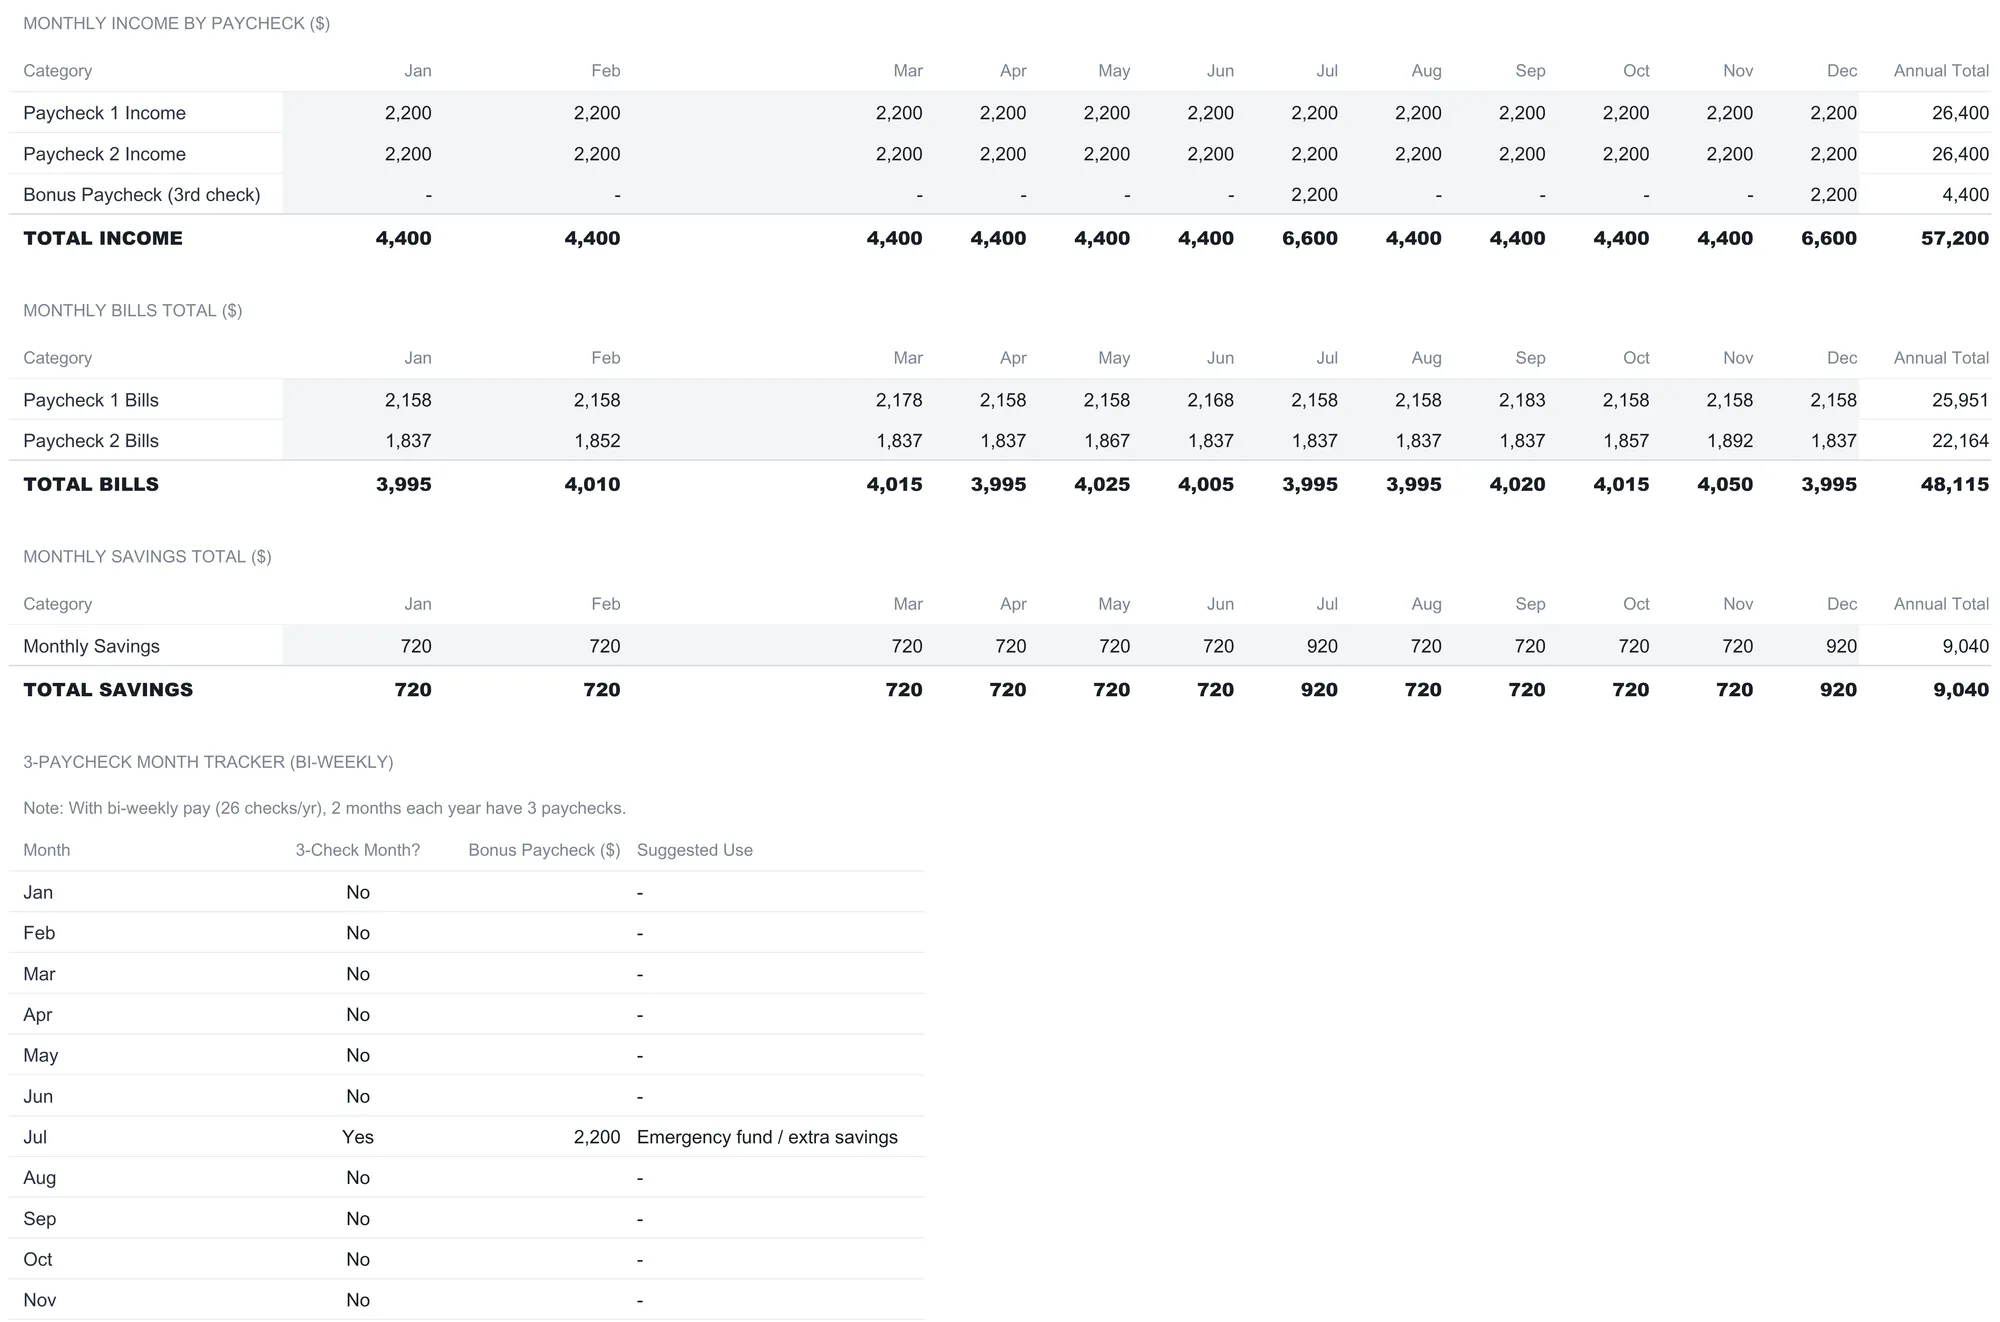
The bills and savings tables are meant to be updated as each month actually closes, which is why their monthly figures vary slightly rather than repeating one number. Monthly bills hover around $3,995 to $4,050, summing to $48,115 for the year against an average of $4,010 a month. Monthly savings sits at $720 in standard months and rises to $920 in the two bonus months, for a $9,040 annual total and an average of $753 a month. The extra $200 of saving in each three-paycheck month is the workbook’s sample choice, not a rule the sheet enforces.
Below the tables, the 3-Paycheck Month Tracker lists all twelve months with a Yes or No, the bonus amount, and a Suggested Use column. In the sample, two months are marked Yes with a $2,200 bonus and the preset note “Emergency fund / extra savings.” The note is the template’s own default text rather than guidance about your money, and the How to Use sheet is careful on this point: to find your own three-paycheck months, it says, look at a calendar and count your paydays, because the months shift each year with the calendar. That matches the bi-weekly method’s explanation, where a schedule starting on a different date lands its extra checks in different months entirely. The workbook’s flagged months are the sample’s; yours are whatever your payday calendar produces. An Annual Statistics block closes the sheet with six annual figures: income, bills, savings, the savings rate, and average monthly bills and savings. The 15.8 percent annual savings rate sits just below the single-month 16.4 percent because the two bonus paychecks add $4,400 to annual income while the sample lifts savings by only $400 across those months.
The dashboard: six numbers and two charts
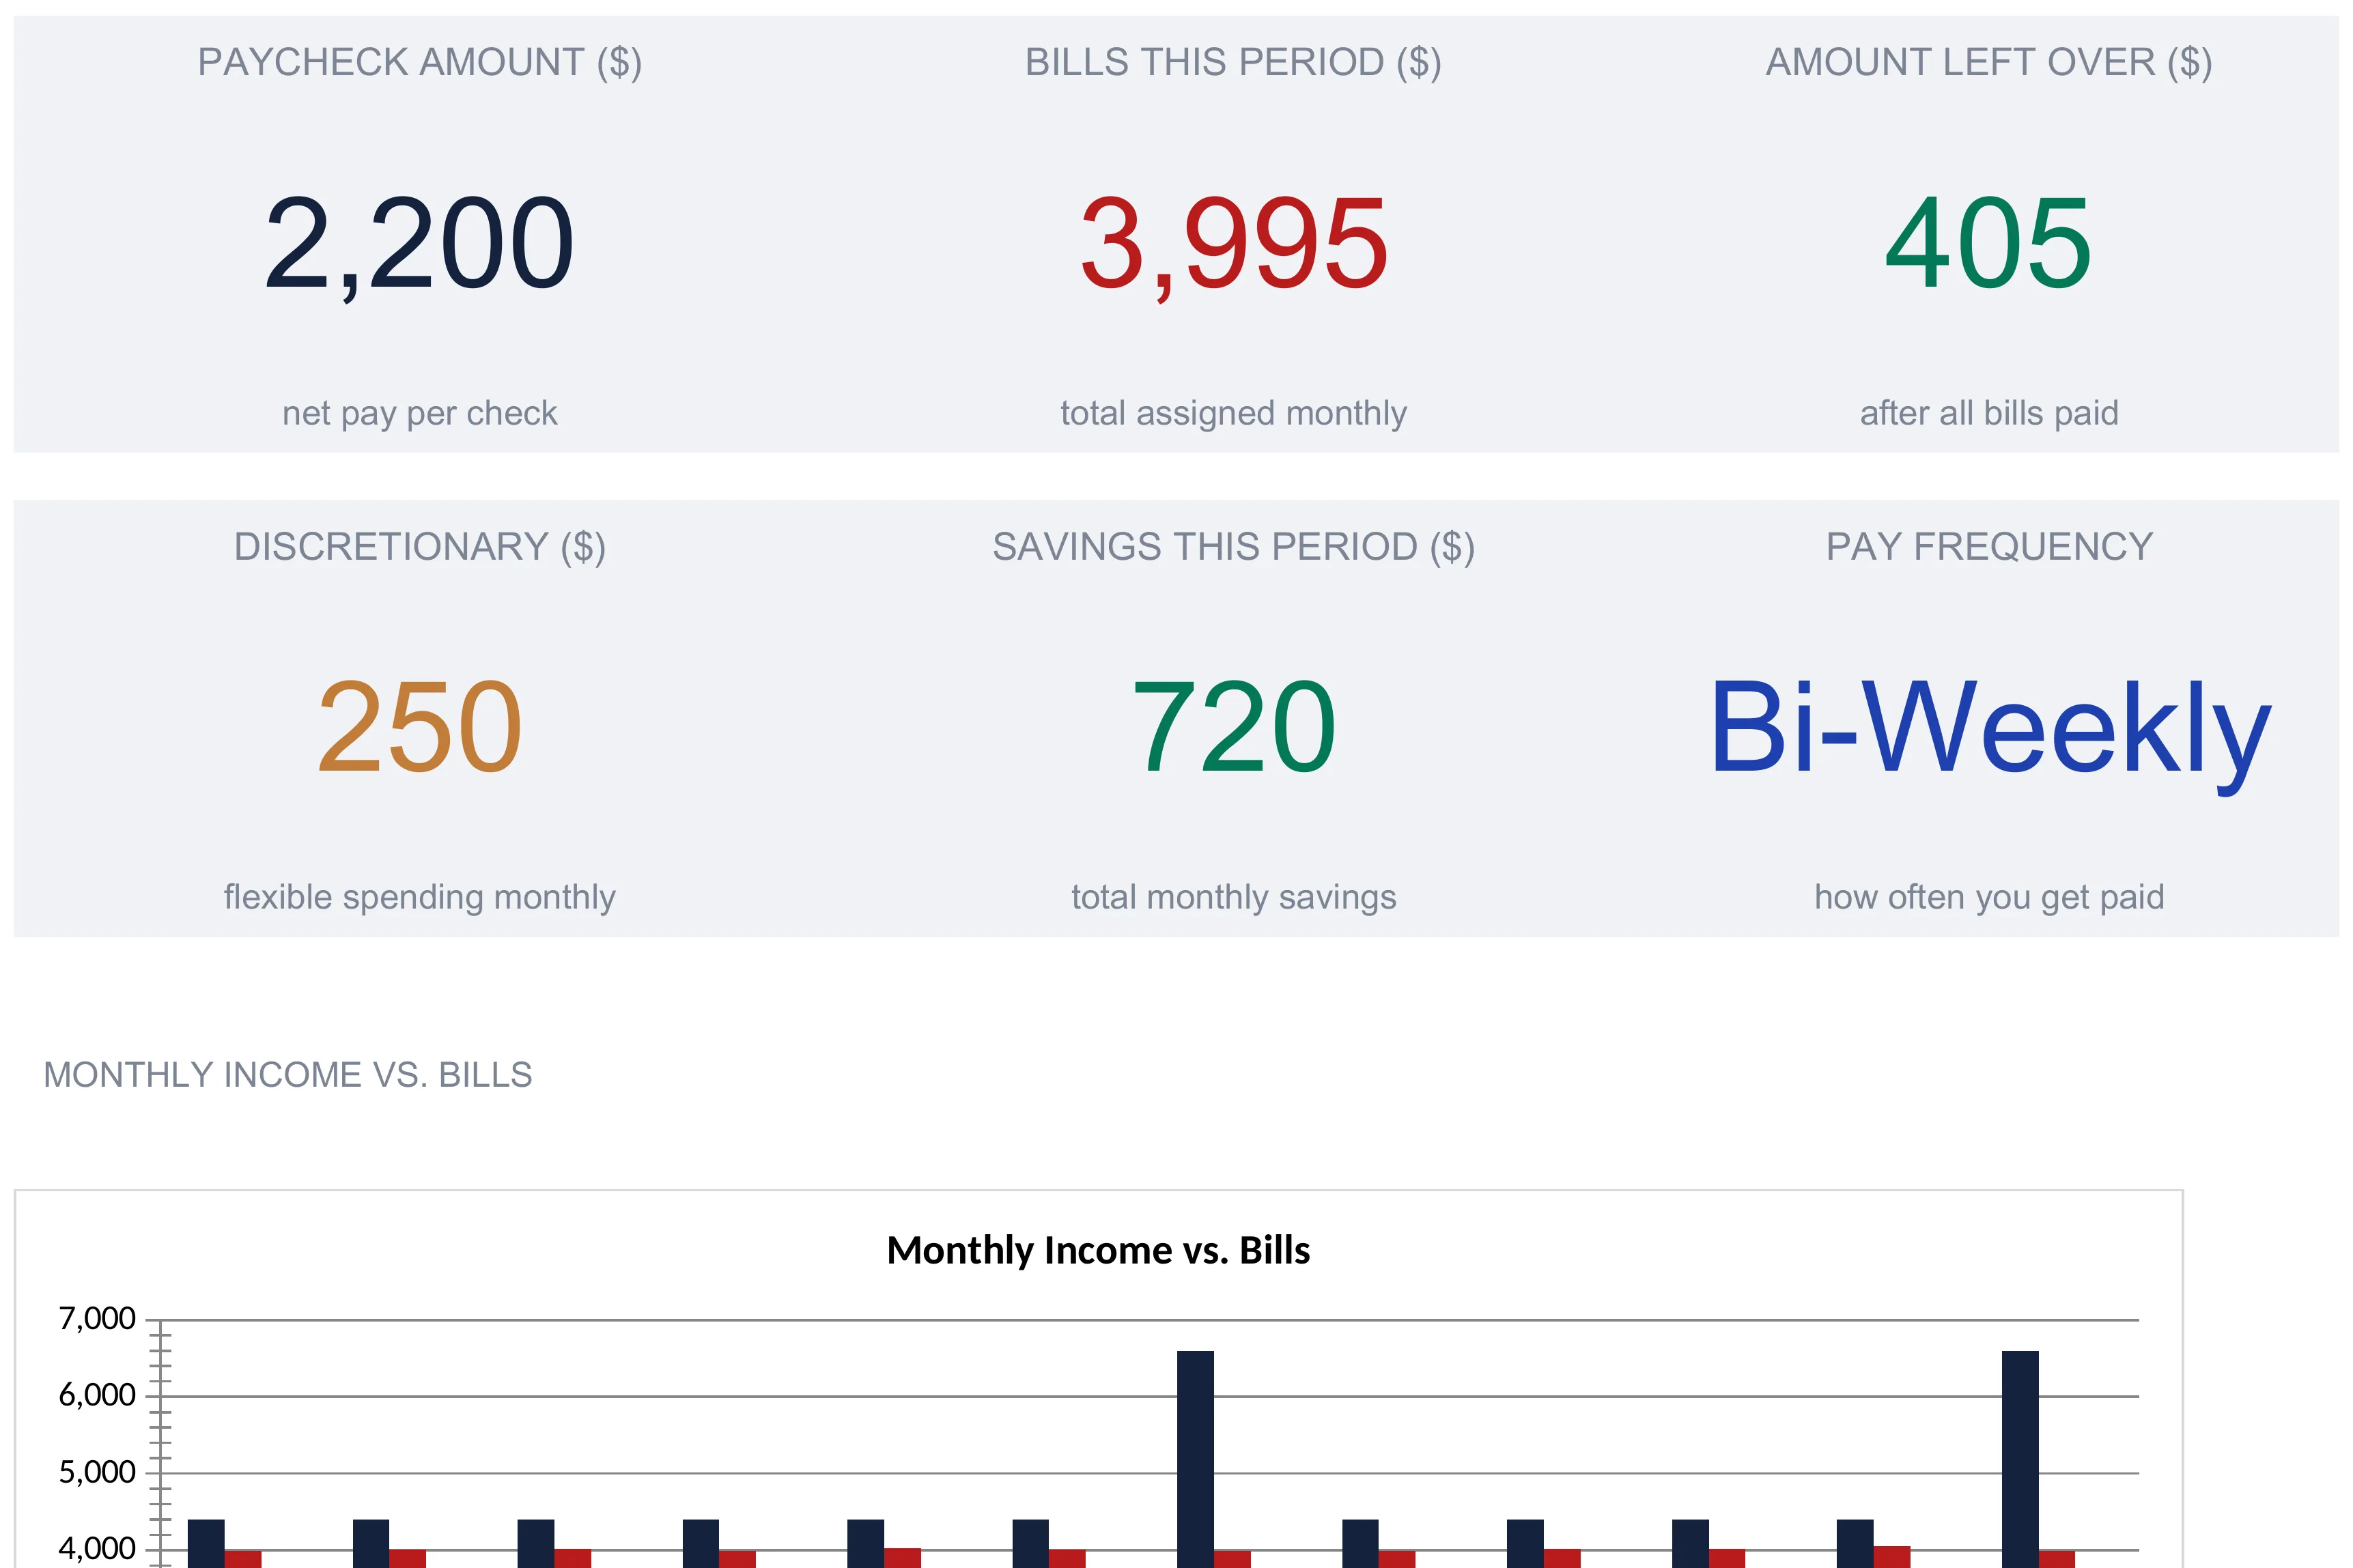
The Dashboard sheet sits on top of the file and invents nothing. It reads the sheets below and presents the current pay period in six KPI cards, shown in the cover image above. Paycheck Amount is $2,200, the net pay per check. Bills This Period is $3,995, the total assigned across both checks. Amount Left Over is $405. Discretionary is $250, the flexible spending across both checks. Savings This Period is $720. Pay Frequency reads Bi-Weekly. Each card carries a one-line description beneath the number, so the sheet reads without a manual.
Two charts sit below the cards. The first, Monthly Income vs. Bills, plots the twelve months from Annual View and makes the two bonus months obvious as taller income bars, $6,600 against the usual $4,400. The second, a Paycheck Allocation Breakdown, groups the month’s $3,995 of bills into four buckets (Savings $720, Housing and Utilities $1,665, Transportation and Insurance $750, and Food and Other $860) using SUMIF formulas that look for specific category names, with Food and Other taking whatever the first three buckets do not claim. Those four add back to the same $3,995, so the chart is a second angle on the same money rather than a new number. As the How to Use sheet notes, nothing on the dashboard is typed; it is entirely a read on the sheets beneath it.
Coverage, leftover, and the buffer in plain terms
Three ideas do most of the work in this workbook, and none of them is complicated once the labels are unpacked.
Coverage is the share of a check its assigned bills consume, the ”% Allocated” column on Pay Setup. The first check runs 98.1 percent allocated and the second 83.5 percent, which is simply each check’s assigned bills divided by its $2,200 pay. A check above 100 percent would be assigned more than it takes home.
Leftover is what remains after the assigned bills, the “Remaining from Paycheck” and “Amount Left Over” lines. It is net pay minus assigned bills, $42 on the first check, $363 on the second, $405 combined. Because the assigned bills already include the savings transfers and the discretionary lines, leftover here is the slack beyond everything the plan has named, not a measure of savings.
The buffer is a flat 10 percent of net pay, $220 per check, and “Remaining After Buffer” shows what is left once that cushion is set aside. It is the reason the first check reads -$178 while the second reads +$143: same buffer, different bill loads. The buffer is a planning device the workbook computes automatically, in the same spirit as the emergency reserve the CFPB describes in its guide to building an emergency fund, which notes that setting money aside for unplanned costs is what keeps a single surprise from turning into debt. The sheet surfaces the buffer math; what to hold and where to hold it is left to you.
Excel or Google Sheets for a paycheck budget
The template is a plain .xlsx file built on standard functions, with no macros, no VBA, and no array formulas. It behaves the same in Microsoft Excel 2016 and later, in Google Sheets after an upload, and in LibreOffice Calc. The cross-sheet references use the standard tab names, which is why the How to Use sheet asks you not to rename the sheets. Google Sheets suits anyone who wants to update the status column from a phone as bills clear; Excel suits those who prefer a local file. A currency dropdown on the Dashboard relabels every money column and KPI across the workbook to any of 35 symbols, though it only changes the label and does not convert the underlying numbers. The structure described here is equally buildable by hand in either program.
Which paycheck budget fits
- Paycheck Budget Ultimate Spreadsheet Template ($29) is the workbook this walkthrough follows: Pay Setup, the two paycheck sheets, the Monthly Overview with its planned-versus-actual table, the twelve-month Annual View with three-paycheck tracking, and the six-card dashboard, ready to use in Excel or Google Sheets. The same template comes in a free version with a single paycheck-budgeting sheet for anyone who wants to try the method before committing, and an Essentials version ($19) that sits between the free sheet and the full workbook.
- Weekly Budget Ultimate Spreadsheet Template ($29) applies the same pay-period thinking at a finer grain, organizing spending week by week across a 52-week overview rather than check by check. It suits people who think in weeks, or who are paid weekly and want each week to have its own plan rather than folding four checks into two halves of a month.
Whichever version fits, the habit underneath is the one the CFPB describes as the core of any budget: identify what comes in, note when bills are due, and put the two together in one place. Assigning each bill to the check it comes out of is just that same habit told at the resolution most people actually get paid.
Related
- Bi-Weekly Budgeting: How to Create a Budget Based on Paychecks - the method behind the workbook, including how to find your own three-paycheck months
- Paycheck Calculator: Understanding Your Take-Home Pay - where the net pay figure you enter in Pay Setup comes from
Frequently asked questions
How is budgeting by paycheck different from a monthly budget?
A monthly budget compares one income figure against one pile of bills for the whole month. A paycheck budget splits that month into the actual checks you receive and assigns each bill to the check it comes out of, so you can see whether a single paycheck covers what falls due before the next one arrives. In the sample workbook the month totals $4,400 in income and $3,995 in bills, but the two checks carry different loads: the first is assigned $2,158 and the second $1,837. A monthly view would hide that gap.
Do I enter gross pay or net pay in Pay Setup?
Net pay. The Net Pay Per Check cell is labeled "after-tax take-home pay," the amount that actually lands in your account after taxes and deductions. The sample uses $2,200. Total Monthly Income is then net pay times checks per month, so the whole workbook works in take-home dollars rather than gross salary.
Does the template only work for bi-weekly pay?
No. Pay Setup has a Pay Frequency cell you type into, with the note beside it listing Weekly, Bi-Weekly, Semi-Monthly, or Monthly, and a separate Number of Checks Per Month cell that the monthly and standard-year income figures multiply the check by. The sample is set to Bi-Weekly with 2 checks in a standard month. The two paycheck sheets are named Paycheck 1 and Paycheck 2, so the layout is built around two checks a month; weekly earners would group their weekly bills into those two halves of the month.
Where does the extra check in a three-paycheck month show up?
On the Annual View sheet. Bi-weekly pay delivers 26 checks a year, so two months carry a third paycheck. The workbook's Bonus Paycheck (3rd check) row adds that extra $2,200 in the sample's two flagged months, lifting their total income to $6,600 instead of $4,400, and the 3-Paycheck Month Tracker marks each one with a preset "Emergency fund / extra savings" note. Which calendar months those are depends on your own payday schedule, not the sample's.
Can I change the bill categories, or are they fixed?
The Category column on each paycheck sheet is a plain text field, and the Spending by Category summary adds up whatever category names you type using a SUMIF, so you can rename or add categories freely. One thing to know: the Dashboard's allocation chart groups spending under specific names it looks for (Housing, Utilities, Transportation, Insurance, Savings, and everything else as Food and Other), so those exact labels feed the chart.
Sources
- Budgeting: How to create a budget and stick with it - Consumer Financial Protection Bureau
- An essential guide to building an emergency fund - Consumer Financial Protection Bureau
About this article
Every figure, sheet name, formula, and feature description checked on 2026-09-10 against the shipped Paycheck Budget Ultimate workbook (Dashboard, Pay Setup, Paycheck 1, Paycheck 2, Monthly Overview, Annual View, How to Use), including its data validations, chart types and currency list. Budgeting and emergency-fund references checked against the live CFPB pages at writing time. Last reviewed September 2026.