An options trading journal spreadsheet records every closed contract in one trade log and derives everything else from it: total P&L, win rate, per-strategy performance, a month-by-month view, an expiration calendar, and a Greeks tracker for open positions. This walkthrough follows the full structure using a worked example, a sample log of 25 trades that nets $5,670 at a 72% win rate. Our Options Trading Journal Ultimate ($29) ships the whole thing ready-made for Excel and Google Sheets.
An options position packs a lot of moving parts into a single line of a brokerage statement. There is a strike, an expiration, a contract count, a premium, and a direction, and behind those sit the Greeks that describe how the position reacts to price, time, and volatility. When the trade closes, all of that collapses into one number, a gain or a loss, and the statement keeps only that. It is quiet on the questions a trader wants answered over time: how often the trades close green, which strategies are carrying the account and which are draining it, how the months compare, what is set to expire next, and where the open book stands on direction right now. Those answers are latent in the same facts you already record for every trade, and a spreadsheet is well suited to pulling them out.
Before any of that, a plain statement of what this is and is not. A trading journal records what already happened. It is a bookkeeping tool for closed trades, not a signal generator, a strategy, or a forecast. Nothing in it recommends a trade, ranks one setup above another as a thing to do, or predicts what any position will do next. Options in particular carry substantial risk. The SEC’s investor bulletin on options puts it plainly, that it is possible to lose all of your initial investment and sometimes more, and that option writers can face potentially unlimited losses. A journal does not change any of that. What it does is turn a pile of contracts into a readable record, so the numbers describe your own history rather than a hunch about it.
The structure comes down to one thing done well: a single trade log, entered once, feeding every other view by formula. Get that right and the strategy breakdown, the monthly totals, the expiration calendar, and a headline dashboard all fall out without a second round of typing. The examples below come from our Options Trading Journal Ultimate Spreadsheet Template ($29), which ships the whole thing ready-made for Excel and Google Sheets. The layout is reproducible by hand if you would rather build your own options trading journal spreadsheet from scratch.
What an options trading journal spreadsheet has to hold
Strip away the broker chrome and there are only a few kinds of data behind an options record:
- Per-trade records. The dates opened and closed, the ticker, the strategy, the strike, the expiration, the contract count, the premium, the direction, and the entry and exit cost for every closed trade. This is the raw material for everything else.
- Categories that group the trades. The strategy label and the expiration month, which are the two axes the summary sheets slice the log along.
- Open-position risk. The delta, gamma, theta, and vega for positions still on, plus the shares-per-contract figure that turns them into portfolio exposure.
- Derived views. Total P&L, win rate, average return, per-strategy totals, monthly buckets, an expiration schedule, and the dashboard KPIs. These are calculations, not entries. In a well-built sheet, nothing here is ever typed.
The journal gives each of these its own sheet: Trade Log for the trades, Strategy Analysis for the per-setup view, Monthly P&L for the calendar view, Expiration Calendar for the schedule and goals, Greeks Tracker for open-position risk, and a Dashboard on top, with a How to Use sheet carrying the instructions. The Trade Log and the Greeks Tracker are where the data goes in, and they hold two different things: the log is the trade history, the Greeks sheet is the open book. Beyond those two, the only cells you type are the Journal Year on Monthly P&L and the Target column on the Expiration Calendar. Every summary sheet reads the log.
The reason to prefer that structure over a page of standalone tables is drift. When two summaries hold the same fact independently, the day one is updated and the other is not, they disagree, and a journal that quietly disagrees with itself is worse than no journal at all. Reading everything off one log removes the possibility: the strategy view, the monthly view, and the expiration view are not copies of the trade rows, they are functions of them, so they move the instant the source does. That single idea is what the rest of this walkthrough is about, sheet by sheet.
Start with the trades: the Trade Log
The Trade Log is the only place a trade is ever typed, and it is where every other number in the workbook begins. Each row is one trade, open or closed, laid out across sixteen columns, and the sheet states support for up to 150 entries. Thirteen of the columns are entries and three calculate.
The entry columns are Date Opened, Date Closed, Ticker, Strategy, Strike, Expiration, Contracts, Premium / Contract, Direction, Entry Cost, Exit Cost, DTE at Entry, and a Notes column. Direction is a dropdown with two values, Buy and Sell, and Strategy is a fixed dropdown of nine labels, which matters more than it looks, because the Strategy Analysis sheet later groups on the exact text in this column, and a free-typed label that does not match spelling for spelling would fall out of its bucket.
Two of the three calculated columns do the P&L math:
- P&L = for a Sell trade, entry cost minus exit cost; for a Buy trade, exit cost minus entry cost. It stays blank until a Date Closed is entered.
- % Return = the same P&L expressed over the entry cost.
That single P&L formula is what lets one log hold both directions of an options trade without a second column or a sign convention to remember. When you sell an option you collect the premium up front, so the entry cost is a credit and the trade profits when you buy the contract back for less, or let it expire worthless. When you buy an option you pay the premium up front, so the entry cost is a debit and the trade profits only when the contract gains value. The formula flips the subtraction on Direction so both cases land on the same P&L column. Investor.gov’s plain-language bulletin on options describes the same two roles, the option holder who pays premium and the option writer who collects it.
A sixteenth column, Cost Check, is a quiet safeguard. It recomputes the entry cost from the premium, the contract count, and the shares per contract set on the Greeks Tracker, and prints OK when the typed entry cost matches. Every sample row reads OK, so the entered costs line up with the premiums.
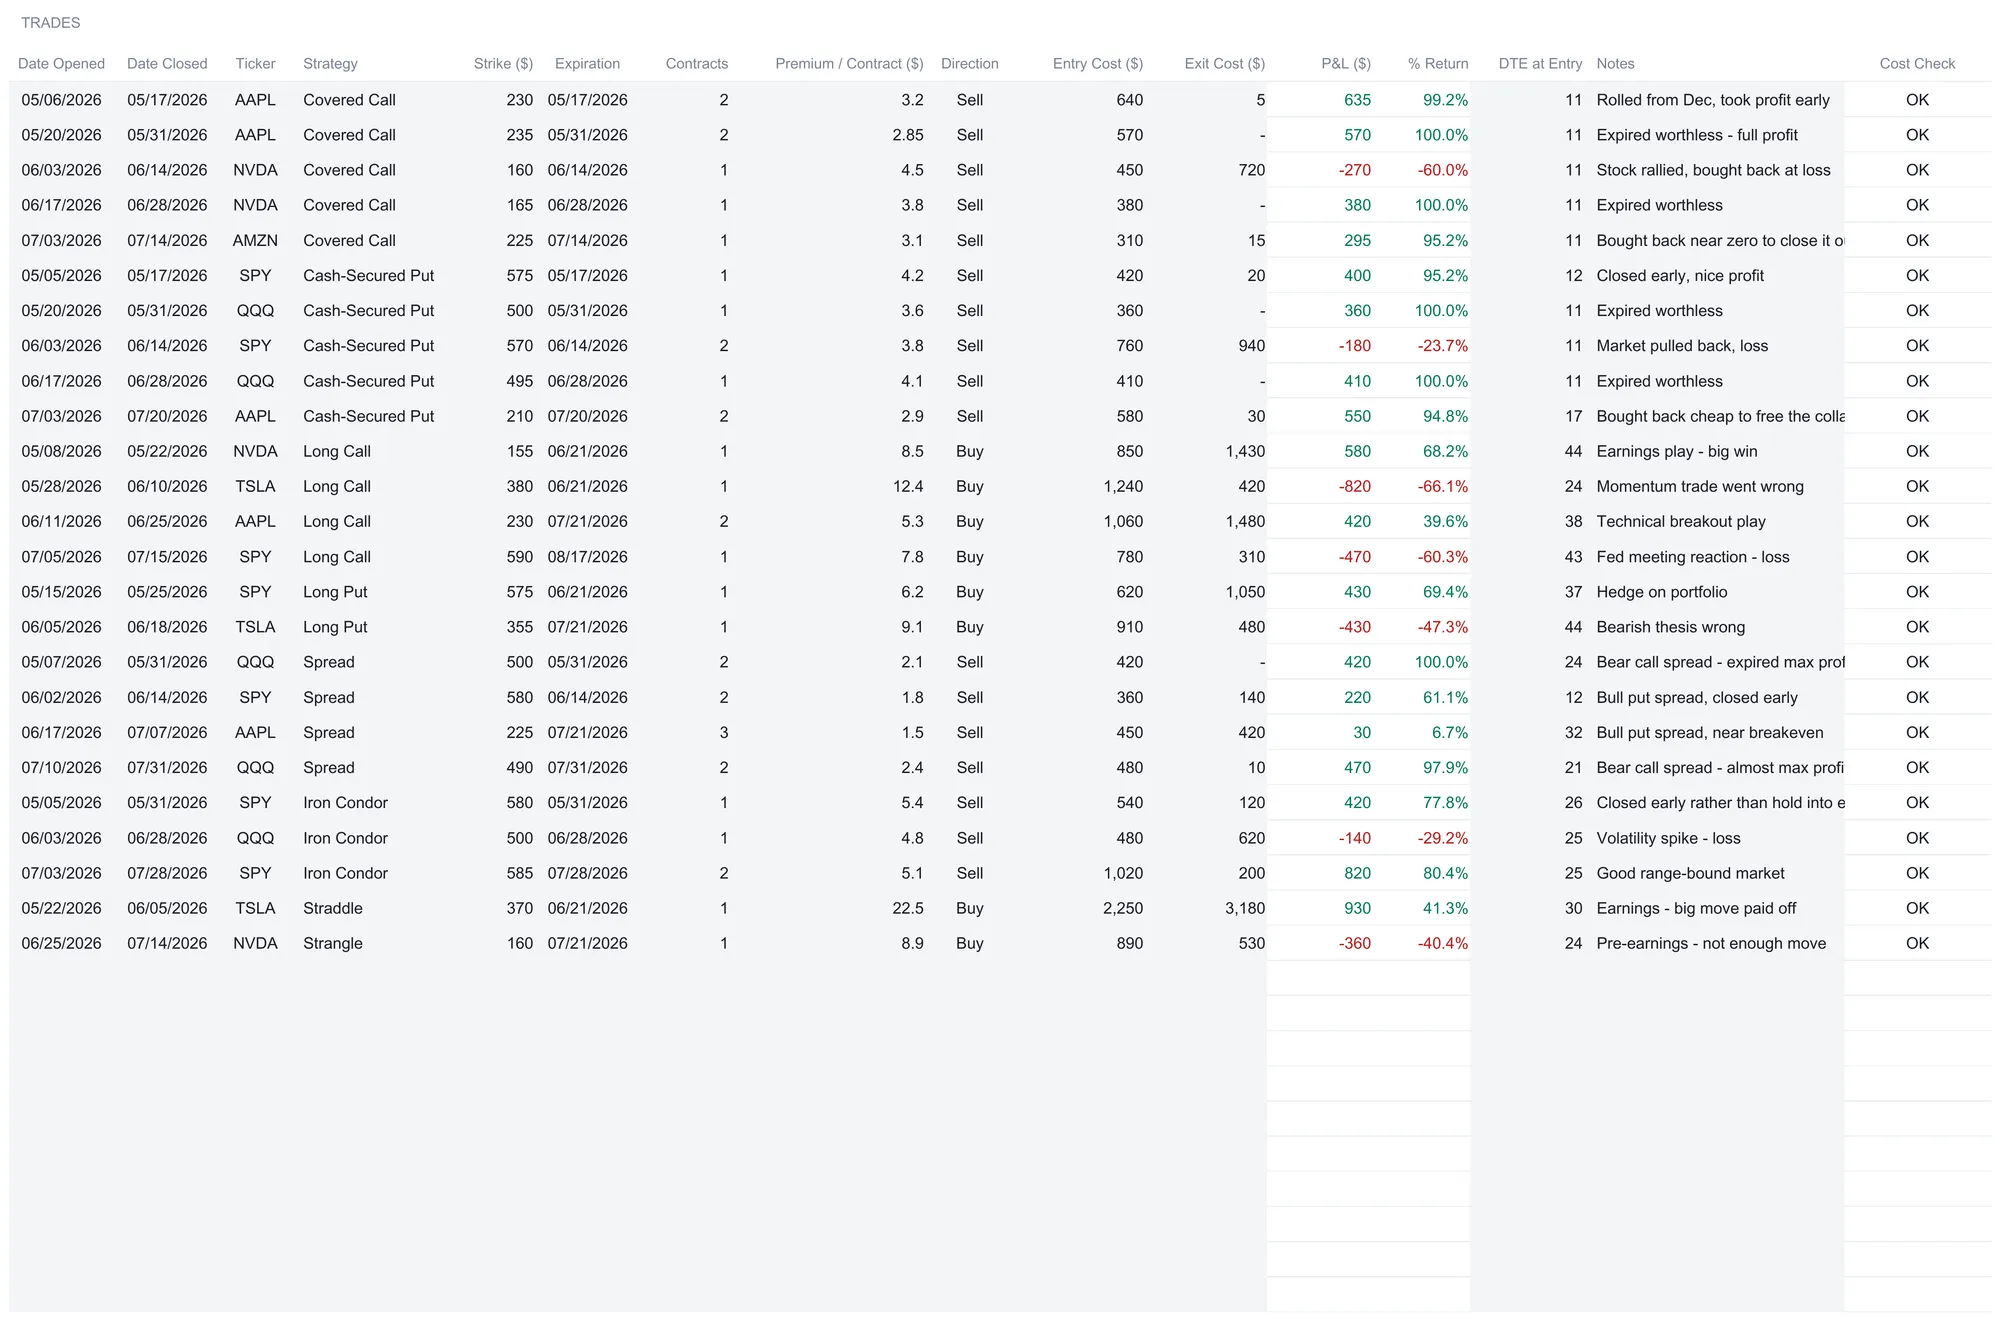
Two rows from the sample log make the flow concrete, one in each direction. The first is a sold covered call on AAPL, opened May 6 at the 230 strike across 2 contracts, with a premium of $3.20 per contract. At 100 shares a contract that is an entry credit of $640, computed as 3.20 times 2 times 100, which is what Cost Check verifies. The position was bought back for $5, so the P&L is 640 minus 5, or $635, a 99.2% return on the credit, closed 11 days after it was opened. A bought trade runs the other way. A long call on NVDA, opened May 8 at the 155 strike on 1 contract at $8.50, cost $850 to enter. It was sold for $1,430, so the P&L is 1,430 minus 850, or $580, a 68.2% return, tagged in the notes as an earnings play. The largest single winner in the sample is a bought TSLA straddle that cost $2,250 and closed for $3,180, booking $930.
Two design details are worth copying into any hand-built version. First, the spare rows are pre-wired. The Trade Log carries the P&L, % Return, and Cost Check formulas down the full sheet, so the next trade goes on the first free row and the totals update with no formula to drag and no range to extend. Second, everything downstream reads this one log. A totals row at the bottom sums the P&L column and the contract count and averages the % Return column, while the Strategy Analysis sheet computes the win rate as the count of positive trades over the closed-trade count. Across the 25 sample trades that comes to $5,670 of net P&L across 36 contracts, an average return of 44%, and a 72% win rate, meaning 18 of the 25 closed above zero. Those figures are the ones every other sheet is built to explain from a different angle.
What the log does not do is fill itself. There is no connection to a broker and no fill import, so every trade is a handful of typed cells after you close it. For a few trades a week that is a couple of minutes. For someone running dozens of contracts a day it is real work, which is what execution-platform analytics exist to remove. The tradeoff is automation against control. A connected tool suits traders who want the data to arrive on its own. A spreadsheet suits traders who want to read every formula, change any of them, add a strategy label the software never heard of, and keep the file on their own machine.
Read the log by setup: the Strategy Analysis
The Strategy Analysis sheet groups the same trades by the label in the Strategy column. The Trade Log dropdown carries nine fixed labels, eight named setups, Covered Call, Cash-Secured Put, Long Call, Long Put, Spread, Iron Condor, Straddle, and Strangle, plus Other for anything outside them, and the sheet gives each label its own row. For each it computes total P&L, closed-trade count, win rate, average P&L per trade, and an average percentage return. Every figure is computed; there is nothing on the sheet to type.
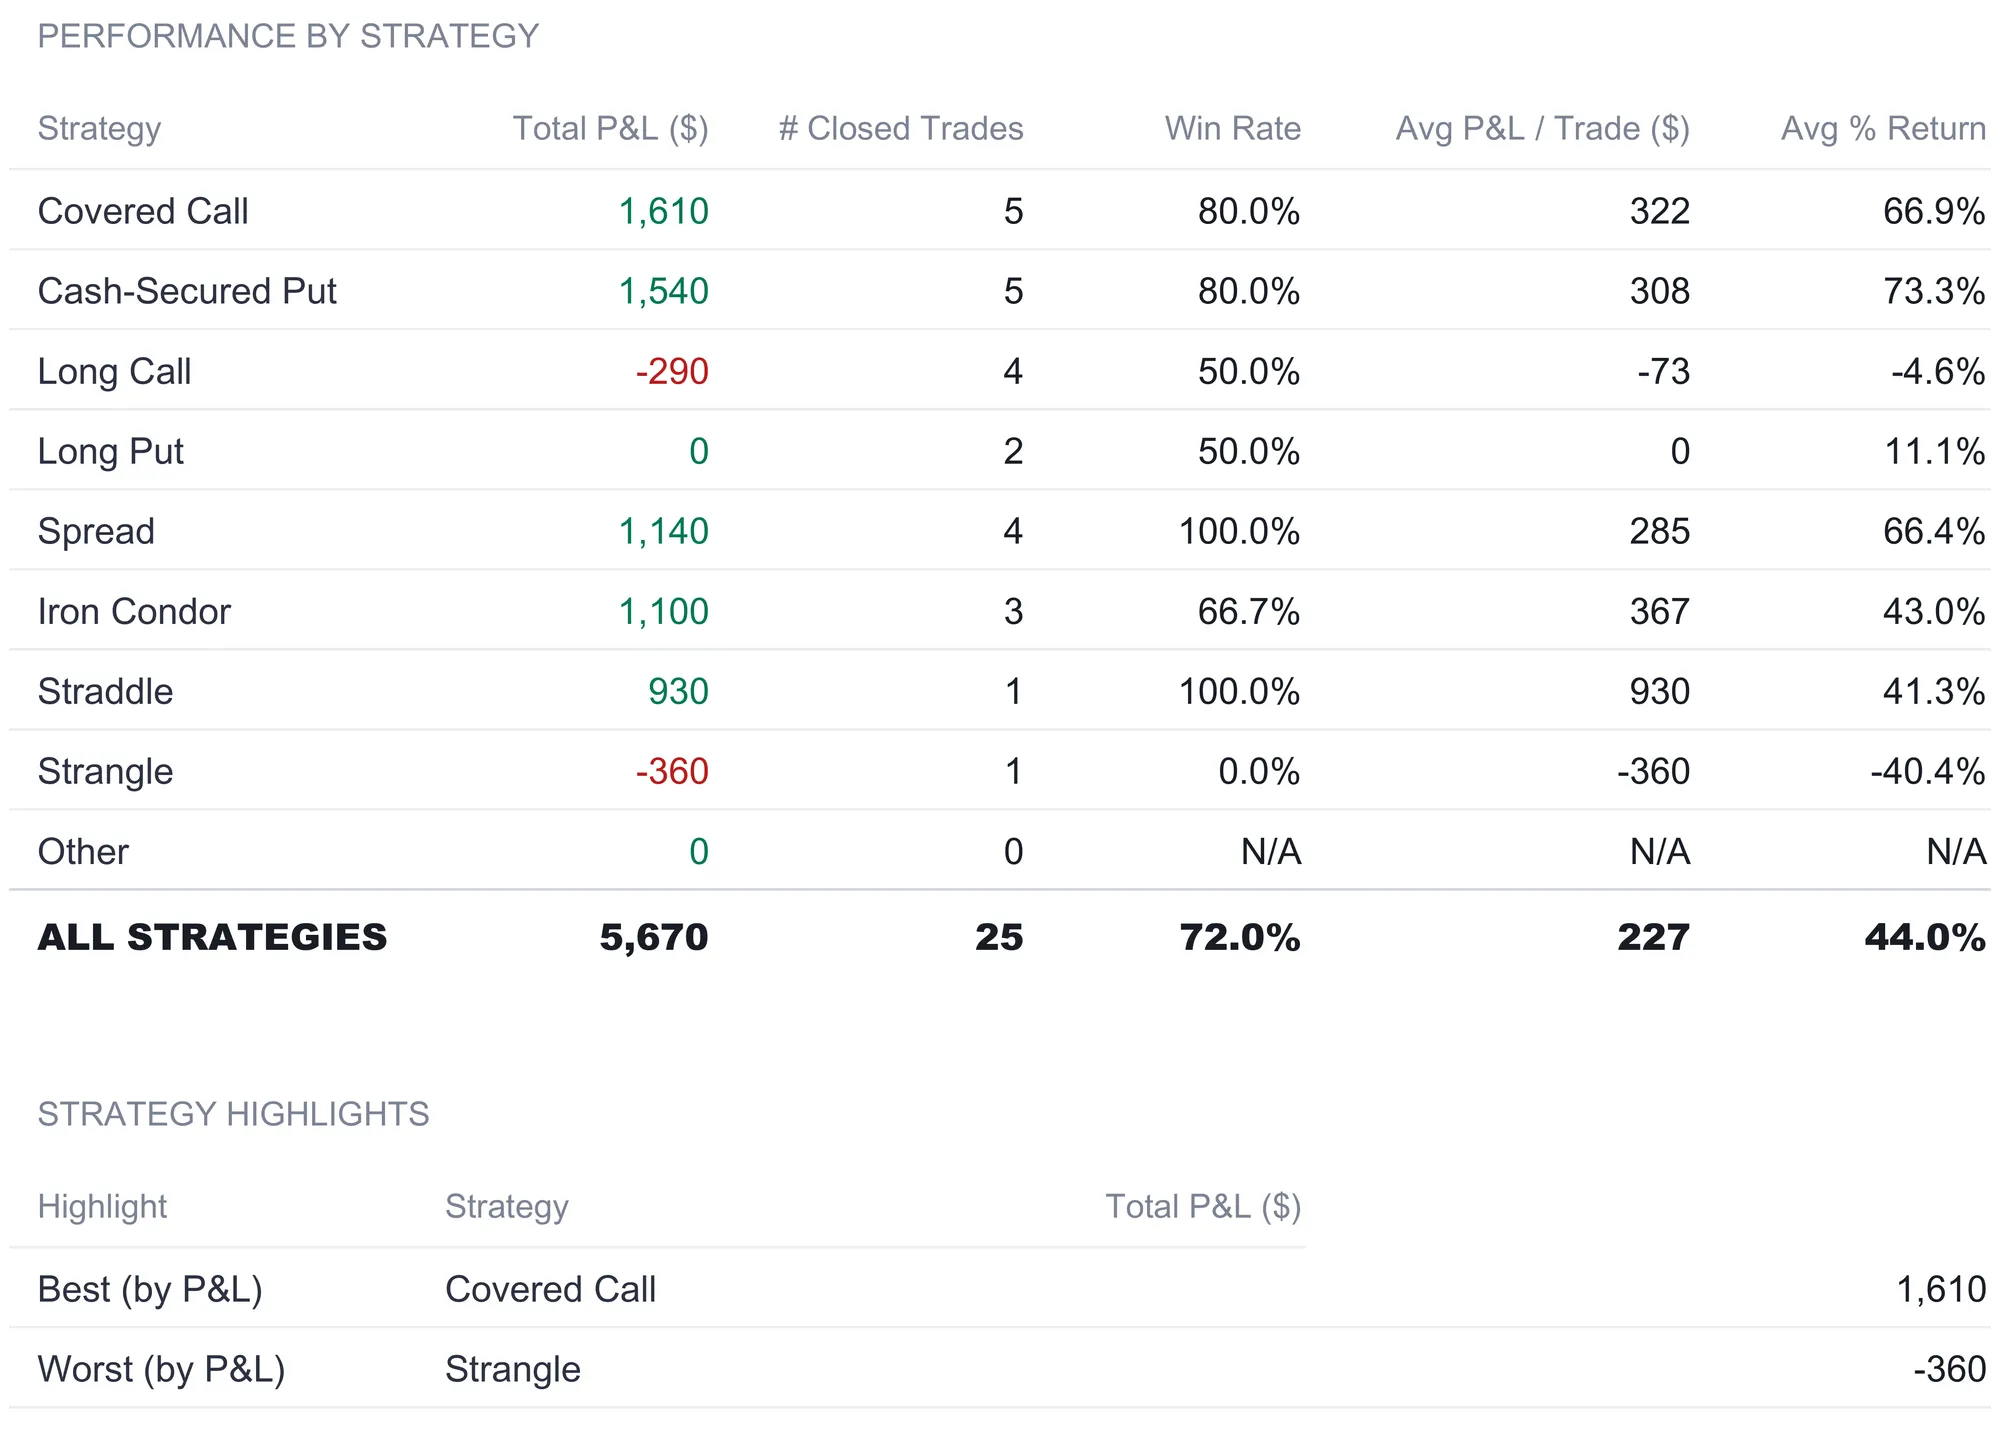
The sample spreads its 25 trades across eight setups, and the spread is where the sheet earns its place. The two premium-selling strategies carry the record. Covered Call posts $1,610 across five trades at an 80% win rate, and Cash-Secured Put posts $1,540 across five trades, also at 80%, together a little over half the total from two setups. The directional buys are choppier: Long Call nets -$290 across four trades at a 50% win rate, dragged down by an $820 loss on a TSLA call, and Long Put comes out exactly flat, a $430 winner and a $430 loser netting to zero across two trades. Spread shows the cleanest record, four trades all green for $1,140, while Iron Condor adds $1,100 across three. The two volatility plays split hard: a single Straddle books $930 and a single Strangle loses $360. An ALL STRATEGIES row reconciles to $5,670 across 25 trades at a 72% win rate and a 44% average return, the same totals every other sheet reaches. Below the table, a Strategy Highlights block names the extremes outright: best by P&L is Covered Call at $1,610, worst by P&L is Strangle at -$360.
A word of care about how to read that. These figures describe this particular sample log and nothing beyond it. A setup that shows a 100% win rate across four recorded trades is a fact about four trades, not evidence that it will keep winning, and a single-trade row like the Straddle or the Strangle is one outcome, not a pattern. A small sample can flatter or punish any label by chance. What the sheet does is make your own history legible so you can see how each label you use has actually landed. It does not rank the setups for you as things to trade, and it makes no claim about what any of them will do next.
The average-return column is worth reading alongside the P&L rather than instead of it. The premium-selling rows post the highest average returns, because a sold option that expires near zero returns most of a small credit. That is a large percentage on a small base, and it sits next to a modest dollar figure. The bought TSLA straddle gained about 41%, its $930 booked on a $2,250 entry cost, a smaller percentage on a much larger base. Percentage return and dollar P&L answer different questions, and the sheet reports both so neither tells the story alone.
Read the log by month: the Monthly P&L
The Monthly P&L sheet rolls the same trades into calendar buckets, January through December, keyed on the Date Closed column. A Journal Year cell at the top scopes it: set the year, and every month row follows the trades whose closing dates fall inside that year, and the same cell moves the Expiration Calendar too. Each month shows three numbers, the monthly P&L, a running cumulative P&L, and the count of closed trades. Every figure is computed from the Trade Log, none of it typed.
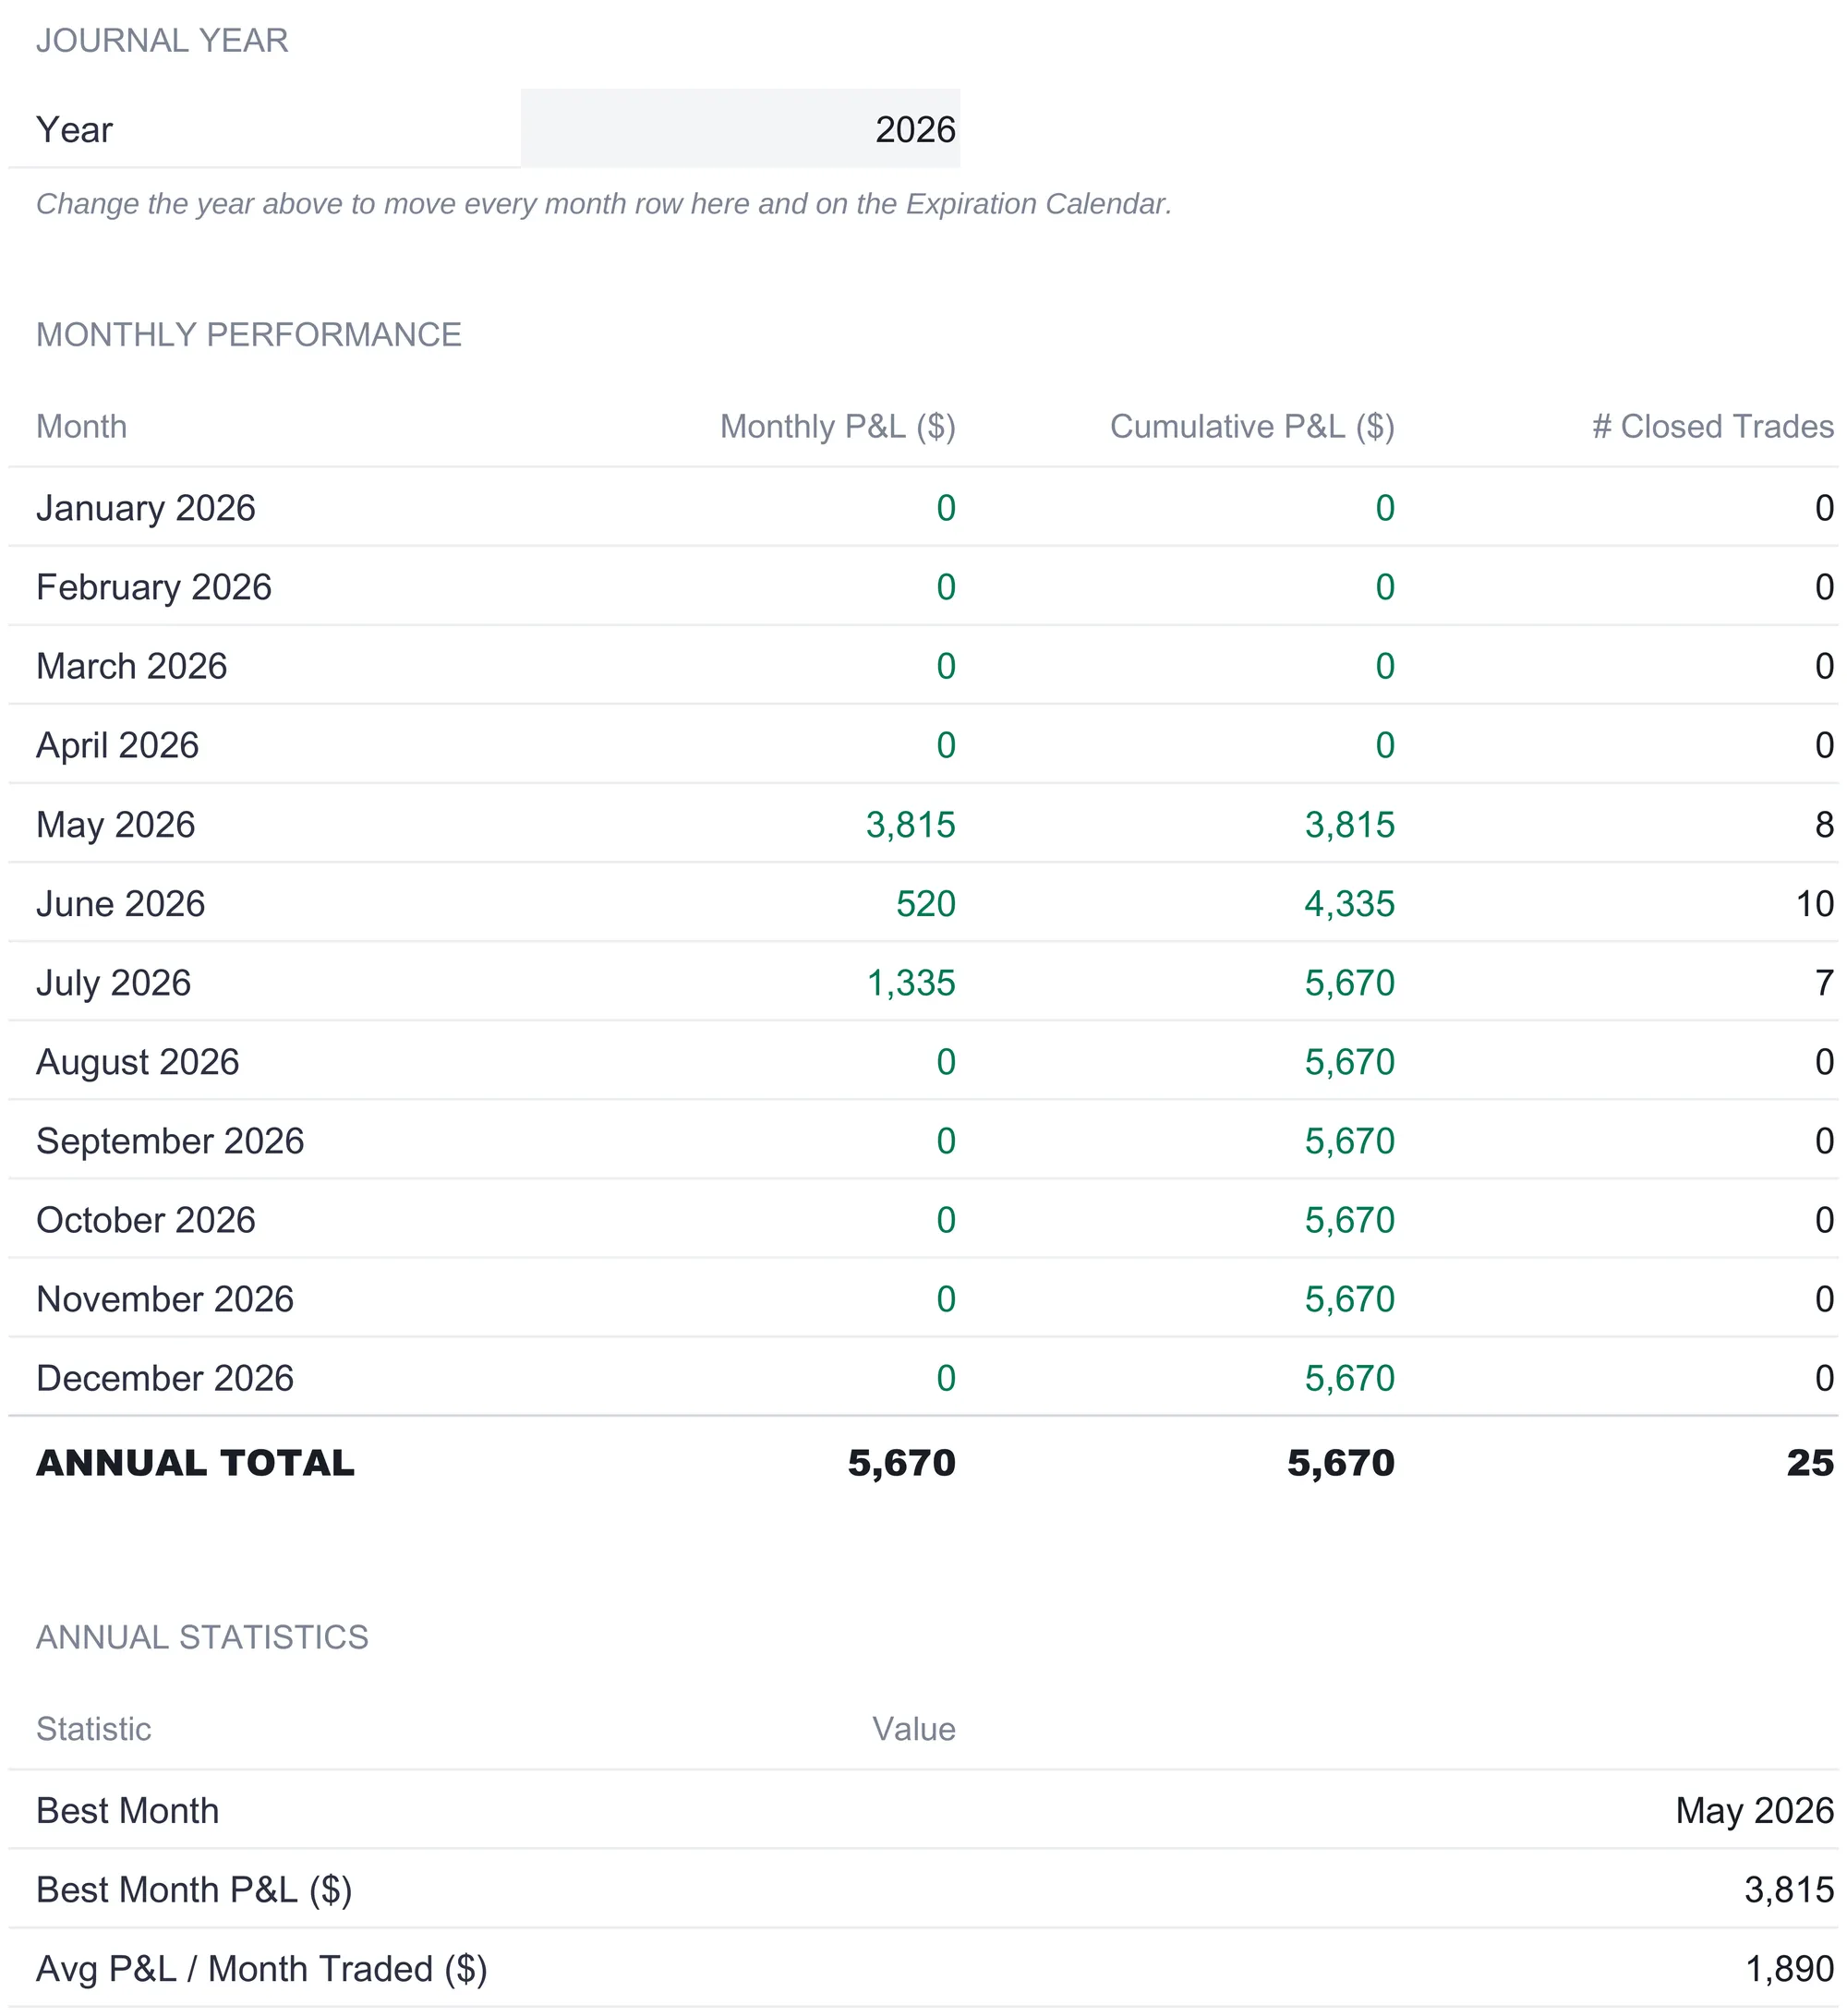
The sample trades all close inside a single spring-to-summer window, so the grid concentrates the activity into three rows. May closes at $3,815 across 8 trades, June at $520 across 10, and July at $1,335 across 7, and the nine other months sit at zero because no sample trade closed in them. The cumulative column tracks the running total down the sheet, reading $3,815 after May, $4,335 after June, and $5,670 after July, where it stays for the rest of the year. An Annual Total row reconciles to $5,670 across 25 closed trades. Below it, an Annual Statistics block distills the year to a few figures: the best month is May 2026 at $3,815, and the average P&L per month traded is $1,890. That average is taken over the three months that carried trades, which is why $5,670 across three active months reads as $1,890 rather than being diluted by the empty ones.
The month-by-month cut is worth having next to the strategy cut because it surfaces a different thing. June is the busiest month by trade count, ten closed trades, yet it is the smallest by P&L at $520, because a couple of losing directional trades landed in it. That kind of divergence, high activity paired with a low result, is exactly what a single running total hides and a monthly grid shows.
Track what expires next: the Expiration Calendar
Where the Monthly P&L sheet buckets by when a trade closed, the Expiration Calendar buckets by the Expiration column, which is a different date entirely. An option can be closed weeks before it expires, so grouping on expiration answers a forward-looking question a P&L sheet cannot: how much is scheduled to come off the board in each month, and how much premium is tied to it.
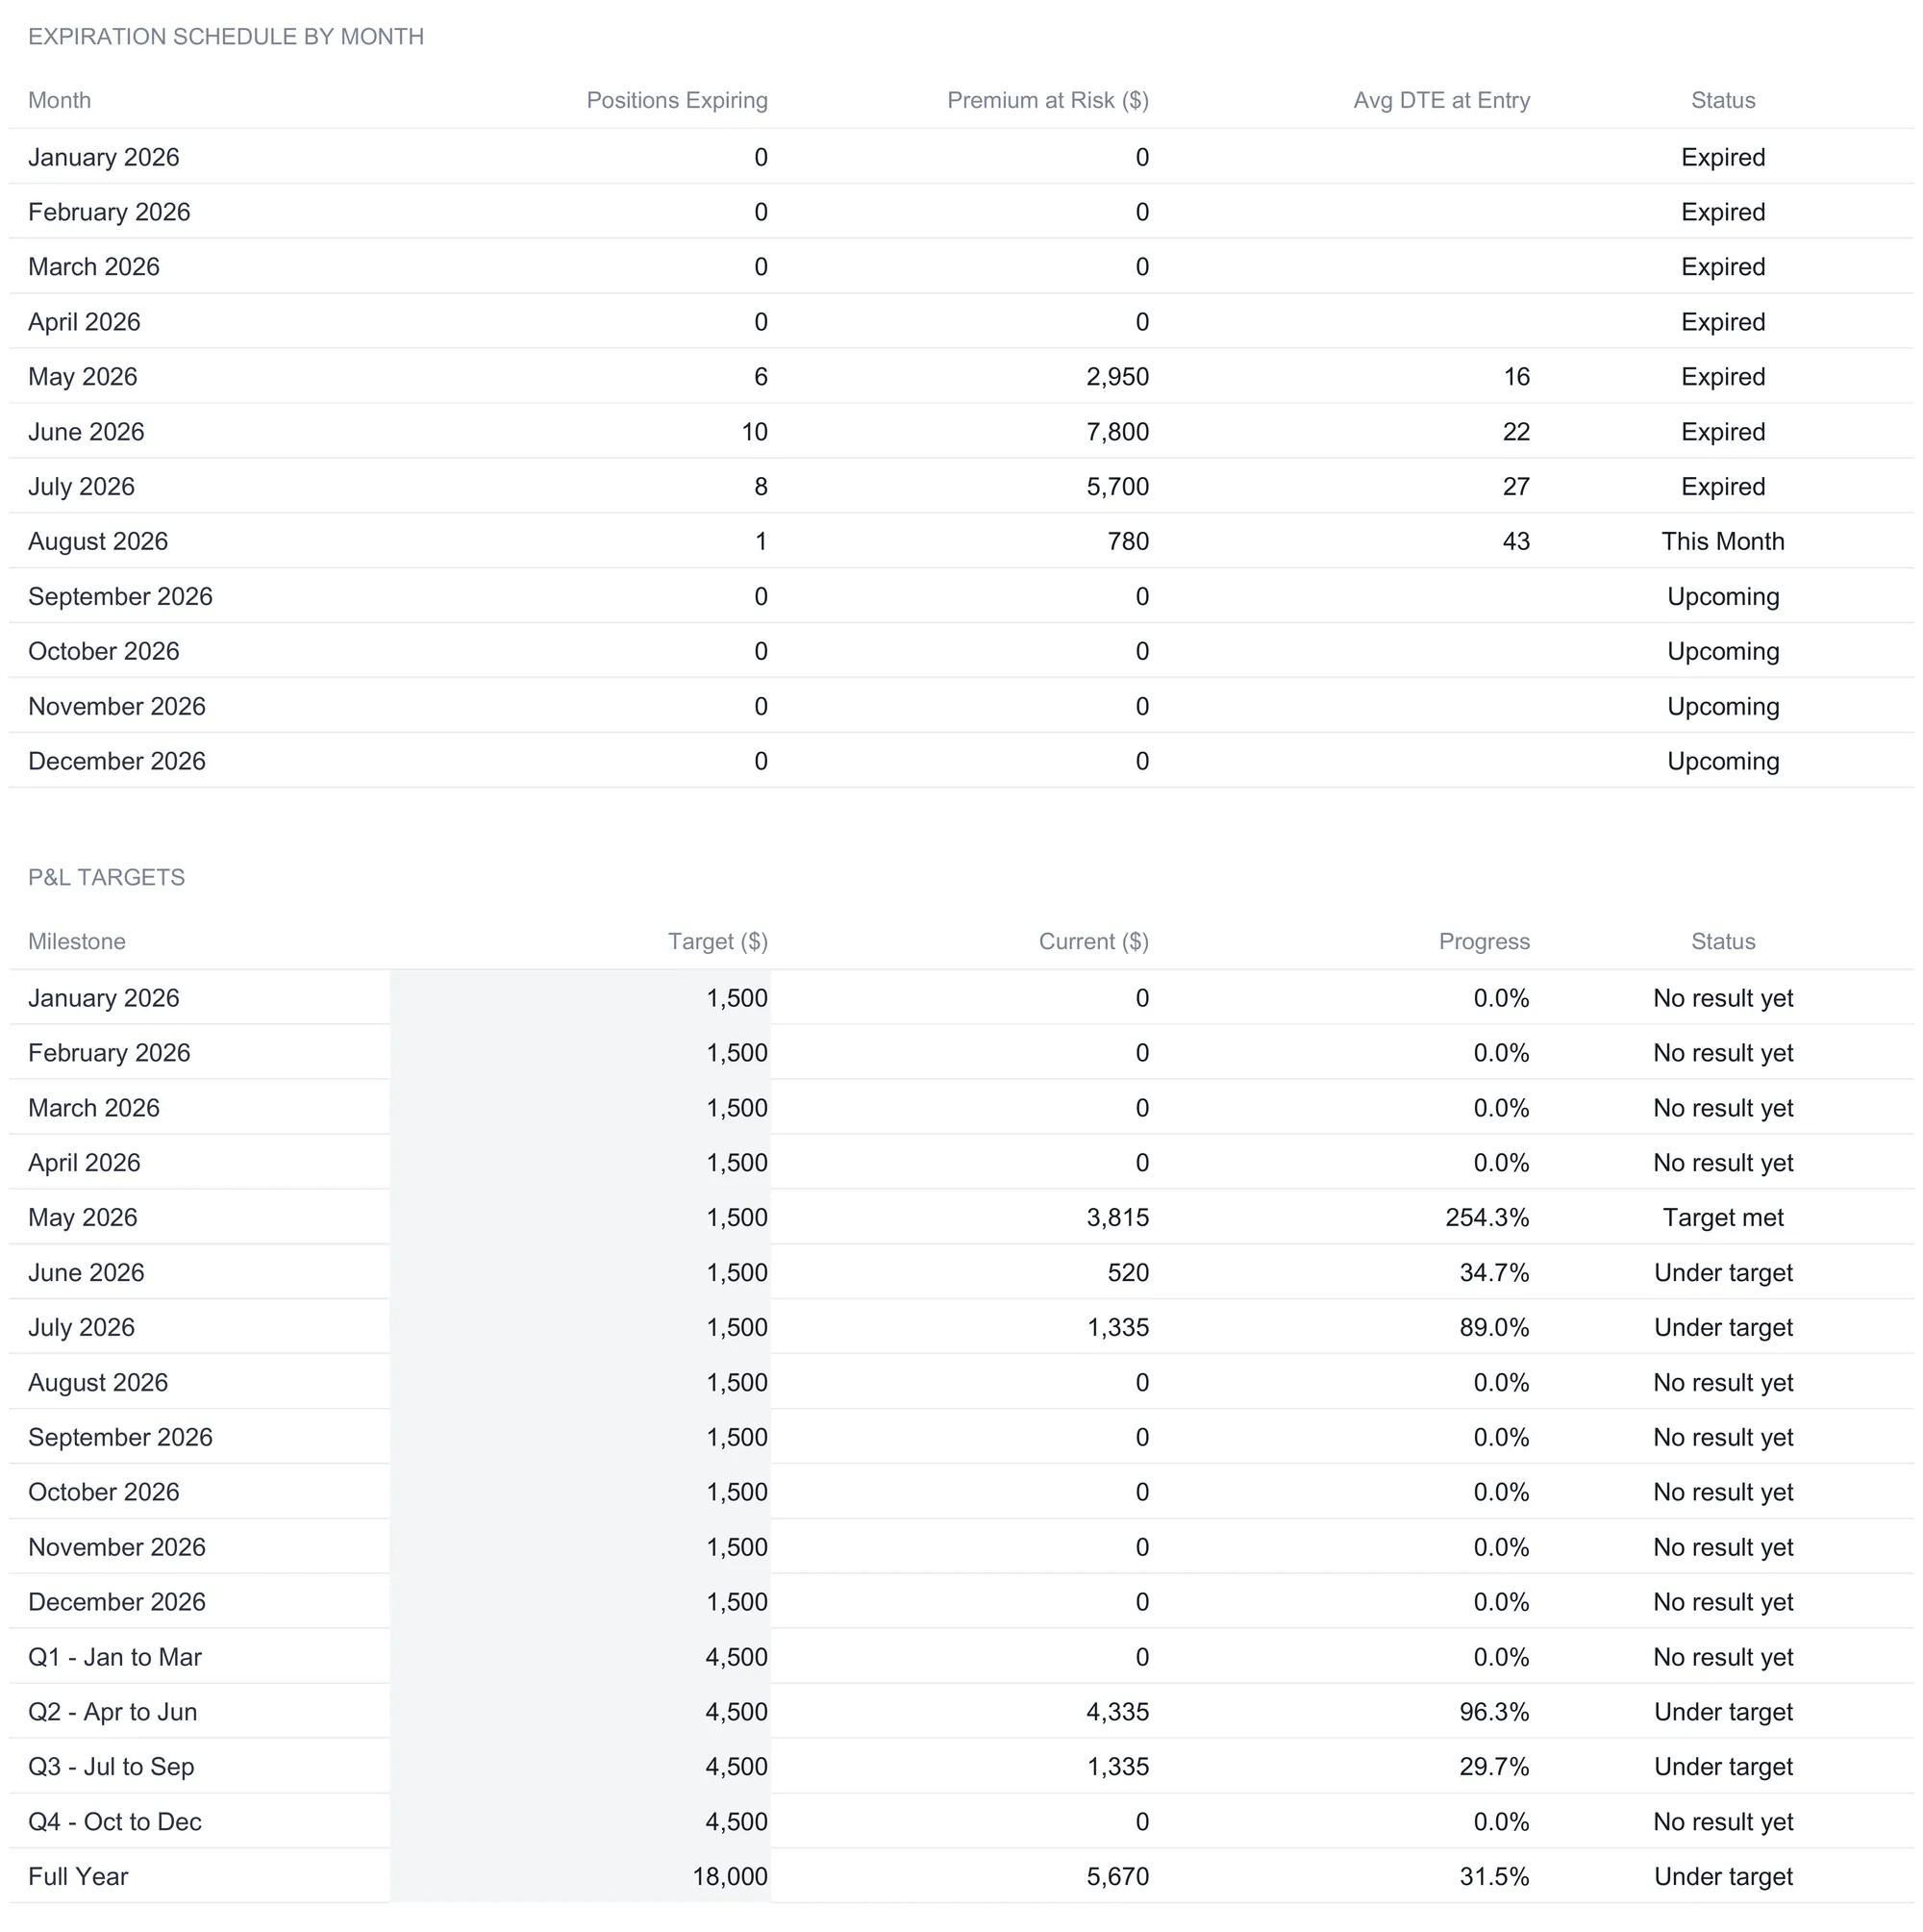
For each month the sheet counts the positions expiring, sums their entry cost as Premium at Risk, averages the days-to-expiration those trades carried at entry, and prints a status. In the sample, May shows 6 expirations at $2,950, June 10 at $7,800, July 8 at $5,700, and August a single position at $780, and the counts sum to the same 25 trades the log holds. June is the heaviest expiration month, the same month that was busiest by closed-trade count, and its higher premium at risk reflects the larger positions dated into it. The average DTE at entry climbs across the window, shortest on the May expirations and longest on the lone August one, which reads the sample’s shift from short-dated income trades toward the longer-dated directional and volatility plays. The Status column compares each month against today’s date and labels it Expired, This Month, or Upcoming, with No Expirations on the months that have nothing dated into them, so the labels move as the calendar advances rather than being fixed text.
Below the schedule sits a P&L Targets table, and this is the one place on the sheet you type into. It carries a Target column you can edit for each month, each quarter, and the full year, and a Current column that reads the closed-trade totals from the Monthly P&L sheet. Out of the box the monthly targets are set to $1,500, the quarterly to $4,500, and the full year to $18,000, and the sheet computes progress and a status against whatever you enter. In the sample, May clears its $1,500 target and reads Target met at 254%, June and July come in under, and the full-year row shows $5,670 against the $18,000 target, or 31.5%, marked under target. These are goalposts you set for yourself, not a projection the sheet makes, and the status simply compares the logged result to the number you typed.
Watch the open book: the Greeks Tracker
Every sheet so far reads closed trades. The Greeks Tracker is the exception, and it holds the other half of an options record, the positions still on. It is a manual sheet: for each open position you type the ticker, the strategy, and the four Greeks, delta, gamma, theta, and vega, along with the contract count. These are not pulled from a feed, because an option’s Greeks change continuously with the underlying and with time, so the sheet is a snapshot you refresh rather than a live readout.
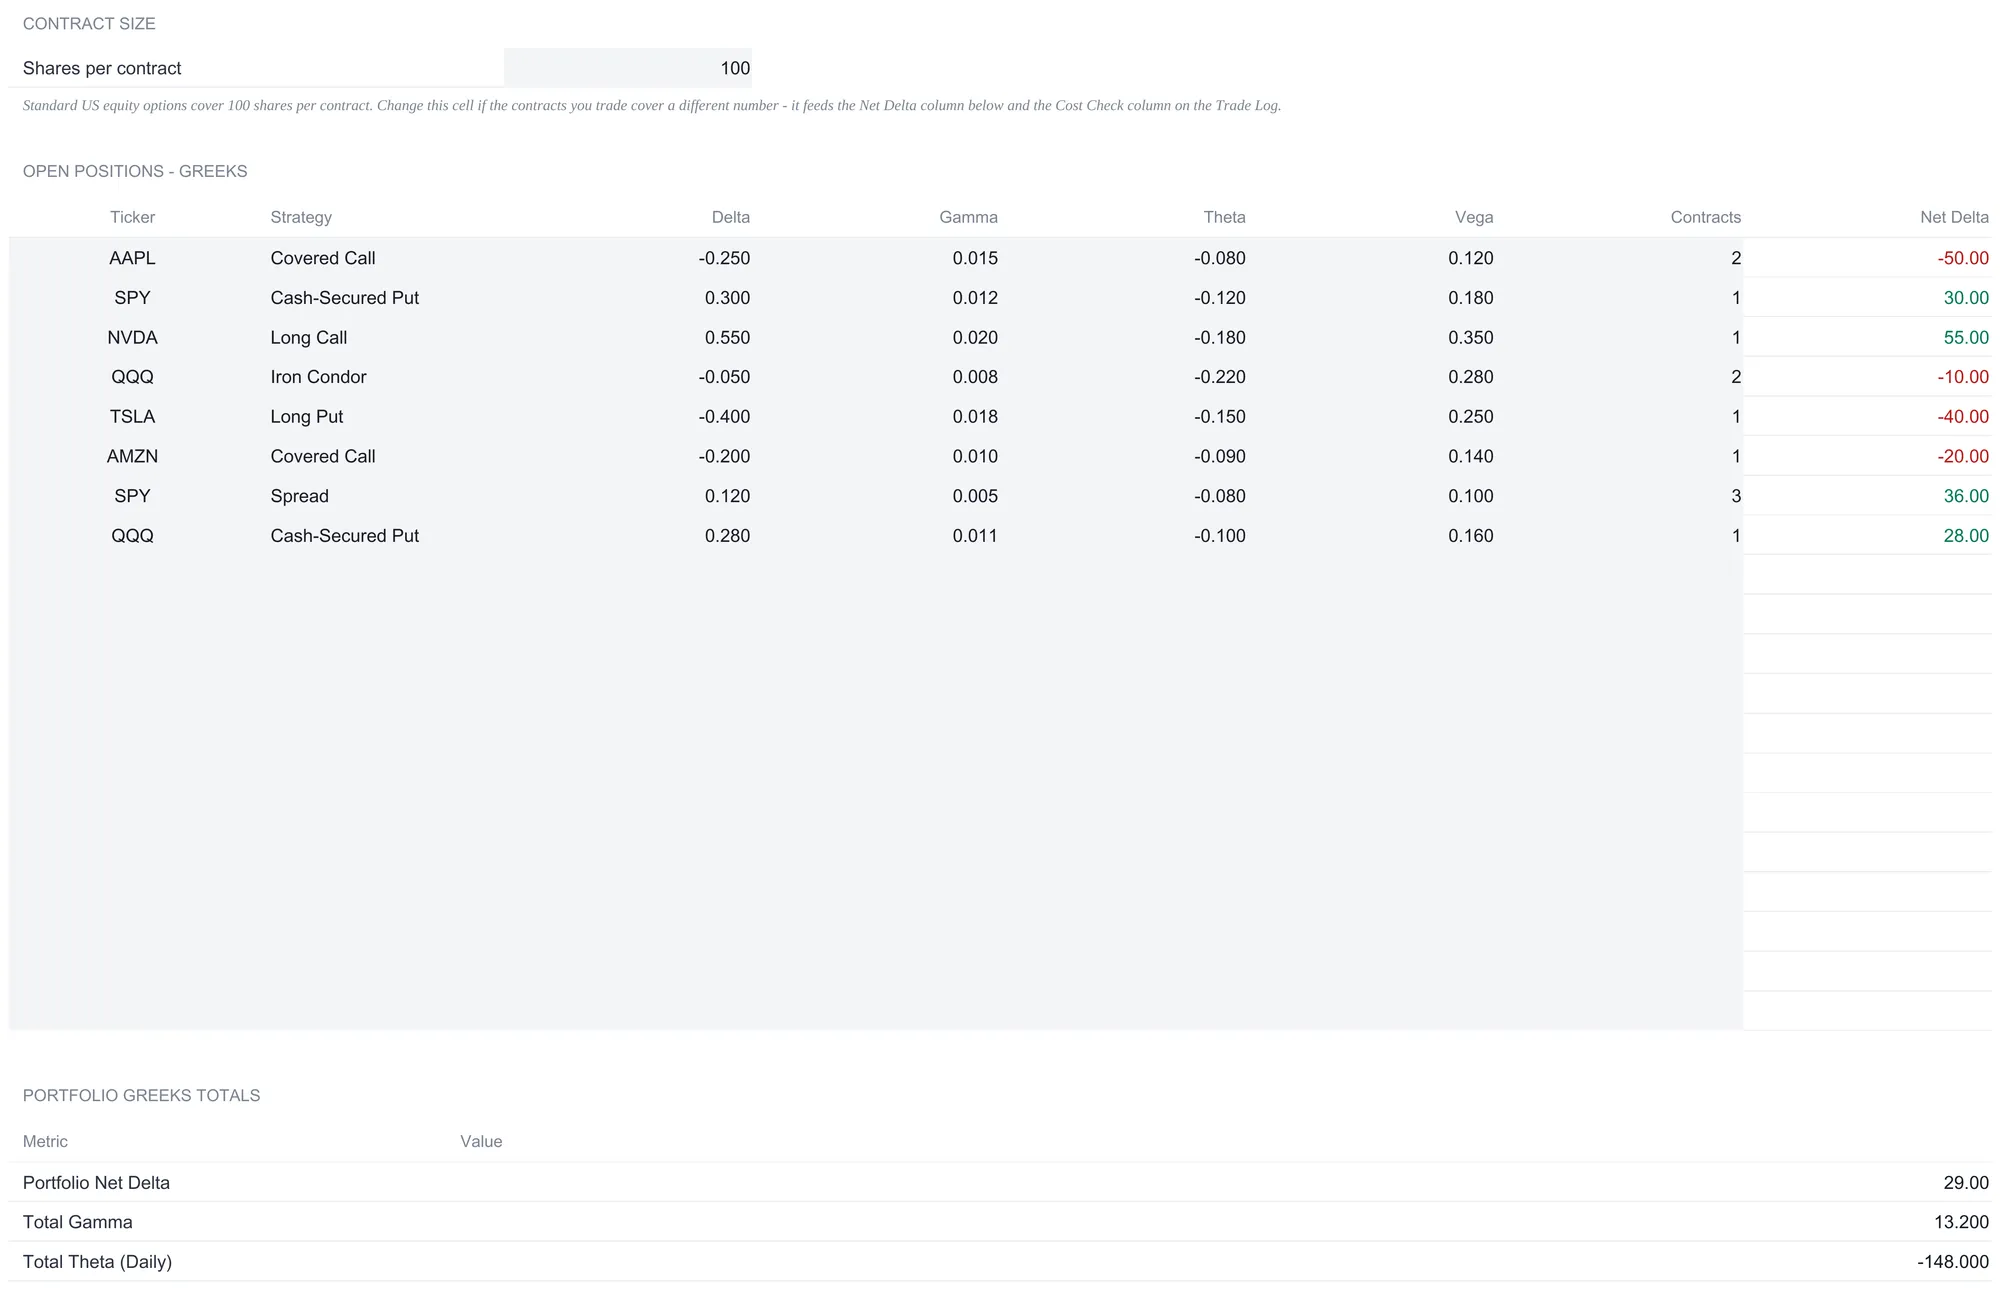
One input at the top drives the scaling. A Shares per contract cell, set to 100 for standard US equity options, feeds both the Net Delta column here and the Cost Check column back on the Trade Log. The Net Delta column then multiplies each position’s delta by its contract count and by that shares figure, so a long NVDA call with a 0.55 delta on one contract shows a net delta of 55, meaning the position moves roughly like 55 shares of the stock. The sign carries the direction: the sample’s short calls and long puts show negative net deltas, the long calls and short puts positive ones. A Portfolio Greeks Totals block sums the open rows: across the eight sample positions the portfolio nets to a delta of 29, a gamma of 13.2, and a daily theta of -148. Read together, a small positive net delta says the open book leans slightly long, and a negative theta says time decay is working against the net position day by day. Those are descriptions of exposure on positions that are still open. They are not the closed P&L, and they are not a forecast of where any of the positions will end up.
The dashboard: six numbers and the setups behind them
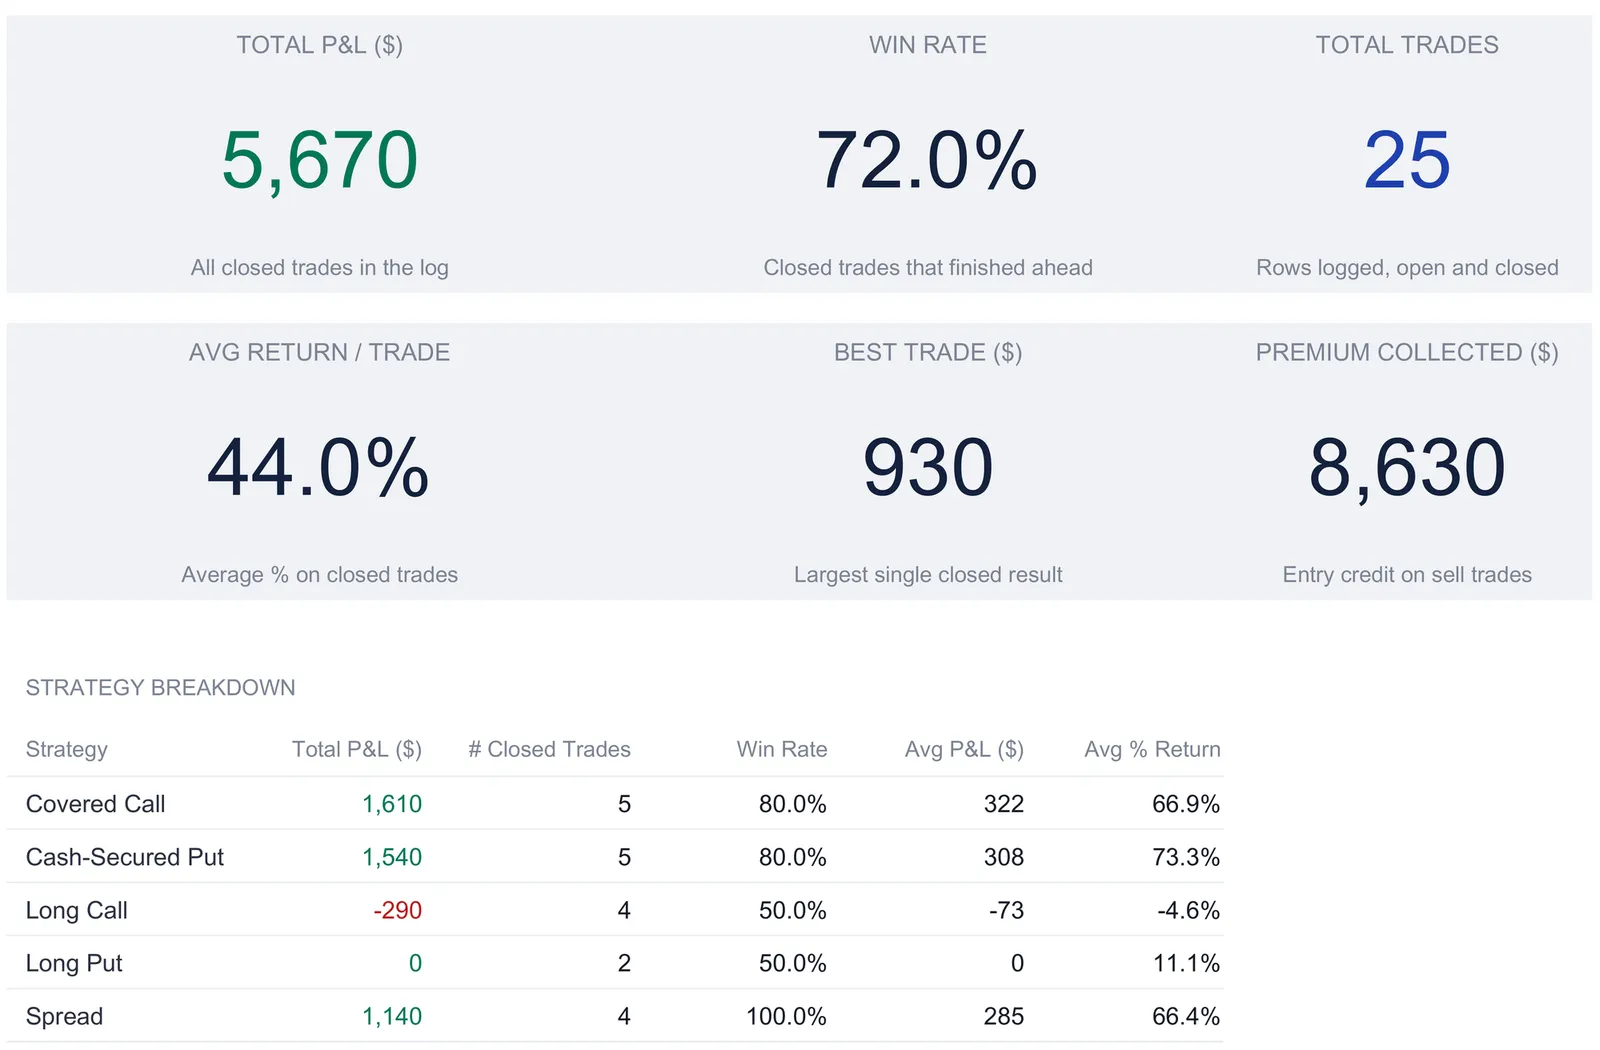
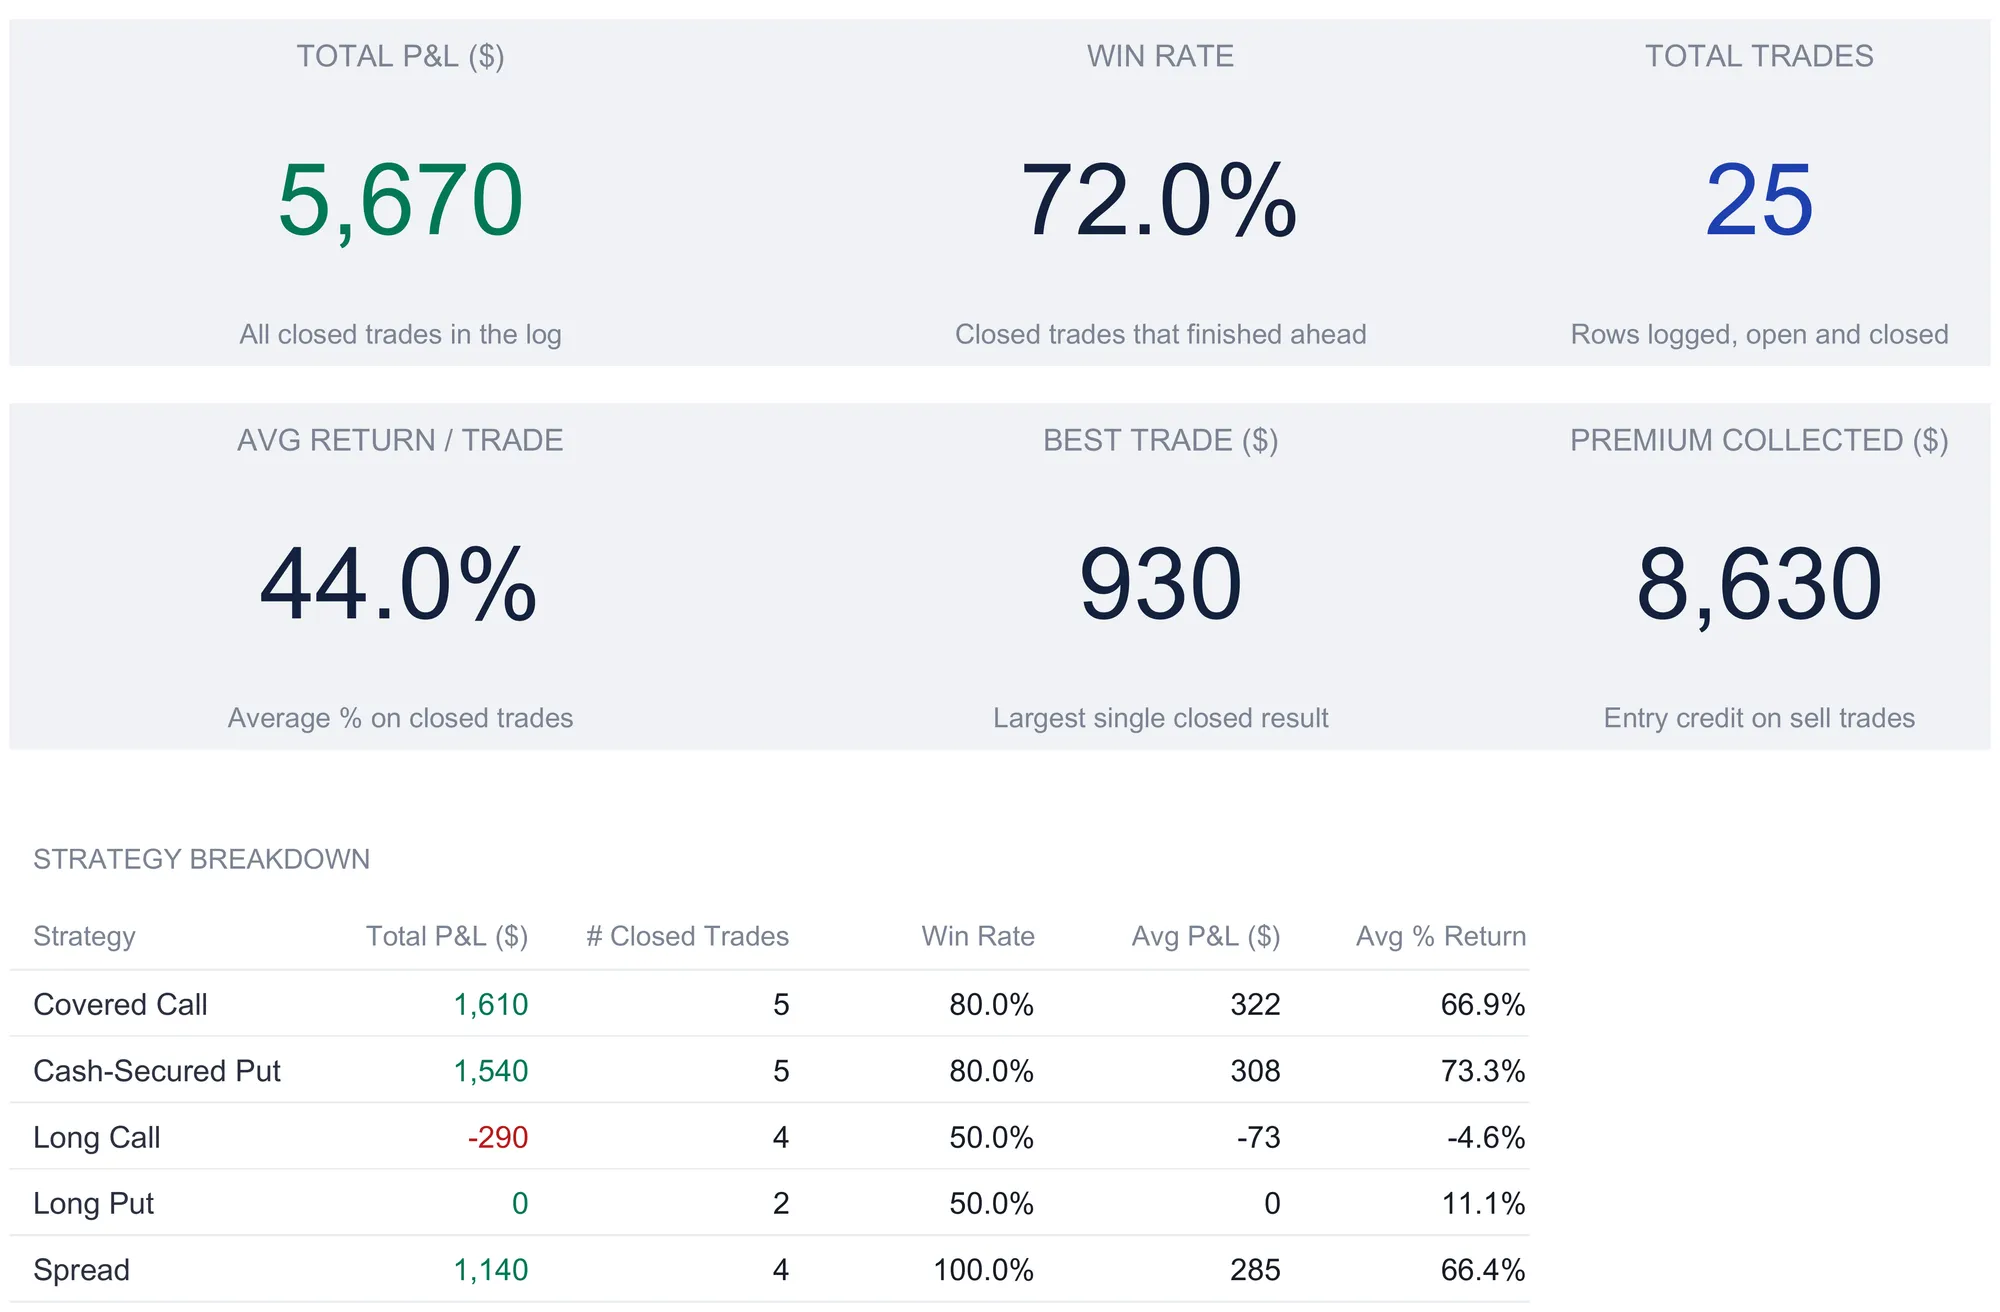
With the Trade Log filled, the Dashboard on top computes the record at a glance. Six KPI tiles carry the headline figures, all read from the log or the strategy sheet: a total P&L of $5,670, a 72% win rate, 25 total trades, an average return per trade of 44%, a best trade of $930, and premium collected of $8,630. Two of those tiles are worth a note. Total trades counts every row logged, open and closed, and the premium collected tile sums the entry cost of the Sell trades only, the credit taken in on the premium-selling side of the book, which is a different lens than net P&L. The best-trade tile points at the single largest closed result, the TSLA straddle at $930.
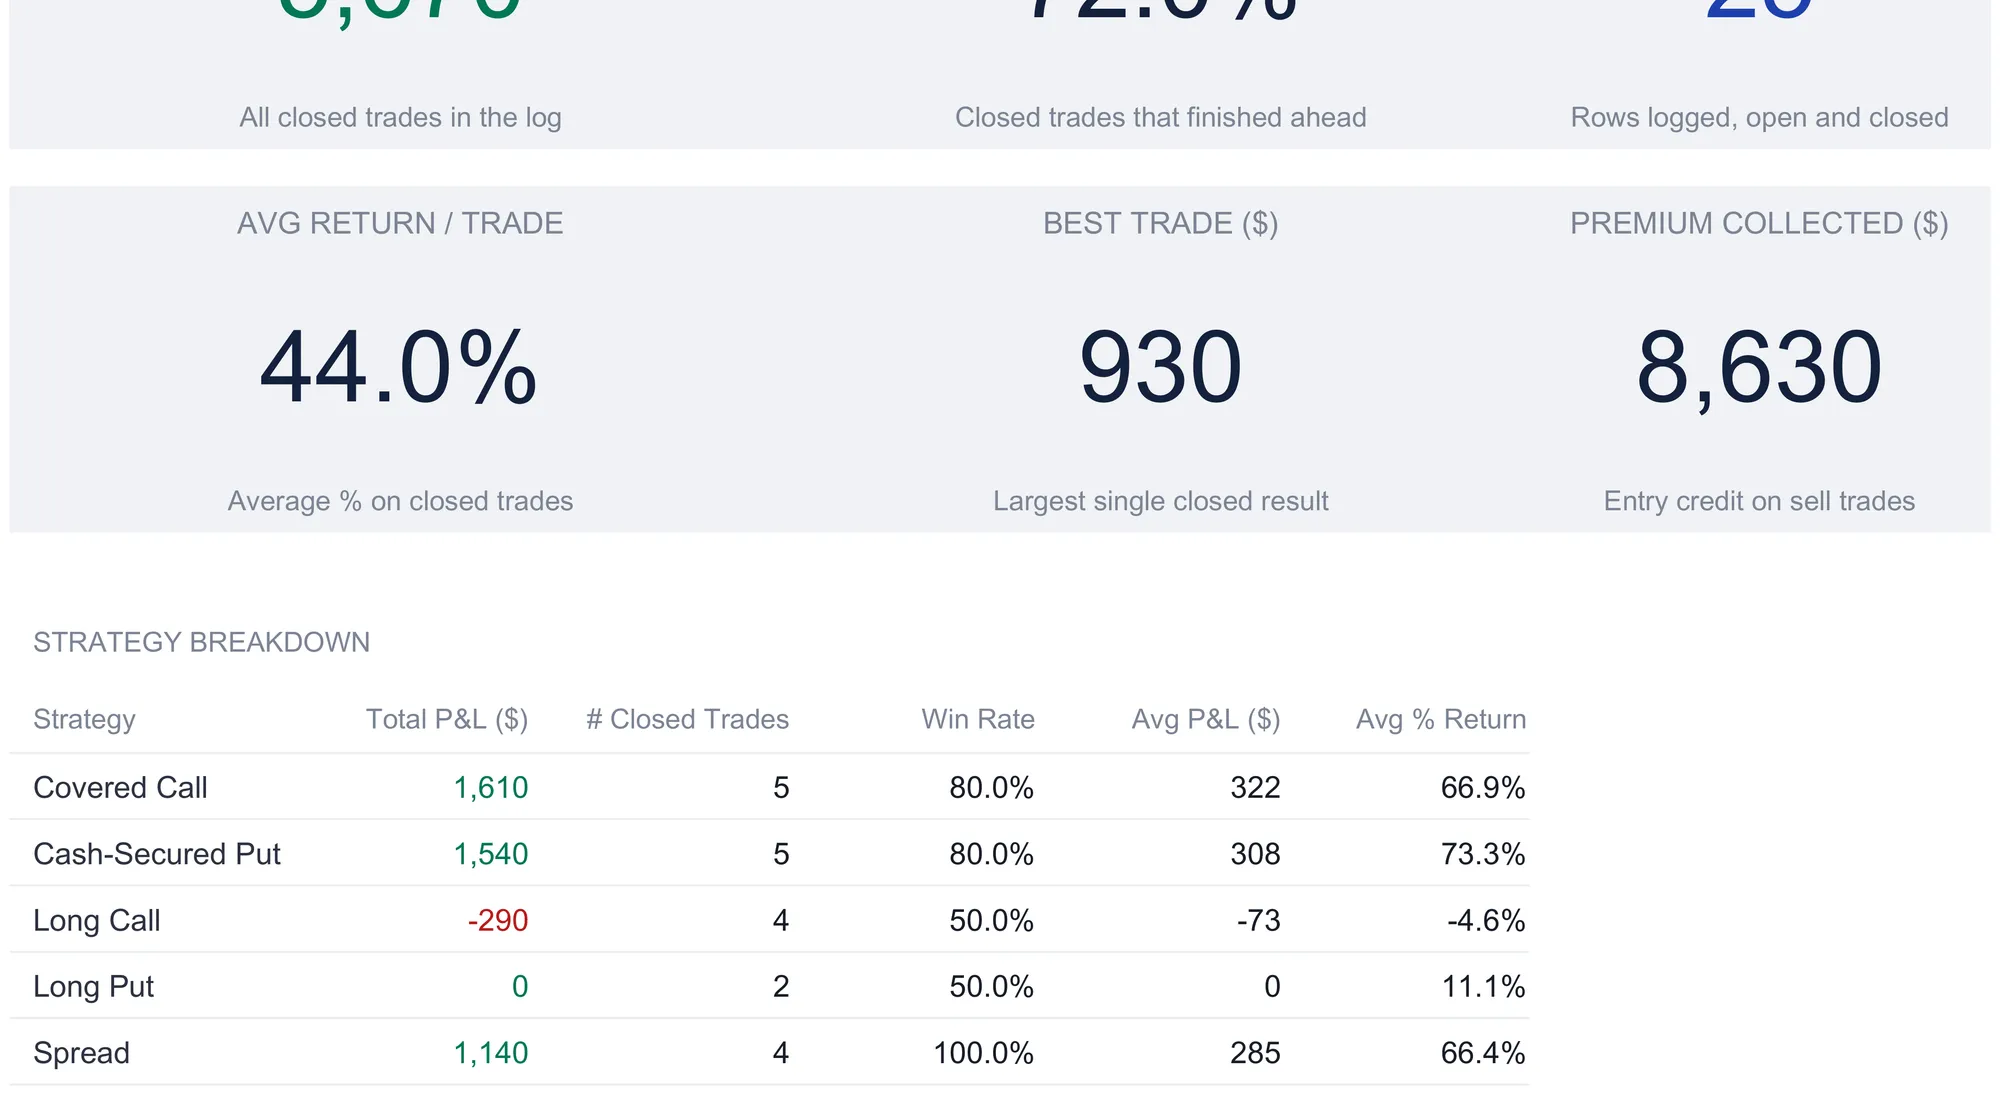
Below the tiles, a Strategy Breakdown table repeats the per-setup view, and a P&L by strategy chart plots the same figures so the Covered Call and Cash-Secured Put contributions read against the Long Call drag visually rather than only as numbers. A currency selector next to the title relabels every money column and KPI across the workbook, with 35 symbols to choose from. It relabels only, with no conversion of the underlying numbers, so switching it changes the currency symbol shown without touching the values.
The point of the dashboard is the same as the point of the whole file: one screen that answers the questions a brokerage statement buries. It shows what the closed book did, how often it did it, which setups were behind the result, and how much premium was collected along the way, all traced back to the one log that everything else reads.
Excel or Google Sheets for an options trading journal
The journal is an .xlsx file built on standard formulas, with no macros and no add-ons, so it runs the same way in Microsoft Excel, in Google Sheets after upload, and in LibreOffice Calc. The aggregation leans on SUMIF, COUNTIFS, SUMIFS, and SUMPRODUCT, all of which have worked in Excel for years and behave identically in Sheets. Google Sheets suits traders who log from a phone or want the file reachable from any browser; Excel suits those who prefer a local file and heavier keyboard work. The structure described here is equally buildable in either, and the download opens in all three without a conversion step.
Where the numbers go at tax time
For US filers, an options record maps onto tax reporting, though the exact path depends on the contract and on how the activity is classified. Most option gains and losses are capital gains and losses reported on Schedule D and Form 8949, the wash-sale rules can apply, and certain index options fall under separate Section 1256 treatment. On top of that, the IRS distinguishes an investor from a trader in securities, a line that turns on the nature, frequency, and intent of the activity rather than on any single trade. IRS Topic no. 429 sets out that distinction and notes that those who qualify as traders have additional choices such as a mark-to-market election under section 475(f). Which path applies is a determination for a tax professional, not a spreadsheet. What the journal does is get you there with the raw material already gathered: every trade dated, priced, and totaled, so filing prep becomes a copy job rather than a reconstruction from broker confirmations.
Which journal fits which trader
- The free Options Trading Journal is a single options log where you enter each closed position’s P&L yourself, with a running total and a position count at the top, which fits someone who wants to start recording contracts before deciding whether the analysis sheets are worth it.
- The Options Trading Journal Essentials ($19) adds a Dashboard on top of a leg-by-leg log, so total P&L, win rate, positions closed, best and worst position, and a calls-versus-puts split compute without the deeper strategy, monthly, expiration, and Greeks sheets.
- The Options Trading Journal Ultimate Spreadsheet Template ($29) is the workbook this walkthrough follows in full: the trade log, the strategy breakdown, the monthly calendar, the expiration calendar with P&L targets, the Greeks tracker, and the six-metric dashboard, all reading from one log.
- The Stock Trading Journal Ultimate Spreadsheet Template ($29) applies the same one-log structure to shares instead of contracts, swapping the strike, premium, expiration, and Greeks fields for entry and exit prices and a share count, for traders working equities rather than, or alongside, options.
Related
- How to Keep a Stock Trading Journal in a Spreadsheet - the equities counterpart, where one trade log drives P&L, win rate, per-ticker and per-strategy stats, and a risk view
- How to Track an Investment Portfolio in a Spreadsheet - the buy-and-hold side, where one holdings list drives allocation, dividends, and returns
- How to Track Investment Returns in Google Sheets (TWR vs MWR) - the two ways to measure a return once deposits and withdrawals are in the mix
Frequently asked questions
Does the journal pull live option prices or track open positions automatically?
No. The Trade Log records trades one row each, with the strike, premium, contract count, entry cost, and exit cost typed in by hand. There is no options data feed and no broker connection, so a trade only feeds the P&L totals once you enter a Date Closed. The Greeks Tracker is a separate sheet where you type the current delta, gamma, theta, and vega for positions you still hold, so it describes open risk rather than closed results. Nothing on either sheet updates on its own. That is the tradeoff against a connected platform: the file stays on your machine with formulas you can read and change, but nobody enters or updates a trade or a Greek except you.
How does the P&L formula tell a bought option from a sold one?
The Direction column carries a Buy or Sell dropdown, and the P&L formula reads it. Entry Cost is the premium times the contract count times the shares per contract, and Exit Cost is what the position was worth when you closed it. For a Sell trade, where you collect premium up front, P&L is entry cost minus exit cost, so a contract that decays toward zero keeps most of the credit. For a Buy trade, where you pay premium up front, P&L is exit cost minus entry cost, so the position has to gain value to profit. In the sample, a sold covered call that collected $640 and was bought back for $5 books $635, while a bought call that cost $850 and was sold for $1,430 books $580.
What does the Greeks Tracker's Net Delta column mean, and is it linked to the Trade Log?
The Greeks Tracker is independent of the Trade Log. It lists the positions you currently hold, and for each one Net Delta is the per-contract delta times the number of contracts times the shares per contract, which the sheet defaults to 100. A single share-per-contract cell drives that math, so a position with a delta of 0.55 on one contract shows a net delta of 55, meaning it moves roughly like 55 shares of the underlying. A Portfolio Greeks Totals block sums net delta, gamma, theta, and vega across the open rows, so the sample's eight positions net to a portfolio delta of 29. Those figures describe directional and time exposure on positions that are still open, not the closed trades that drive the P&L sheets.
What is Premium at Risk on the Expiration Calendar?
The Expiration Calendar groups trades by the month in the Expiration column rather than by when they closed, and Premium at Risk is the sum of the entry cost of every position expiring in that month. In the sample, June carries 10 expirations totaling $7,800 of entry cost, the busiest month on the calendar. A Status column reads the journal year against today's date to label each month Expired, This Month, or Upcoming, or No Expirations when nothing is dated into it, so the labels shift as the calendar advances. A separate P&L Targets table lets you type your own monthly, quarterly, and annual goals and compares the closed-trade totals against them.
How are options trades taxed in the US?
It depends on the contract and on whether the IRS treats you as an investor or a trader in securities. Most option gains and losses are capital gains and losses reported on Schedule D and Form 8949, and the wash-sale rules can apply, while some index options fall under separate Section 1256 rules. People who qualify as traders in securities have additional choices such as a mark-to-market election. IRS Topic no. 429 sets out the investor-versus-trader distinction, and a tax professional can confirm which treatment fits a specific situation.
Sources
- An Introduction to Options - Investor Bulletin - U.S. Securities and Exchange Commission (Investor.gov)
- Topic no. 429, Traders in securities (information for Form 1040 or 1040-SR filers) - Internal Revenue Service
About this article
Every figure, column name, formula, and feature description checked on 2026-09-10 against the shipped Options Trading Journal Ultimate workbook (Dashboard, Trade Log, Strategy Analysis, Monthly P&L, Greeks Tracker, Expiration Calendar, How to Use), with the free and Essentials Options Trading Journal workbooks checked for the tier comparison. The SEC Investor.gov options bulletin and IRS Topic no. 429 checked against the live sources at writing time. Last reviewed September 2026.