Commercial underwriting starts from leases rather than from a single rent figure. A commercial property analysis spreadsheet holds a per-tenant rent roll, a pool of reimbursable NNN charges split pro rata by leased square feet, the operating costs the landlord carries, and four transaction assumptions, then computes gross potential income, EGI, NOI, occupancy, NOI per square foot, a going-in cap rate, and an implied exit value. This walkthrough follows a worked example: Aurora Plaza, an 18,500 square foot multi-tenant building at $3,850,000 with six leases in place, $357,995 of NOI, a 9.30 percent going-in cap rate, and 80.8 percent occupancy. Our Commercial Property Analysis spreadsheet template ($59) ships the same structure ready-made for Excel and Google Sheets.
A multi-tenant commercial building does not have a rent. It has leases, and each one carries its own square footage, its own rate per square foot, its own expiry date, and its own share of the property tax bill. Underwriting the building means collapsing all of that into a small set of numbers a buyer can hold against an asking price, which is exactly the kind of job a spreadsheet handles well.
That is a different exercise from underwriting a house or a duplex. A residential model starts from one monthly rent figure and spends most of its effort on the mortgage. That is the route how to analyze a rental property in a spreadsheet walks through, with a loan payment, a DSCR, and a ten-year projection. Commercial underwriting starts from the rent roll instead, and most of the work goes into income structure: which space is actually leased, what each tenant pays per square foot, and how much of the operating cost the leases push back onto tenants.
The examples below come from our Commercial Property Analysis Spreadsheet Template ($59), which ships the whole structure ready-made for Excel and Google Sheets. The sample file underwrites Aurora Plaza, an 18,500 square foot multi-tenant building priced at $3,850,000, with six leases in place and one empty suite.
What a commercial property analysis spreadsheet has to hold
Strip out the presentation and there are only four kinds of information in the file.
- Per-lease facts. Tenant name, square feet, rent per square foot, and lease term, one row each. This is the raw material for income, occupancy, and the reimbursement split all at once.
- Reimbursable charges. Property tax, insurance, and common area maintenance: the pool of costs the leases pass back to tenants.
- Landlord-borne operating costs. Management, capital expenditure reserves, and common-area utilities, which nobody reimburses.
- Transaction assumptions. Purchase price, exit cap rate, vacancy allowance, and the building’s total square footage.
Everything else is derived. Gross potential income, effective gross income, net operating income, occupancy, NOI per square foot, the going-in cap rate, the implied exit value, and the spread to purchase all come out of formulas.
The workbook gives each group its own sheet. Rent Roll and Reimbursements hold the leases, Operating and Returns compute the outcome, Settings holds the four transaction numbers, a Dashboard sits on top, and a How to Use sheet carries the definitions. That is seven sheets. Across all of them the sample file has twenty-four cells carrying a typed number, alongside the text entries: asset name, tenant names, lease terms, charge labels, and a currency symbol.
Settings: four numbers that price the deal
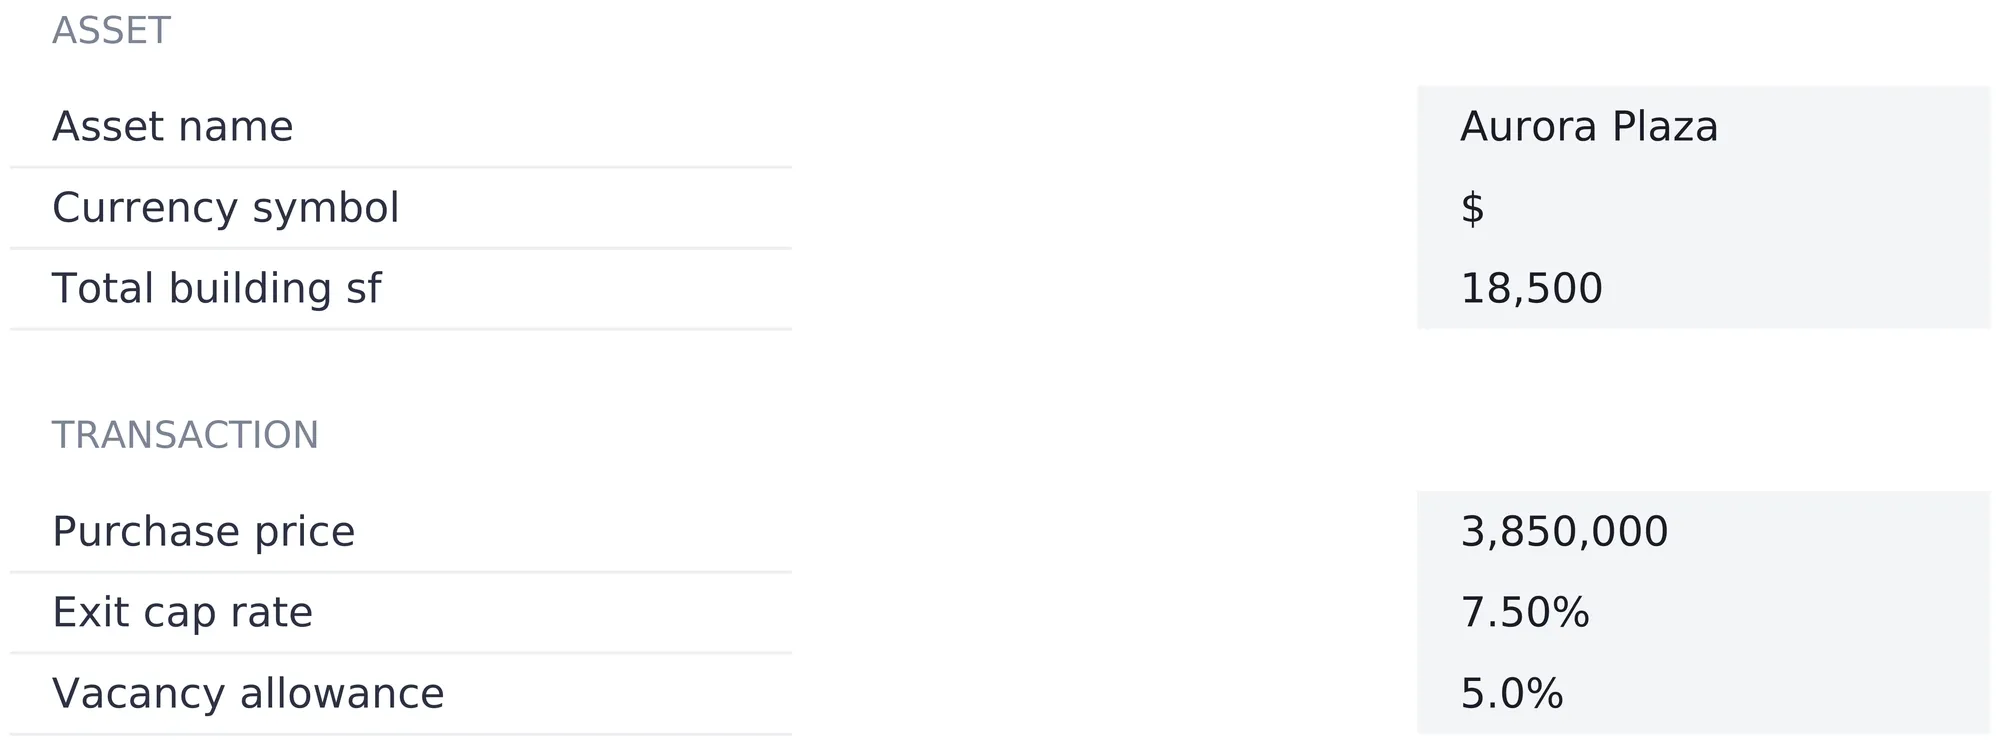
Four cells on the Settings sheet feed almost every calculation downstream, so they come first.
Total building square footage, 18,500 in the sample, is the denominator for both occupancy and NOI per square foot. It counts the whole building, vacant space included, which the workbook’s own How to Use sheet spells out. That choice makes both figures describe the asset rather than only the part of it currently producing income.
Purchase price, $3,850,000, is the denominator of the going-in cap rate and the number the exit valuation is measured against.
Exit cap rate, 7.50 percent, is the assumed market cap rate at sale. Because the implied exit value divides NOI by this figure, a higher exit cap produces a lower value.
Vacancy allowance, 5.0 percent, is a haircut applied to the whole gross income line further down.
Settings also holds the asset name, which appears under the title on every sheet, and a currency symbol chosen from a dropdown of 35 options. Changing the symbol relabels every money header and KPI tile across the workbook. It relabels only, with no conversion of the underlying numbers.
The rent roll is the model
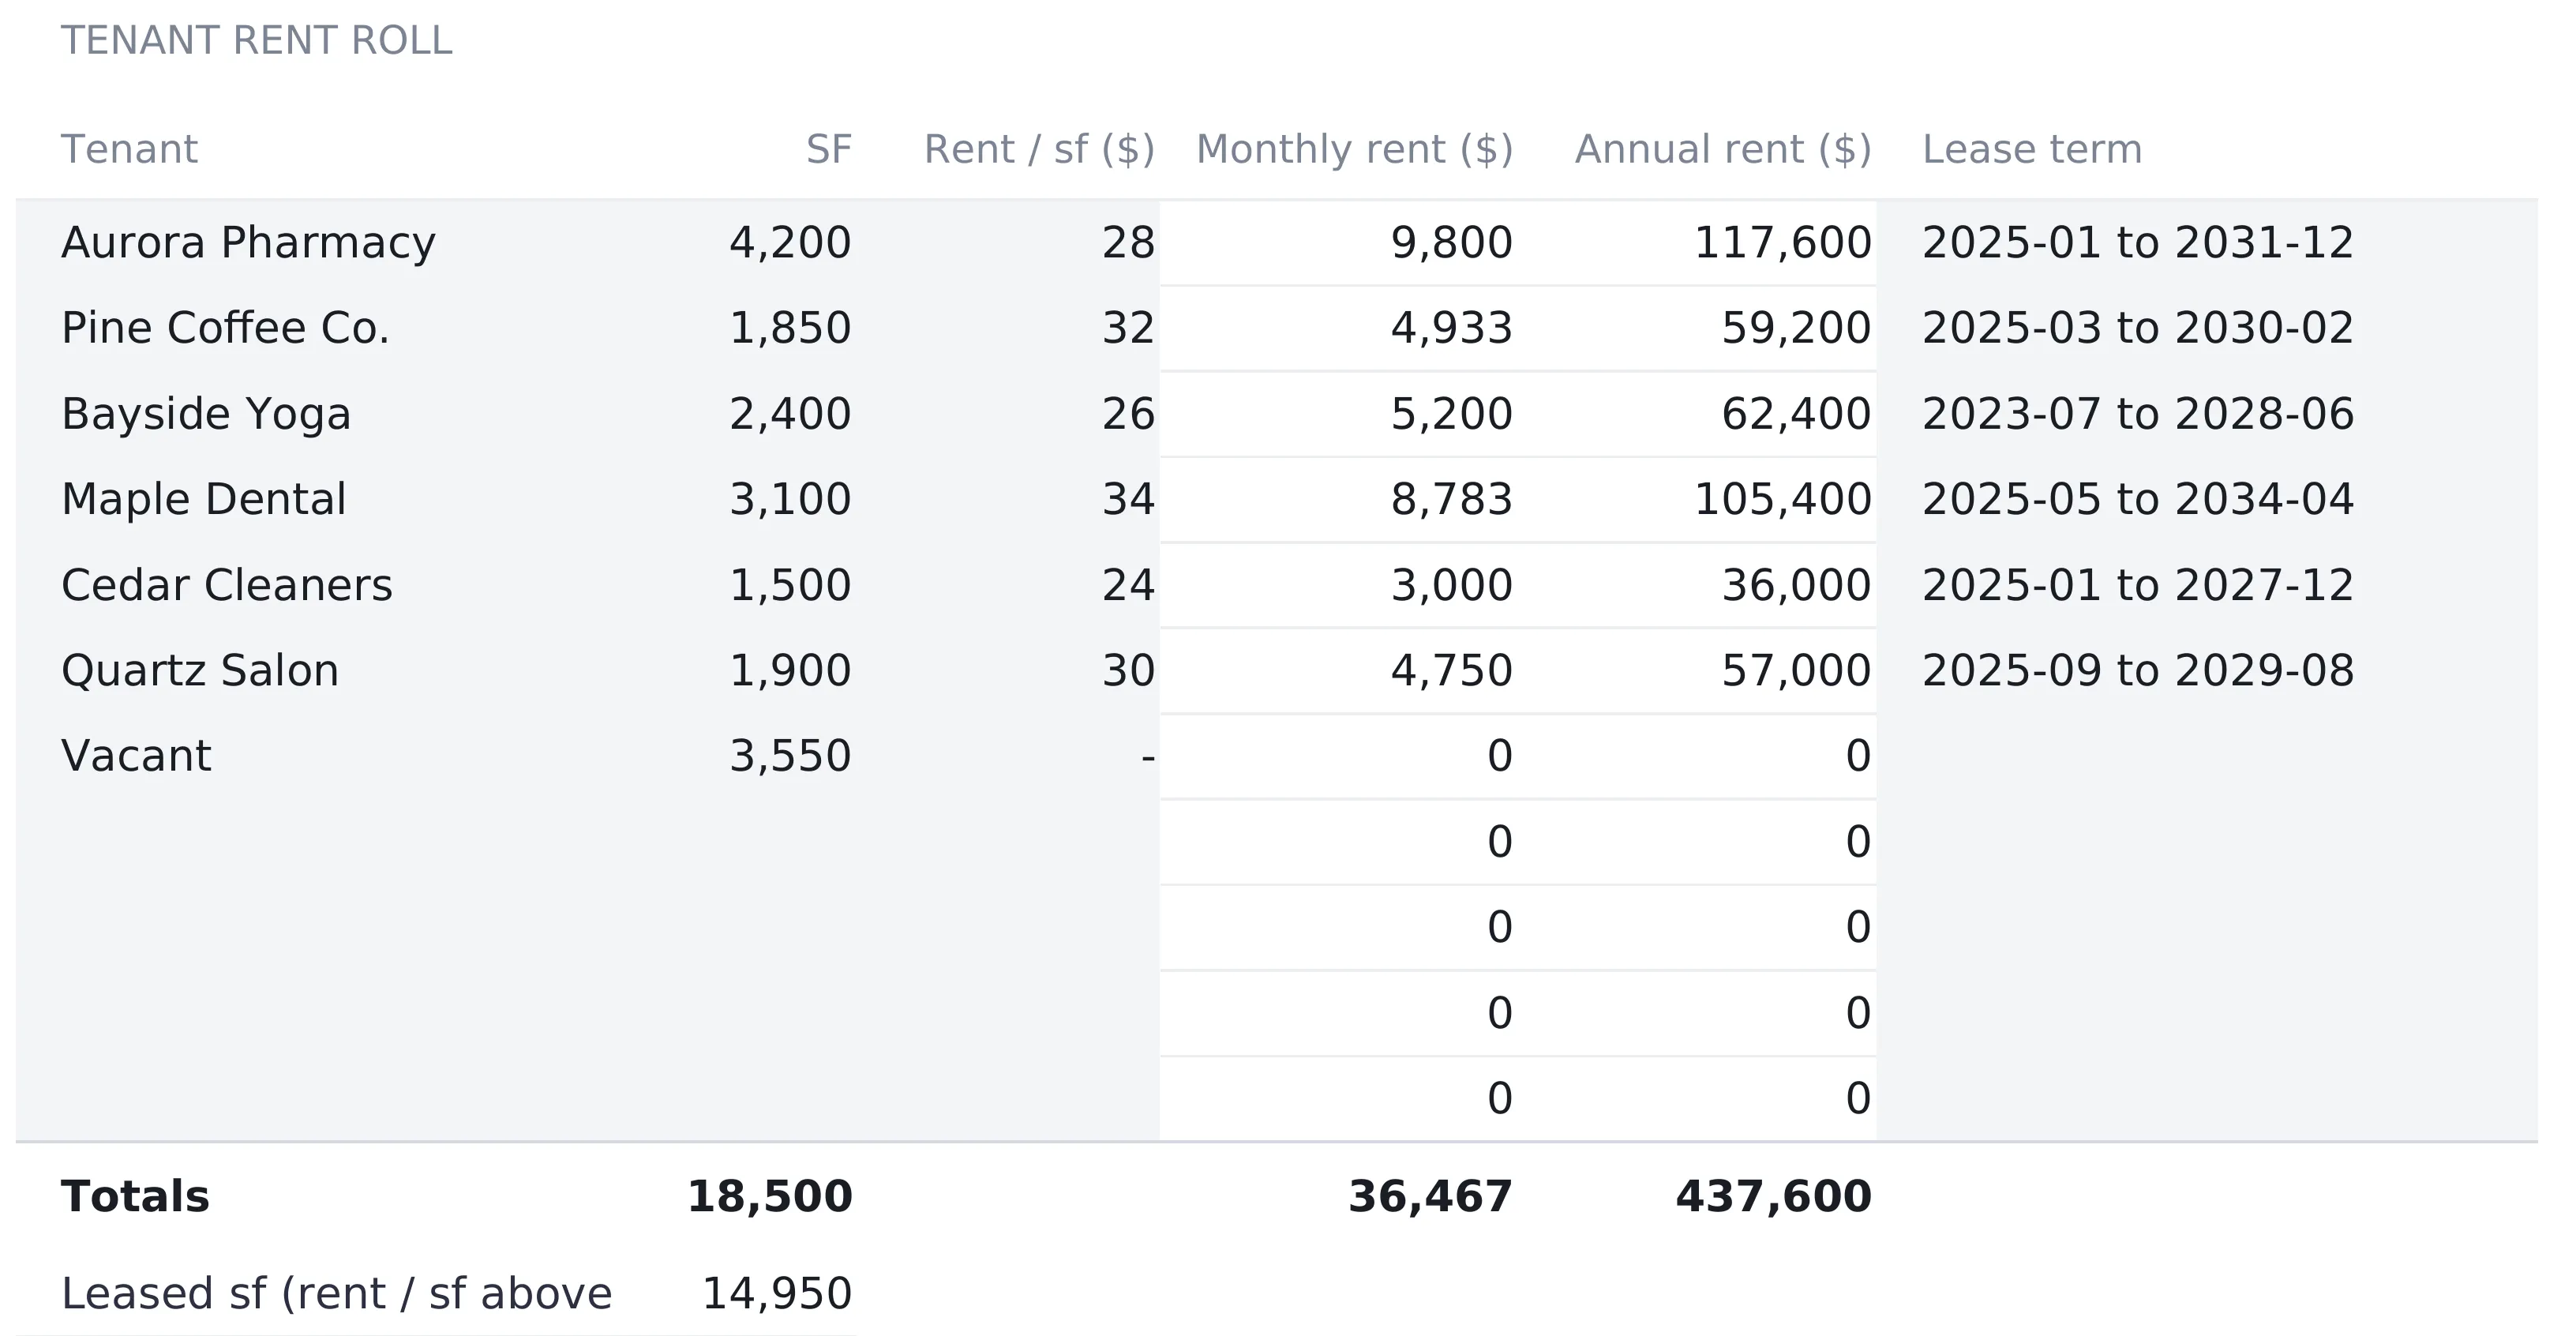
Everything about the income side starts on one sheet. The rent roll has six columns. Four are typed: tenant name, square feet, rent per square foot, and the lease term as text. The other two are formulas:
- Monthly rent = square feet × rent per square foot ÷ 12
- Annual rent = square feet × rent per square foot
Pricing rent per square foot rather than per month is the convention the whole sheet is built around. It is what makes a 1,500 square foot dry cleaner and a 4,200 square foot pharmacy comparable at all.
| Tenant | SF | Rent / sf | Annual rent | Lease term |
|---|---|---|---|---|
| Aurora Pharmacy | 4,200 | $28 | $117,600 | 2025-01 to 2031-12 |
| Pine Coffee Co. | 1,850 | $32 | $59,200 | 2025-03 to 2030-02 |
| Bayside Yoga | 2,400 | $26 | $62,400 | 2023-07 to 2028-06 |
| Maple Dental | 3,100 | $34 | $105,400 | 2025-05 to 2034-04 |
| Cedar Cleaners | 1,500 | $24 | $36,000 | 2025-01 to 2027-12 |
| Quartz Salon | 1,900 | $30 | $57,000 | 2025-09 to 2029-08 |
| Vacant | 3,550 | - | 0 | |
| Totals | 18,500 | $437,600 |
Two rows below the totals do the work that the residential version of this model never needs. Total square feet adds every row, occupied or not, and comes to 18,500, matching the building figure on Settings. Leased square feet is a SUMPRODUCT that adds only the rows priced above zero, which gives 14,950. The empty suite is entered as a normal row with a rent per square foot of zero, so it carries its 3,550 square feet into the building total and contributes nothing anywhere else. Monthly rent across the tenancy totals $36,467.
Four spare rows sit under the last tenant, already carrying the monthly and annual formulas and already inside every total, the reimbursement split, the occupancy figure, and the dashboard chart. A new lease goes on the first free row and the workbook updates itself.
One column earns a warning. Lease term is stored as text, and nothing in the workbook reads it. There is no weighted average lease term, no rollover schedule, and no alert when a lease is close to expiring. It is a reference note for whoever opens the file. Read by eye, the sample’s expiries do cluster. Cedar Cleaners runs out at the end of 2027 and Bayside Yoga six months later in mid-2028, which puts $98,400 of annual rent up for renewal inside a single half-year window. No tile on the dashboard surfaces that.
Reimbursements: how NNN moves cost onto the leases
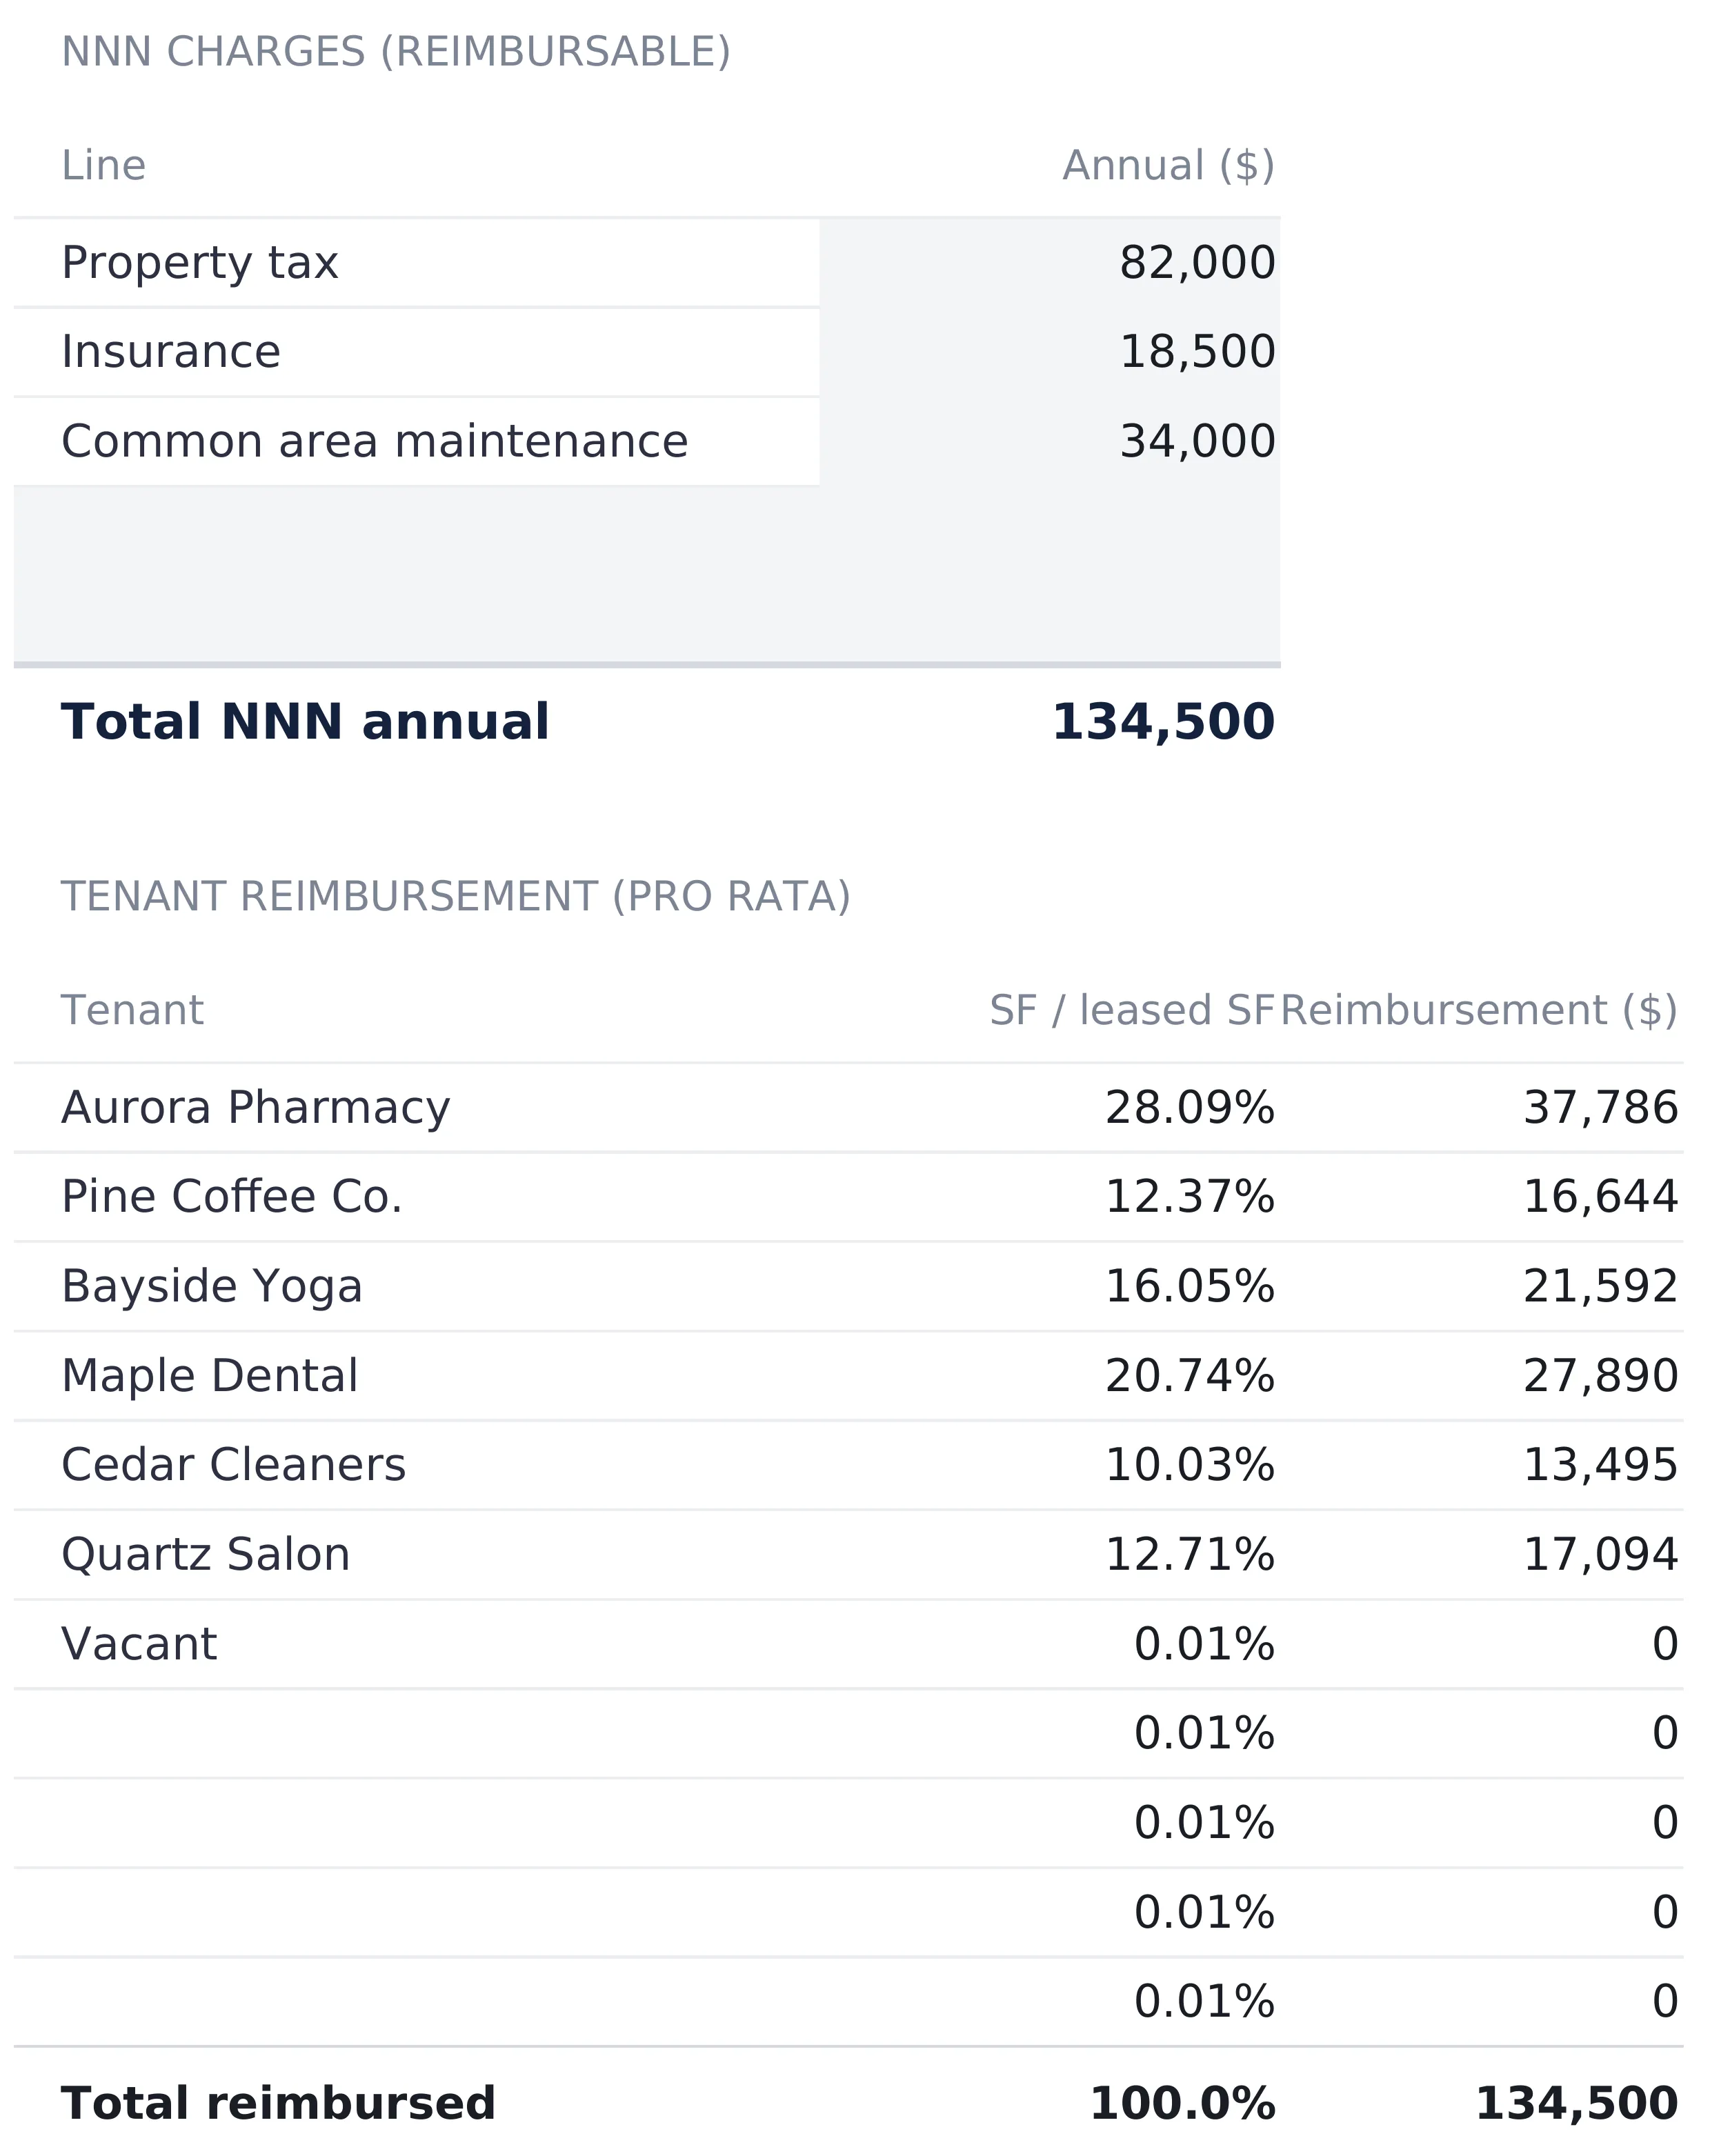
This sheet is the piece with no residential equivalent. Under a triple net structure, property tax, insurance, and common area maintenance are billed back to tenants in proportion to the space they occupy. The same dollar therefore shows up twice in the model, once as a cost and once as income.
The pool comes first, three lines in the sample plus two spare:
| NNN charge | Annual |
|---|---|
| Property tax | $82,000 |
| Insurance | $18,500 |
| Common area maintenance | $34,000 |
| Total NNN annual | $134,500 |
The split comes second. Each tenant’s share is that tenant’s square feet divided by leased square feet. Two guards sit around that division, so the formula returns zero rather than an error when leased square feet is zero or when the row itself is priced at zero. Tenant names on this sheet are pulled from the rent roll rather than retyped, so the two lists cannot drift apart.
| Tenant | SF / leased SF | Reimbursement |
|---|---|---|
| Aurora Pharmacy | 28.09% | $37,786 |
| Pine Coffee Co. | 12.37% | $16,644 |
| Bayside Yoga | 16.05% | $21,592 |
| Maple Dental | 20.74% | $27,890 |
| Cedar Cleaners | 10.03% | $13,495 |
| Quartz Salon | 12.71% | $17,094 |
| Vacant | 0 | 0 |
| Total reimbursed | 100.0% | $134,500 |
The denominator is the detail to notice. Shares are measured against leased square feet, not against the building, so the six tenants in place absorb the entire $134,500 and the column totals exactly 100 percent. A model that divided by total building square footage instead would leave the vacant suite’s 19.19 percent share, around $25,800, sitting with the landlord and would drop reimbursement income by that amount. Neither convention is wrong, and lease documents differ on which one applies. The two produce materially different NOI on the same building, so which one a sheet uses is worth checking before its cap rate is set beside anyone else’s.
Operating: gross potential income down to NOI
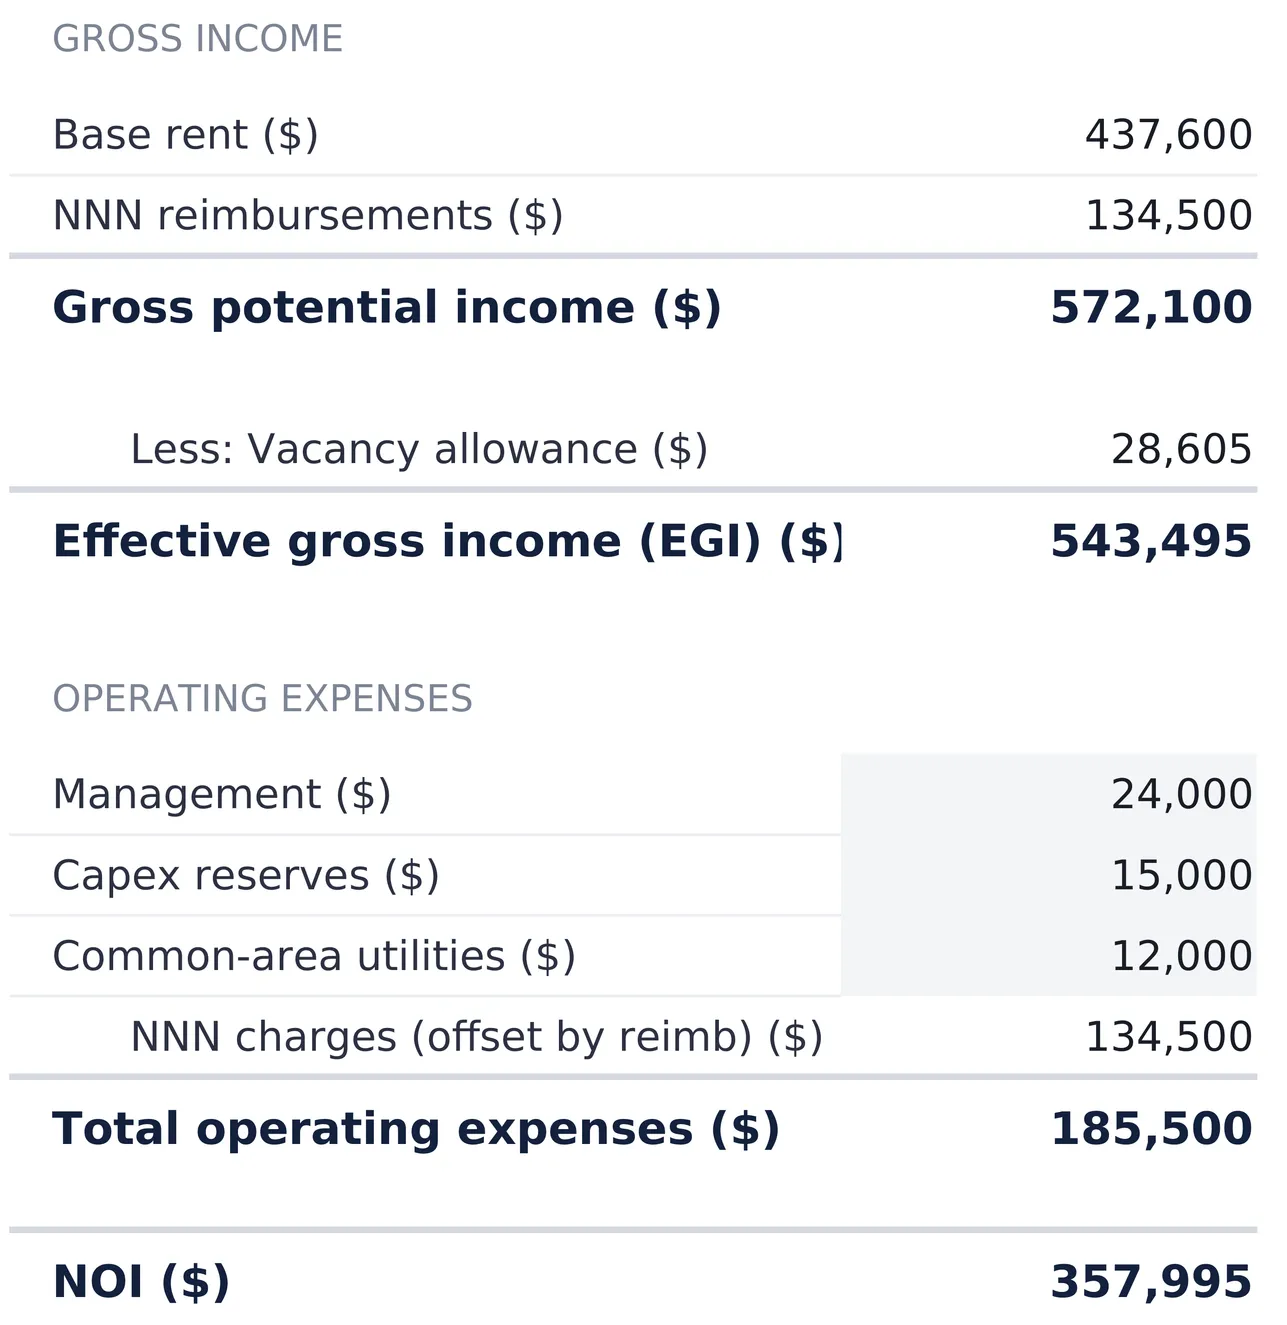
The Operating sheet is where the two income streams meet the cost side. Three of its cells are typed and the rest are links and arithmetic.
| Line | Sample | Source |
|---|---|---|
| Base rent | $437,600 | Rent roll total |
| NNN reimbursements | $134,500 | Reimbursements total |
| Gross potential income | $572,100 | Base rent + reimbursements |
| Less: vacancy allowance | $28,605 | 5% of gross potential income |
| Effective gross income | $543,495 | GPI less vacancy |
| Management | $24,000 | Typed |
| Capex reserves | $15,000 | Typed |
| Common-area utilities | $12,000 | Typed |
| NNN charges | $134,500 | Reimbursements total |
| Total operating expenses | $185,500 | Sum of the four |
| NOI | $357,995 | EGI less operating expenses |
The reimbursement appearing on both sides is the part that surprises people reading a commercial model for the first time. It is not a rounding trick. The landlord genuinely pays $134,500 of tax, insurance, and maintenance bills, and the leases genuinely send $134,500 back. A sheet that showed only the net would hide the size of the property’s cost base and make the operating expense ratio meaningless.
The two sides also fail to cancel by a specific, checkable amount. Vacancy is applied to the whole gross potential income line, reimbursements included, so 5 percent of $134,500 comes off as well. That is $6,725. A version of the same building that kept reimbursements out of both the income and the expense column entirely would report NOI of $364,720 rather than $357,995, on identical leases and identical bills. The difference is a modeling convention rather than a fact about the building, so two cap rates are only comparable once it is clear how each was built.
One more convention sits in that expense list. Capex reserves are inside operating expenses here, above the NOI line, which pulls NOI down by $15,000 against a build that treats reserves as a below-the-line item. On a $3,850,000 price that is worth roughly four tenths of a percentage point of cap rate.
Returns: the cap rate, the yardsticks, and the exit
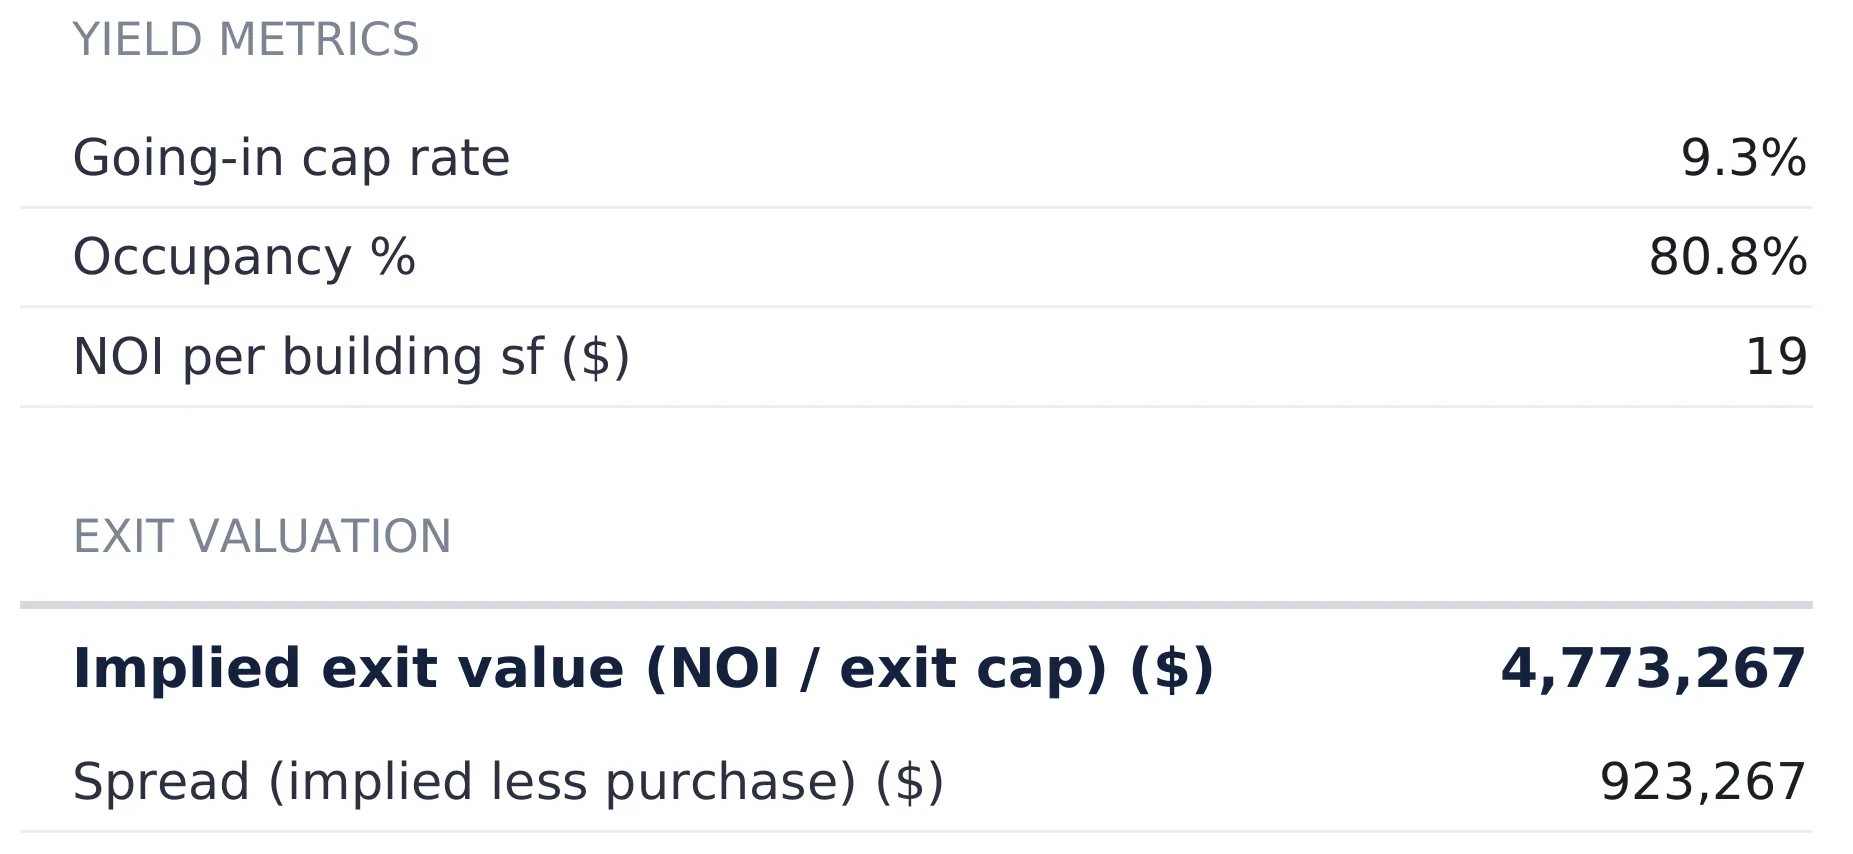
Five figures close the model, and every one of them is a division of numbers the earlier sheets already produced.
| Metric | Sample value | How it is derived |
|---|---|---|
| Going-in cap rate | 9.30% | NOI ÷ purchase price |
| Occupancy | 80.8% | Leased sf ÷ total building sf |
| NOI per building sf | $19.35 | NOI ÷ total building sf |
| Implied exit value | $4,773,267 | NOI ÷ exit cap rate |
| Spread to purchase | $923,267 | Implied exit value less purchase price |
Each one reads zero rather than an error when the figure it divides by is blank, so a half-filled file stays readable while the rest of the numbers go in.
The going-in cap rate is the headline, and what it measures is narrow. It divides an unlevered, stabilized year of net operating income by the price, so it describes the building and the leases rather than any particular buyer. NOI per square foot, $19.35 here, is that same income expressed in the unit the rent roll is priced in. That puts it directly beside the $24 to $34 per square foot the tenants pay, and gives a quick read on how much of the gross the property keeps.
The exit block is a single question rather than a projection. Nothing grows and there is no hold period: the sheet takes today’s NOI and asks what it is worth at the exit cap rate typed on Settings. At 7.50 percent, $357,995 capitalizes to $4,773,267, which is $923,267 above the $3,850,000 price. The entire spread comes from the gap between a 9.30 percent going-in cap and a 7.50 percent exit cap, so it is a statement about the assumption, not a forecast. Move the exit cap to 8.0 percent and the same NOI capitalizes to $4,474,938 with a spread of about $624,938. Set it at 9.30 percent and the spread disappears entirely.
That is a different shape from the residential sibling, which grows the purchase price at an appreciation rate for ten years and then deducts selling costs and a loan balance. Here the exit is priced off income rather than off time.
The dashboard: eight tiles and a one-line verdict
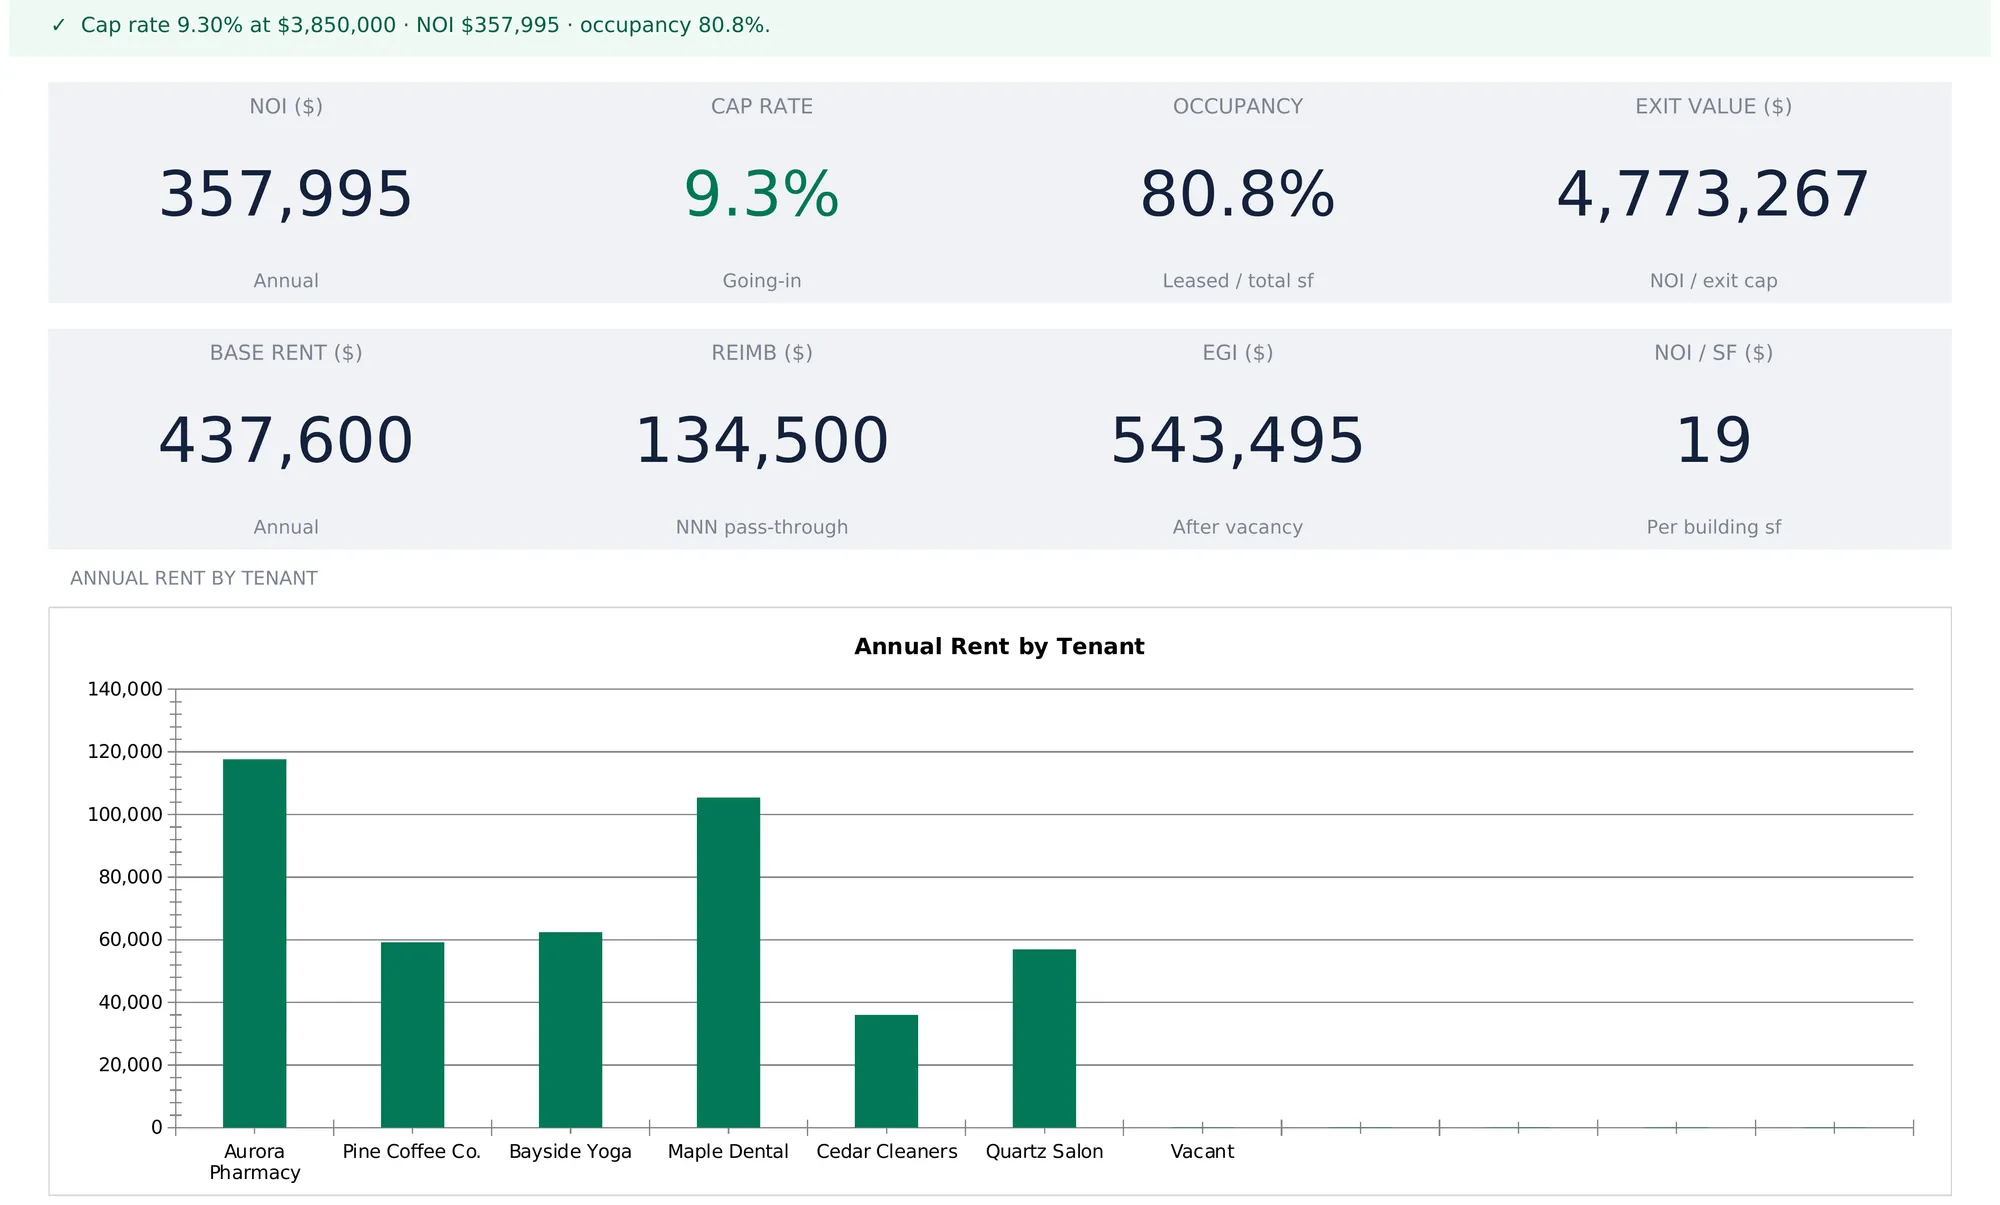
With the input sheets filled, the Dashboard states the deal. A status line across the top gives the position in one sentence, showing a checkmark on green with the cap rate, the price, the NOI, and the occupancy. It flips to a warning on amber when NOI is not above zero. In that state it prints the NOI figure alongside effective gross income and total operating expenses, so a building whose costs have overtaken its income says so the moment the file opens.
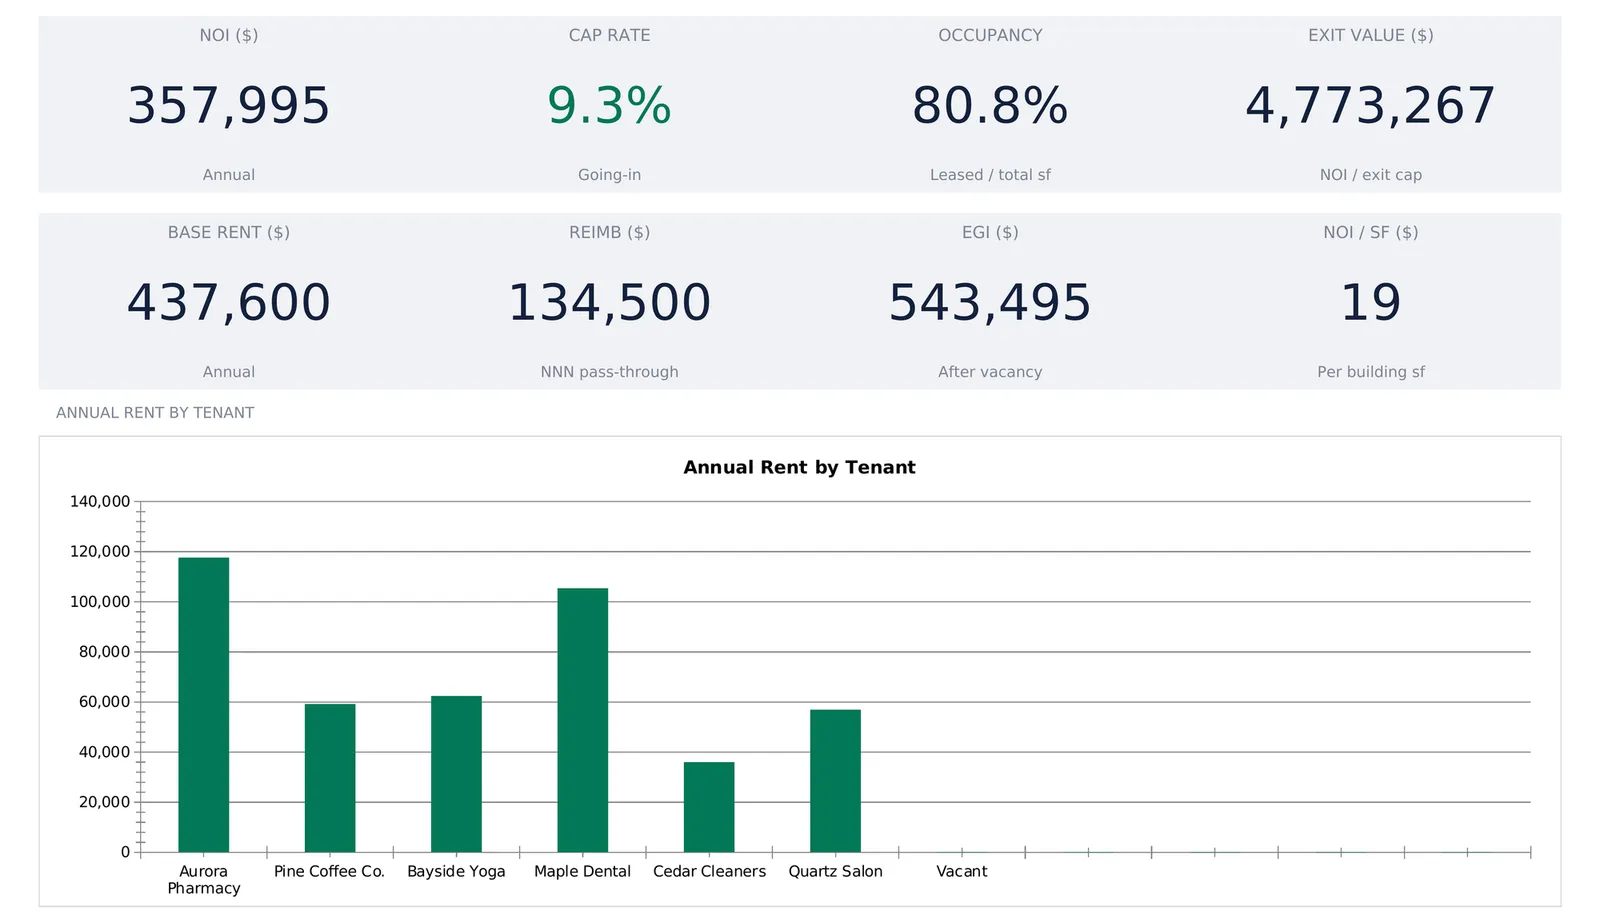
The top row of tiles is the valuation view: NOI $357,995, cap rate 9.3 percent, occupancy 80.8 percent, and exit value $4,773,267. The bottom row breaks the income apart: base rent $437,600, reimbursements $134,500, EGI $543,495, and NOI per square foot $19. The cap rate tile colors itself green above zero and red below. The occupancy tile turns red above 100 percent. That is a data check rather than a compliment: leased square feet above the building square footage typed on Settings means one of the two numbers is wrong.
Below the tiles, a bar chart plots annual rent by tenant, pulling names and amounts straight from the rent roll. In the sample it makes the concentration visible immediately: Aurora Pharmacy at $117,600 and Maple Dental at $105,400 are together just over half of the $437,600 base rent, while the other four leases sit between $36,000 and $62,400. Tenant concentration is a fact about a commercial building that no single ratio reports, and a bar chart reports it in a second.
What this model leaves out
No underwriting model is complete, and the gaps here are specific.
There is no debt anywhere in the file. No loan amount, no interest rate, no payment, no DSCR, no cash-on-cash return. Every figure is unlevered by design, which keeps the cap rate comparable between a cash buyer and a leveraged one but leaves the financing question for another file.
There is no multi-year projection. The workbook models one stabilized year. Rent escalations written into the leases, lease rollover, downtime between tenants, and the leasing commissions or tenant improvement allowances that come with re-letting the vacant 3,550 square feet all sit outside it.
The vacancy allowance is a percentage haircut on the whole income line rather than a modeled empty period. This is not double counting the vacant suite. That space already earns zero on the rent roll, so the 5 percent is an allowance for downtime and collection loss on the income the leases in place produce.
The reimbursement split runs one formula on every leased row: that tenant’s square feet over leased square feet. There is no per-tenant switch. A tenant on a gross lease who reimburses nothing, or one whose CAM contribution is capped, comes out of the pro rata column with a full share anyway, so a rent roll mixing lease structures needs those rows adjusted by hand.
One file holds one building. Settings carries a single asset name, a single total square footage, and a single price, and every sheet reads those cells. A second property is a second copy of the workbook, which is how buyers comparing several assets tend to use it: one copy per address, dashboards read side by side.
Everything is pre-tax. There is no depreciation deduction and no tax on operating profit, so the NOI figure is a pre-tax number. IRS Publication 946 covers how depreciation works for business and income-producing property, and a tax professional can work out the after-tax picture for a specific purchase.
And one gap sits outside the file entirely. Those twenty-four typed numbers are estimates sourced elsewhere: an offering memorandum for the price, actual lease documents for the rents and the reimbursement clauses, county records for the property tax, a broker’s quote for insurance. The workbook computes a cap rate to two decimal places whether the rent roll was transcribed from signed leases or from a listing summary, and it cannot tell the two apart.
Excel or Google Sheets for commercial property underwriting
The template is an .xlsx file built on plain formulas, with no macros and no add-ons, so it behaves identically in Microsoft Excel and in Google Sheets after upload. That matters here because commercial underwriting is usually a conversation. Google Sheets suits sharing a model by link with a partner, a broker, or a lender who wants to see which rent roll assumptions produced the cap rate. Excel suits keeping a folder of past deals on one machine. The structure described above is buildable by hand in either, and the sheet-by-sheet split is what keeps the rent roll, the NNN pool, and the derived figures from sharing one grid.
Which spreadsheet template fits which job
- Commercial Property Analysis Spreadsheet Template ($59) is the workbook this walkthrough follows: an eleven-row rent roll, the NNN pool with its pro rata split, gross income down to NOI, the going-in cap rate, occupancy, NOI per square foot, and the exit valuation, for a single multi-tenant asset.
- Rental Property Analysis Spreadsheet Template ($59) is the residential counterpart, built around a single rent figure with a mortgage attached, and it answers the levered questions this one does not: cash-on-cash, DSCR, a ten-year projection, and a sale priced off appreciation.
- Mortgage Analysis Spreadsheet Template ($29) covers the financing side on its own, with a full 360-month amortization schedule and three loan scenarios compared side by side, which is the layer the commercial workbook deliberately leaves out.
Related
- How to Analyze a Rental Property in a Spreadsheet - the residential version, with financing, DSCR, and a ten-year hold
- How to Calculate ROI on a Rental Property - the concepts behind cap rate and cash-on-cash, and the expense assumptions that drive them
- Rental Property Cash Flow Spreadsheet (Excel, Per-Unit Tabs) - tracking a property already owned, with a tab per unit
Frequently asked questions
What is the difference between a going-in cap rate and an exit cap rate?
The going-in cap rate is computed, and the exit cap rate is typed. Going-in divides the property's net operating income by the price being paid, which in the sample is $357,995 against $3,850,000, or 9.30 percent. The exit cap is an assumption about what the market will pay for that same income stream later, 7.50 percent in the sample. The workbook divides NOI by it to produce an implied exit value of $4,773,267. The spread between that value and the purchase price, $923,267 here, exists because the exit cap typed in is lower than the going-in cap the deal produces.
Why do NNN charges show up as both income and an expense?
Because both events happen. The landlord pays the property tax, insurance, and common area maintenance bills, and the leases reimburse those costs. The Operating sheet records the $134,500 of reimbursements as income and the same $134,500 of charges as an expense, which is called grossing up. The two do not cancel exactly, because the 5 percent vacancy allowance is applied to the whole gross potential income line including the reimbursement side. That costs $6,725 of NOI in the sample; a version that left reimbursements out of both sides entirely would report $364,720 rather than $357,995.
How does the spreadsheet decide which space counts as leased?
By the rent per square foot column. Leased square feet is a SUMPRODUCT that adds up every row priced above zero. In the sample that gives 14,950 of the building's 18,500 square feet, and occupancy of 80.8 percent. The vacant 3,550 square foot suite is entered as a normal rent roll row with a rent per square foot of zero, so it counts toward total square footage and toward nothing else. One consequence worth knowing is that a tenant in a free-rent period entered at zero would drop out of leased square feet and out of the reimbursement split along with it.
Does this workbook model a mortgage, DSCR, or cash-on-cash return?
No. There is no loan amount, no payment, and no debt service anywhere in the file, so every figure it produces is unlevered. Cap rate, NOI per square foot, and the implied exit value all describe the building rather than a particular buyer's financing. The residential sibling template takes the levered route instead, with a loan, a DSCR, and a ten-year projection, and a dedicated mortgage template handles amortization on its own.
How many tenants and charge lines does the rent roll hold?
The rent roll has eleven rows. The sample uses seven of them, six leases plus the vacant suite, leaving four spare. The NNN charge list has five lines with three used. Every spare row already carries its formulas and already sits inside the totals, the pro rata split, the occupancy figure, and the dashboard chart. Adding a tenant means typing into the next free row rather than editing anything.
Sources
- About Publication 946, How to Depreciate Property - Internal Revenue Service
About this article
Every figure, sheet name, formula, and feature description verified against the published Commercial Property Analysis Pro workbook (the exact file customers download). IRS Publication 946 reference checked against the live IRS page at writing time. Last reviewed August 2026.