
Budget templates for visual thinkers show spending at a glance with pie or donut charts, color-coded categories, progress bars, and a summary dashboard instead of raw rows. Google Sheets and Excel handle every one of those elements natively through built-in charts, conditional formatting, and SPARKLINE, so no separate app is needed. The practical setup is a summary dashboard on top for quick reference, with the detailed numbers kept underneath.
Numbers in rows and columns don’t work for everyone. If you grasp financial information better through charts, progress bars, and visual dashboards, here’s how to make budgeting work for your brain.
Essential Visual Elements
Progress Bars
Use for: savings goals, debt payoff, monthly budget remaining, emergency fund progress.
Emergency Fund: $3,500 / $10,000
[███████░░░░░░░░░░░░░] 35%
Charts
- Pie/donut charts: Spending breakdown by category, income allocation (the 50/30/20 split)
- Line charts: Net worth over time, spending trends month-to-month
- Bar charts: Budget vs. actual by category, monthly spending comparison
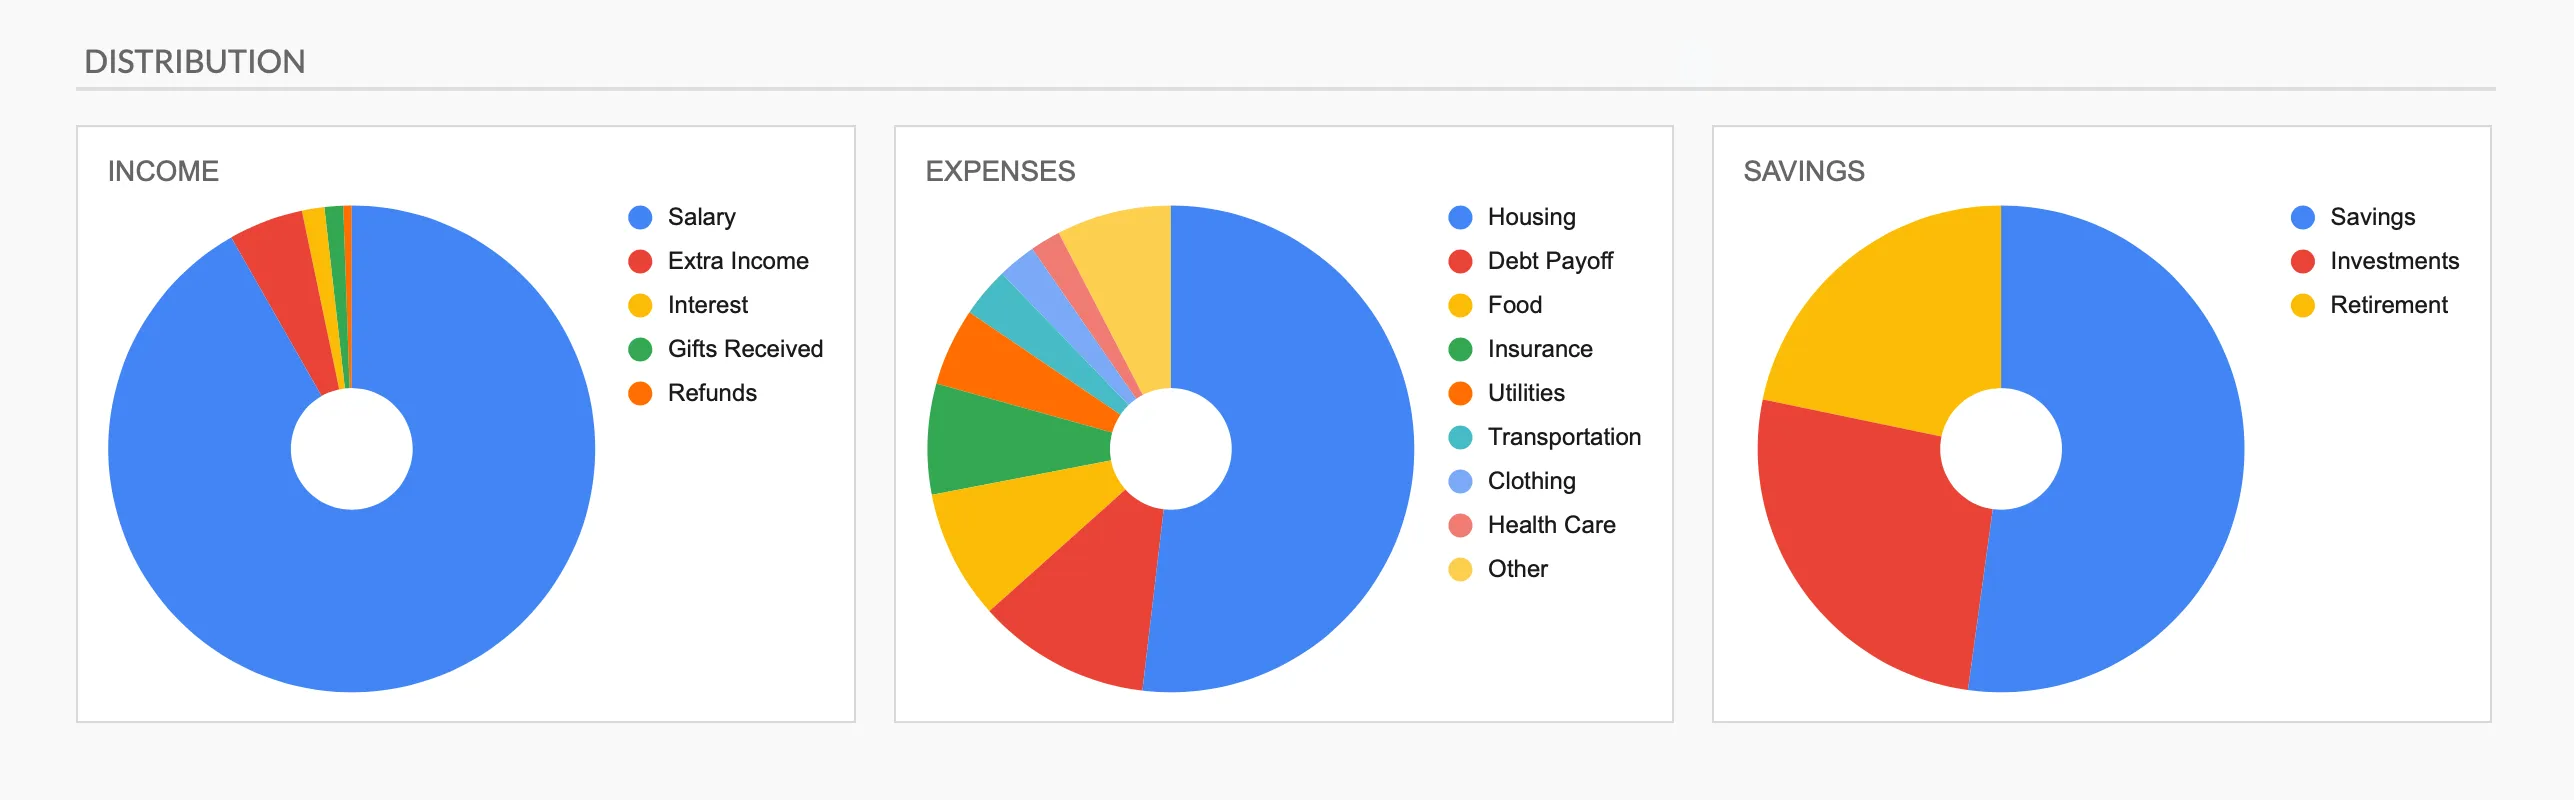
The Monthly Budget Template (Premium) turns each category group into a donut chart, so the biggest slices of income, spending, and savings are visible without reading a single number.
Color Coding Systems
Traffic Light Method
- Green: On track, under budget
- Yellow: Close to limit, attention needed
- Red: Over budget, take action
Conditional Formatting in Spreadsheets
Google Sheets and Excel can automatically color cells based on values. Set it once, forget about it. Google documents the conditional formatting rules for Sheets, including the custom-formula option that drives percent-of-budget colors.
Example rule:
- Spending over budget: red
- Spending at 90-100% of budget: yellow
- Spending under 90% of budget: green
Chart Types for Different Questions
| Question | Best Visual |
|---|---|
| Where does my money go? | Pie chart or donut chart |
| Am I on track this month? | Progress bars with color coding |
| How am I trending? | Line chart of monthly totals |
| How does this month compare? | Horizontal bar chart (budget vs. actual) |
Building Visual Budgets in Google Sheets
Charts
Select your data, open the Insert menu and choose Chart, pick your type, then customize colors and labels. Takes about two minutes.
Conditional Formatting
Select the cells, open the Format menu and choose Conditional formatting, set rules based on values, then choose colors. Cells update automatically as numbers change.
Progress Bar Formula
=IFERROR(REPT("█", ROUND(MIN(A1/B1,1)*20)) & REPT("░", 20-ROUND(MIN(A1/B1,1)*20)), REPT("░", 20))Where A1 is the current value and B1 is the target. MIN(A1/B1,1) caps the fill at a full bar so going over the target does not push the block count past 20 and break the formula, and the IFERROR wrapper draws an empty bar when the target is blank or zero instead of showing an error.
Sparklines
Mini charts within cells, documented in the Google Sheets SPARKLINE function reference:
=SPARKLINE(A1:A12, {"charttype","column"})Shows 12 months of data in a single cell.
Visual Dashboard Design
A dashboard works in layers: top summary (total income, expenses, net savings, status indicator), category breakdown (visual bars with color-coded status), and goal progress (progress bars per goal). Keep important info at top, color meanings consistent, and leave white space.
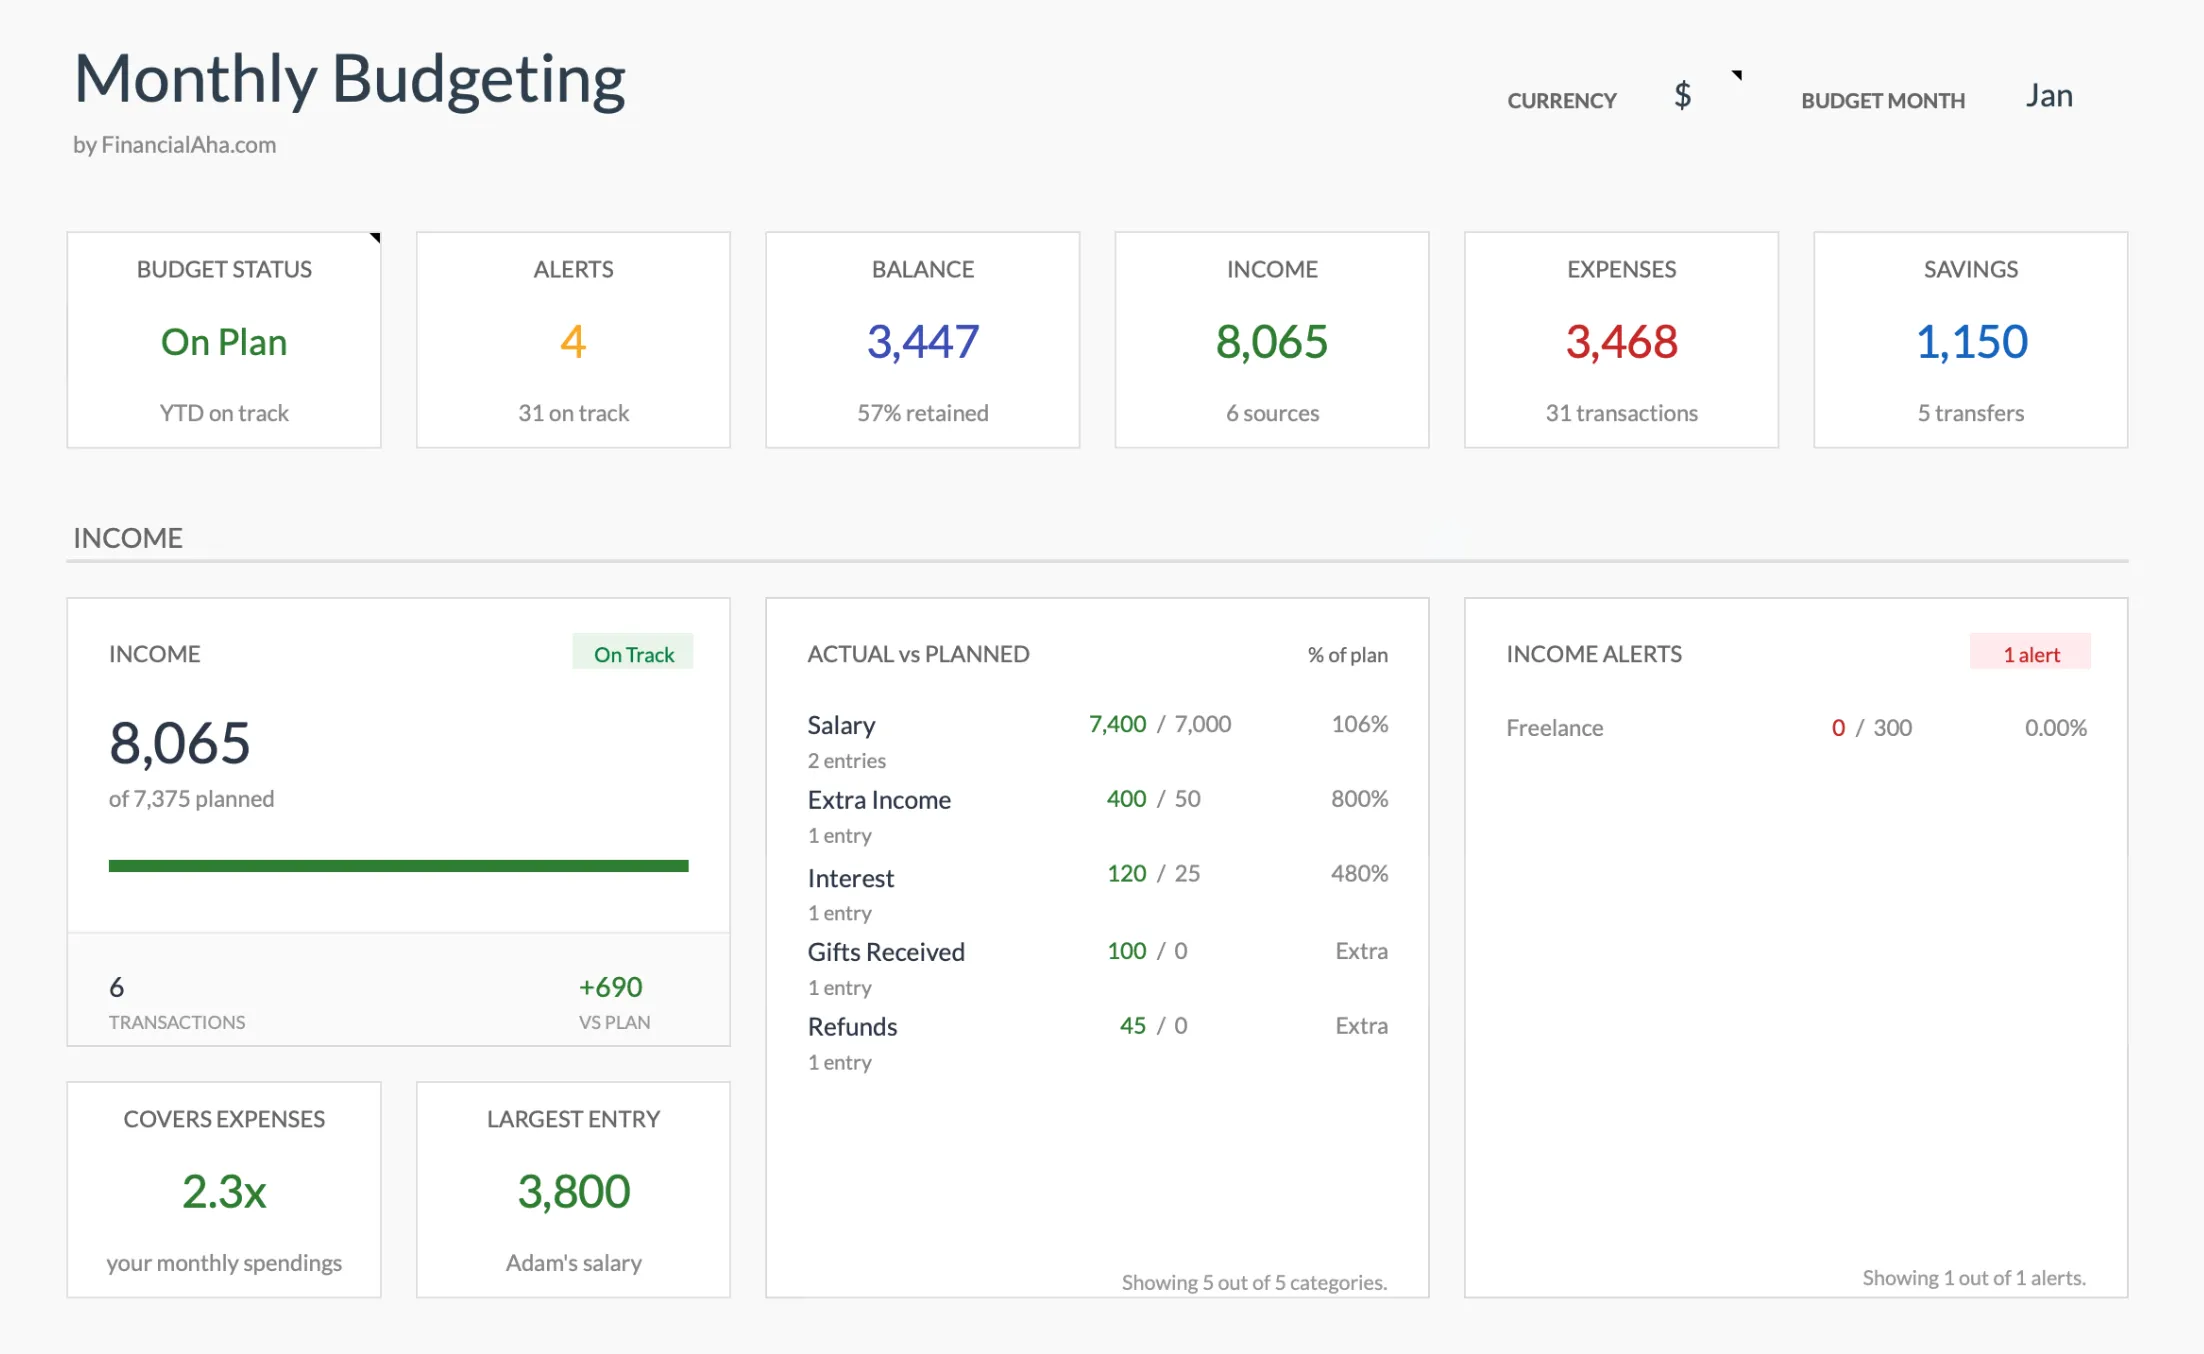
The Monthly Budget Template (Premium) opens on a summary row covering budget status, balance, income, expenses, and savings, then drops into a budget-vs-actual section with a progress bar and color-coded alerts, the same layering described above.
Visual Progress Tracking
Goal Thermometer
$10,000 ┬─────────────
        │
$7,500  ├────■■■■■■──
        │    ████
$5,000  ├────████────
        │    ████
$2,500  ├────████────
        │    ████
$0      └────████────
         Current: $3,200
Single Visual Per Goal
Emergency Fund:    [████████░░] 80%
Vacation Savings:  [███░░░░░░░] 30%
Car Fund:          [██████░░░░] 60%
Visual-Friendly Templates
The Monthly Expense Tracker has a clean visual layout with automatic category totals. The Monthly Budget Template provides budget vs. actual visual comparison with color-coded status indicators. The Budget Dashboard in Google Sheets guide covers creating visual dashboards with chart integration.
Common Visual Mistakes
- Too many colors: When everything is colorful, nothing stands out. Reserve color for meaningful signals.
- Too many charts: Pick 3-5 key visuals and stop there.
- Misleading scales: Worth checking that axes start at appropriate values and scales stay consistent.
- Decoration over clarity: Simple, clear visuals beat beautiful confusing ones every time.
Making the Switch
If you currently use pure numbers: Start with one chart (monthly spending trend works well), add conditional formatting to what you already have, then gradually build a small dashboard.
If you’ve never budgeted: Start with a visual-first template, focus on 3-5 categories maximum, and use progress bars for any savings goals.
Related
- Monthly Budget Template - Visual comparison built-in
- Budget Dashboard in Google Sheets
- Google Sheets Formulas for Budgeting
- Monthly Budget Review: What to Check
Frequently asked questions
Can I be a "visual budgeter" with spreadsheets?
Absolutely. Google Sheets and Excel both support charts, conditional formatting, and visual elements. You don't need a fancy app.
What if I also want the detailed numbers?
Keep them. Just add a visual summary layer on top. Numbers for detail, visuals for quick reference.
Are visual budgets less accurate?
No. The data is the same, the presentation is just different. Visuals communicate the same information in a way that's easier to process.
Do visual templates cost more?
Not necessarily. Many free and paid templates include visual elements. Worth looking for templates designed with visuals in mind from the start.
How do I make a progress bar in Google Sheets without an add-on?
A single cell can act as a bar using REPT to repeat a filled block for the portion complete and a light block for the rest. It reads like a bar and updates on its own as the underlying numbers change, so no add-on or chart is involved. The formula in the guide below caps the fill at 100% and falls back to an empty bar when the target cell is blank.
Will conditional formatting slow my spreadsheet down?
For a normal personal budget of a few hundred rows, the effect is not noticeable. Slowdowns tend to appear only when the same rules are applied across many thousands of cells or stacked with heavy volatile formulas. Scoping each rule to the range it actually covers, rather than a whole column, keeps things responsive.
Sources
- Use conditional formatting rules in Google Sheets - Google Docs Editors Help
- SPARKLINE function - Google Docs Editors Help
About this article
Conditional-formatting and SPARKLINE steps checked against Google's Docs Editors Help documentation Visual features described for the Monthly Budget Template reflect its live dashboard: budget-vs-actual comparison, color-coded status, and category donut charts Last reviewed August 2026.