Retirement Calculator Ultimate
Detailed retirement projection with accumulation and withdrawal phases, employer match modeling, Social Security, inflation, 3-scenario return comparison, and sensitivity analysis grids.
What's Included
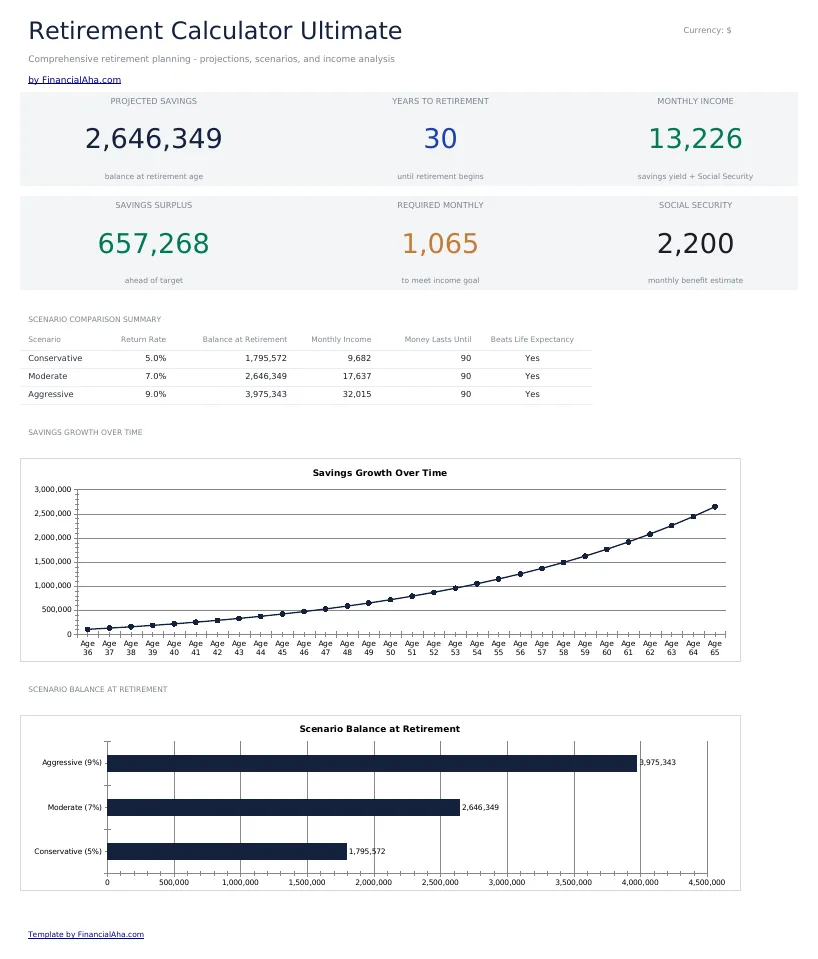
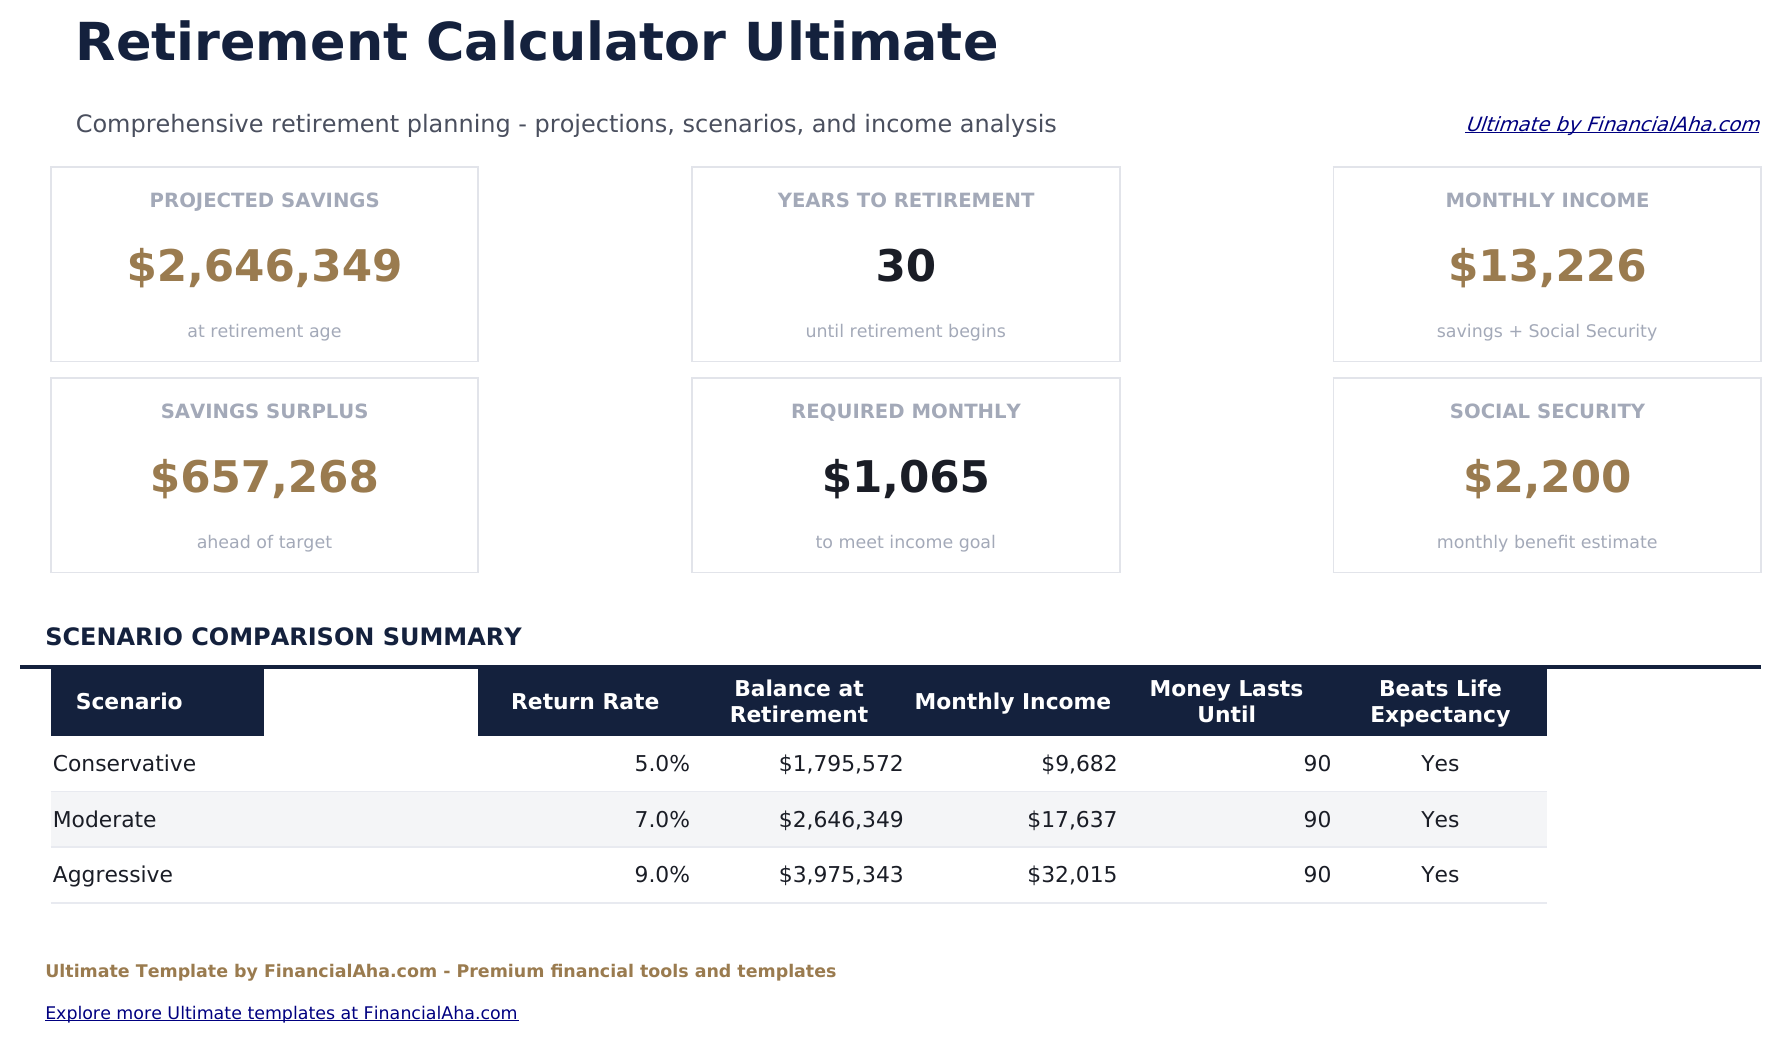
- Dashboard with 6 KPIs: projected savings at retirement, years to retirement, monthly income (savings plus Social Security), savings surplus vs your target, required monthly contribution to hit the goal, and Social Security monthly estimate
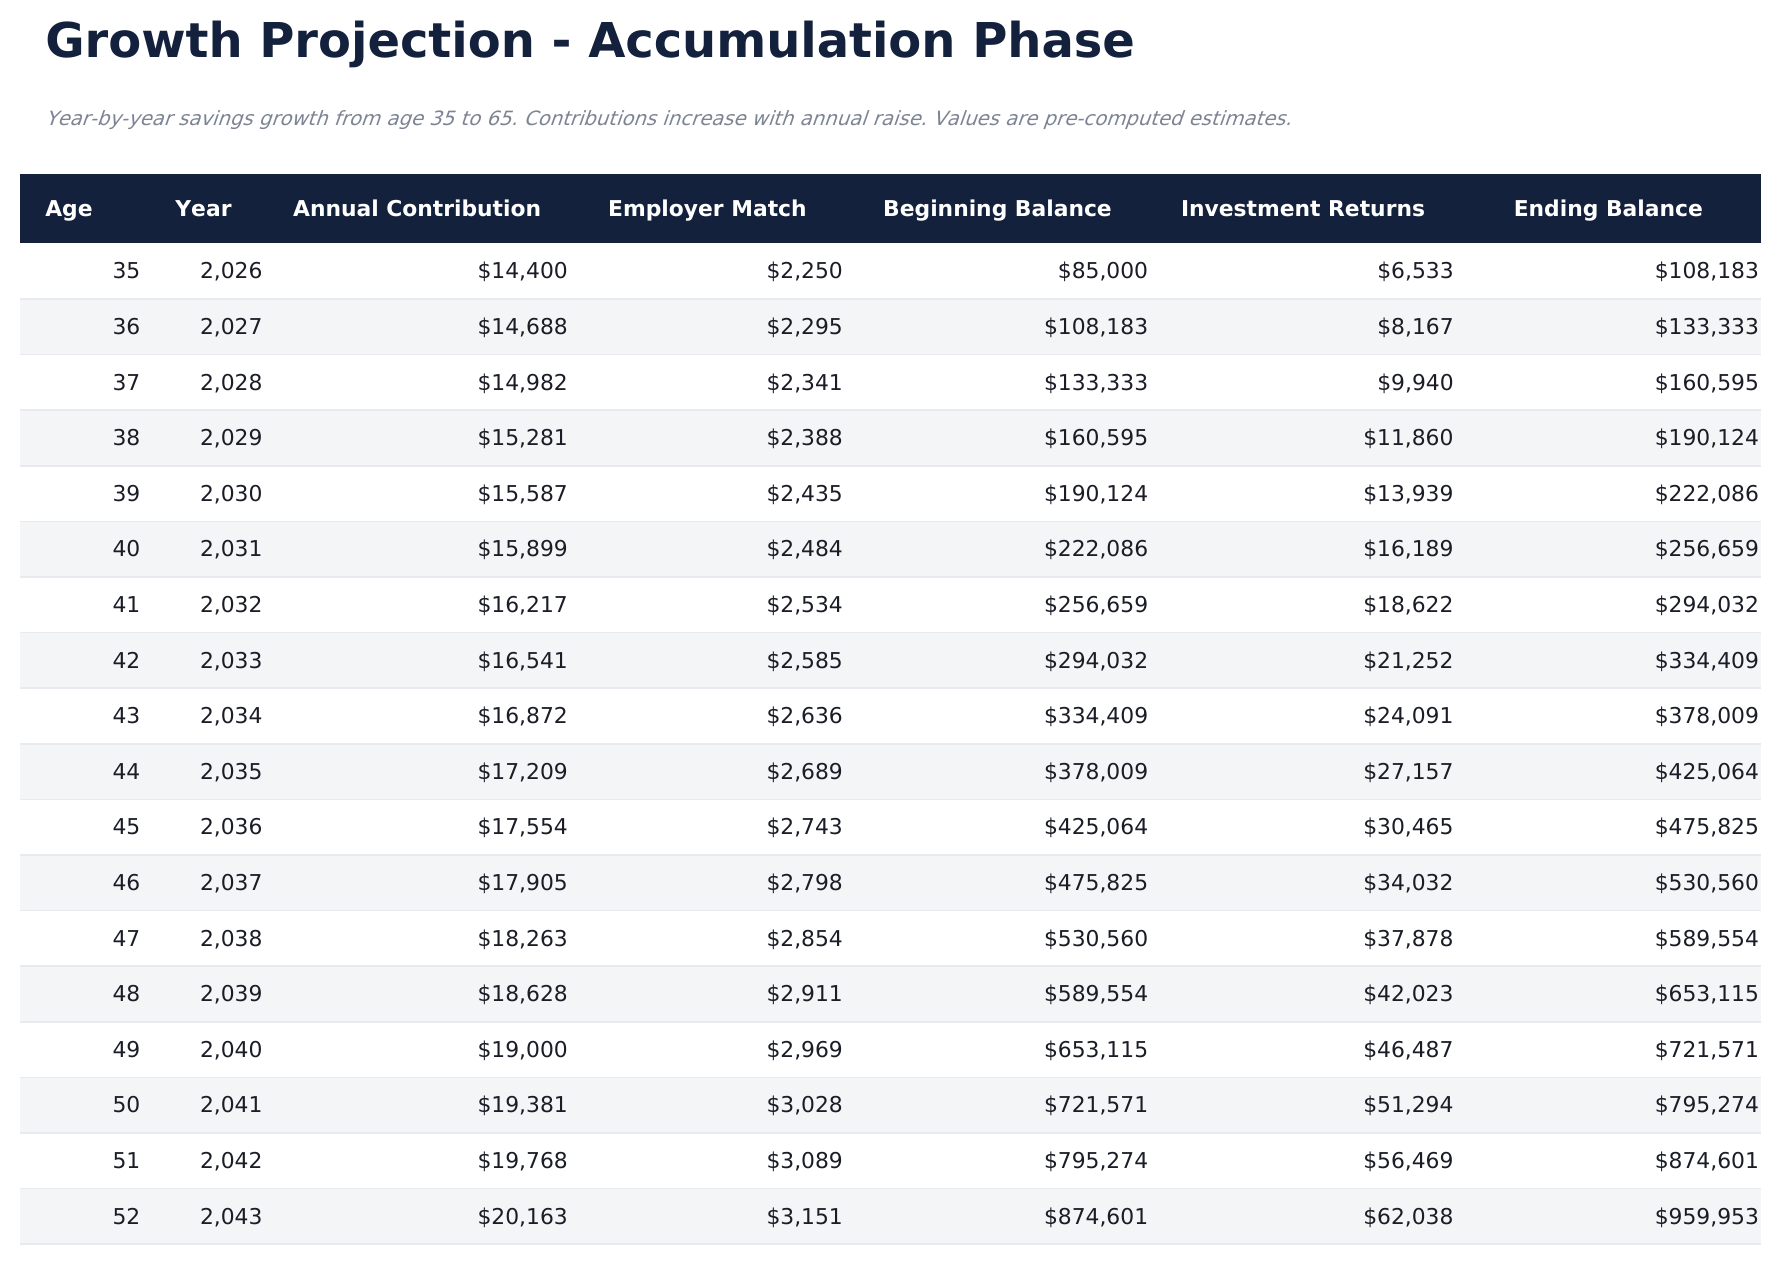
- Year-by-year accumulation projection from current age to retirement age with annual raise, employer match (rate plus salary cap), beginning balance, investment returns, and ending balance
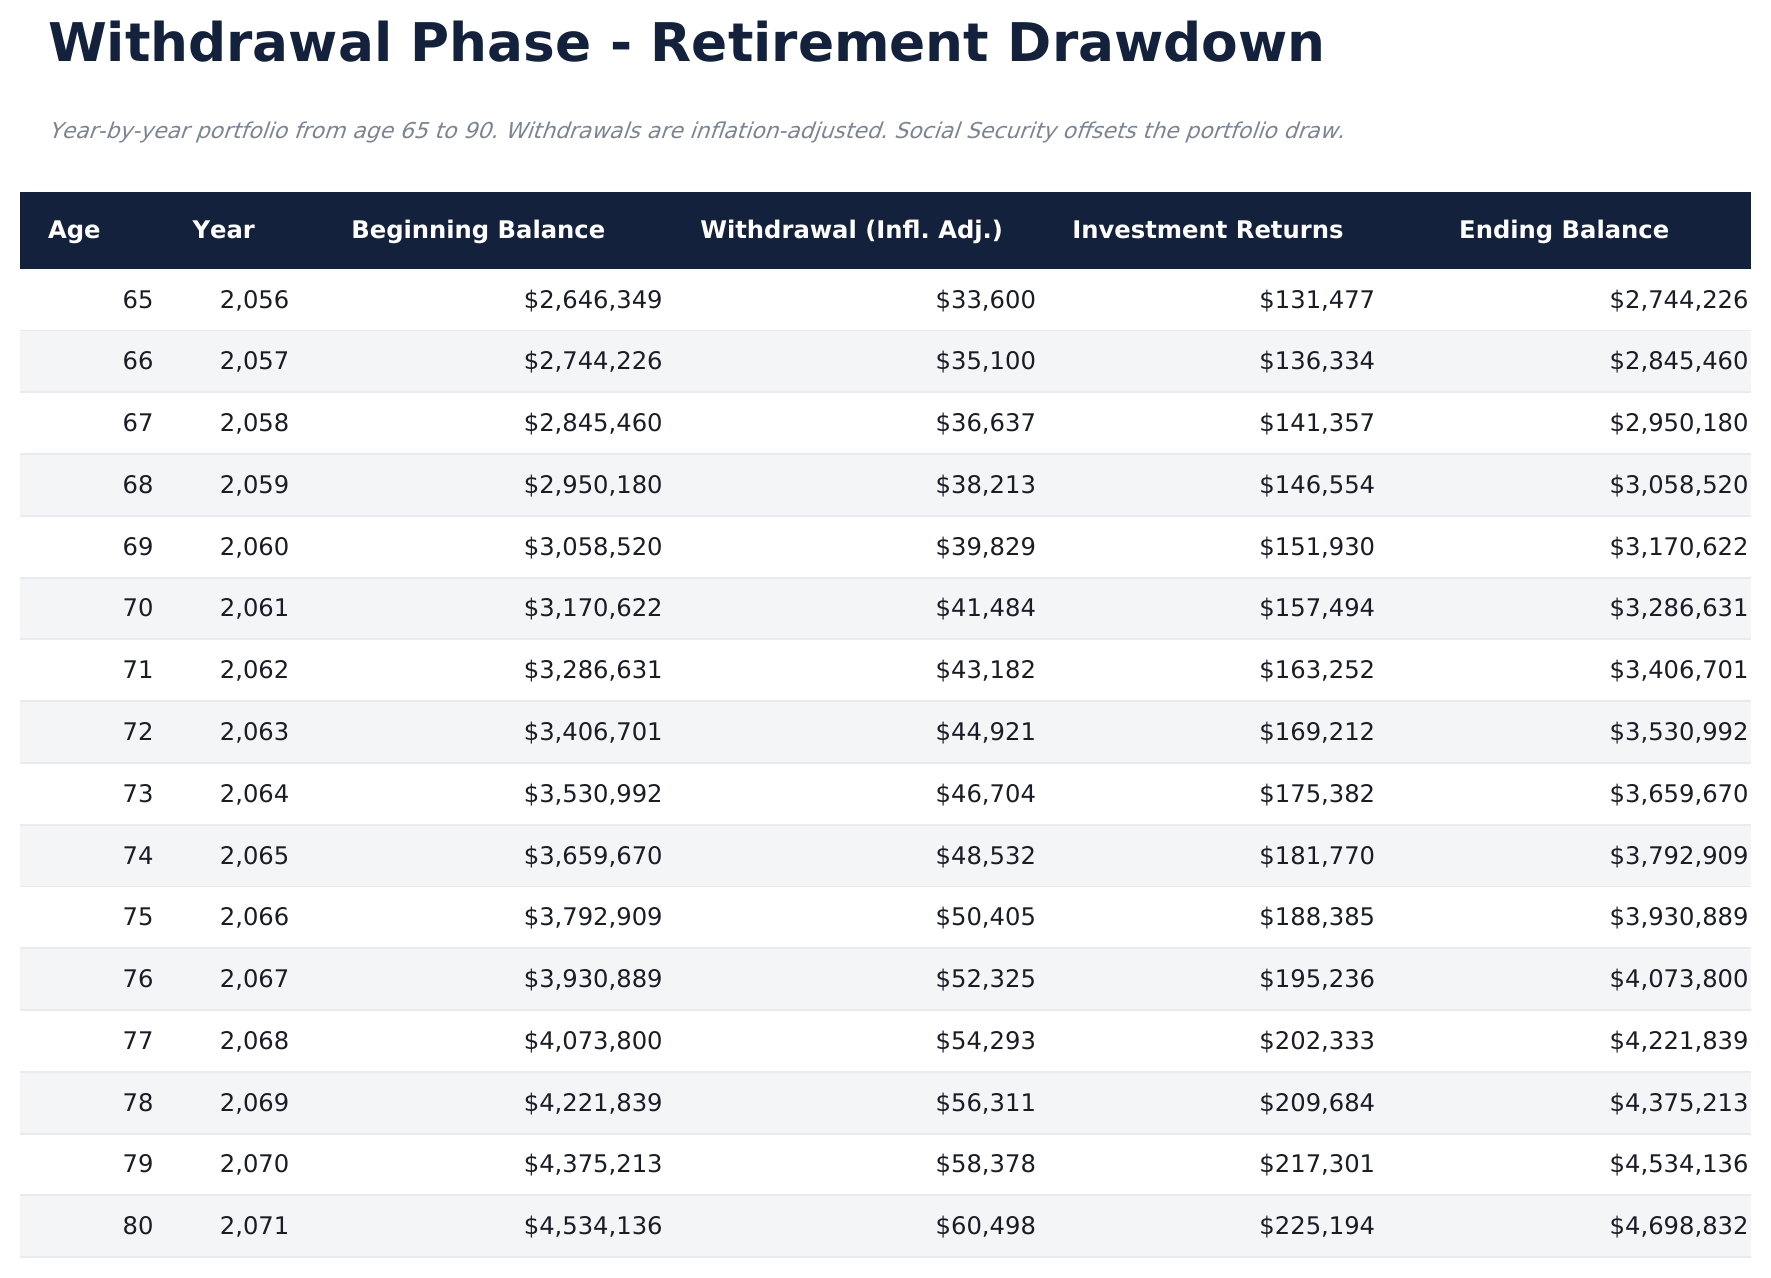
- Withdrawal phase modeling with inflation-adjusted annual draws and Social Security offset, showing portfolio balance through life expectancy
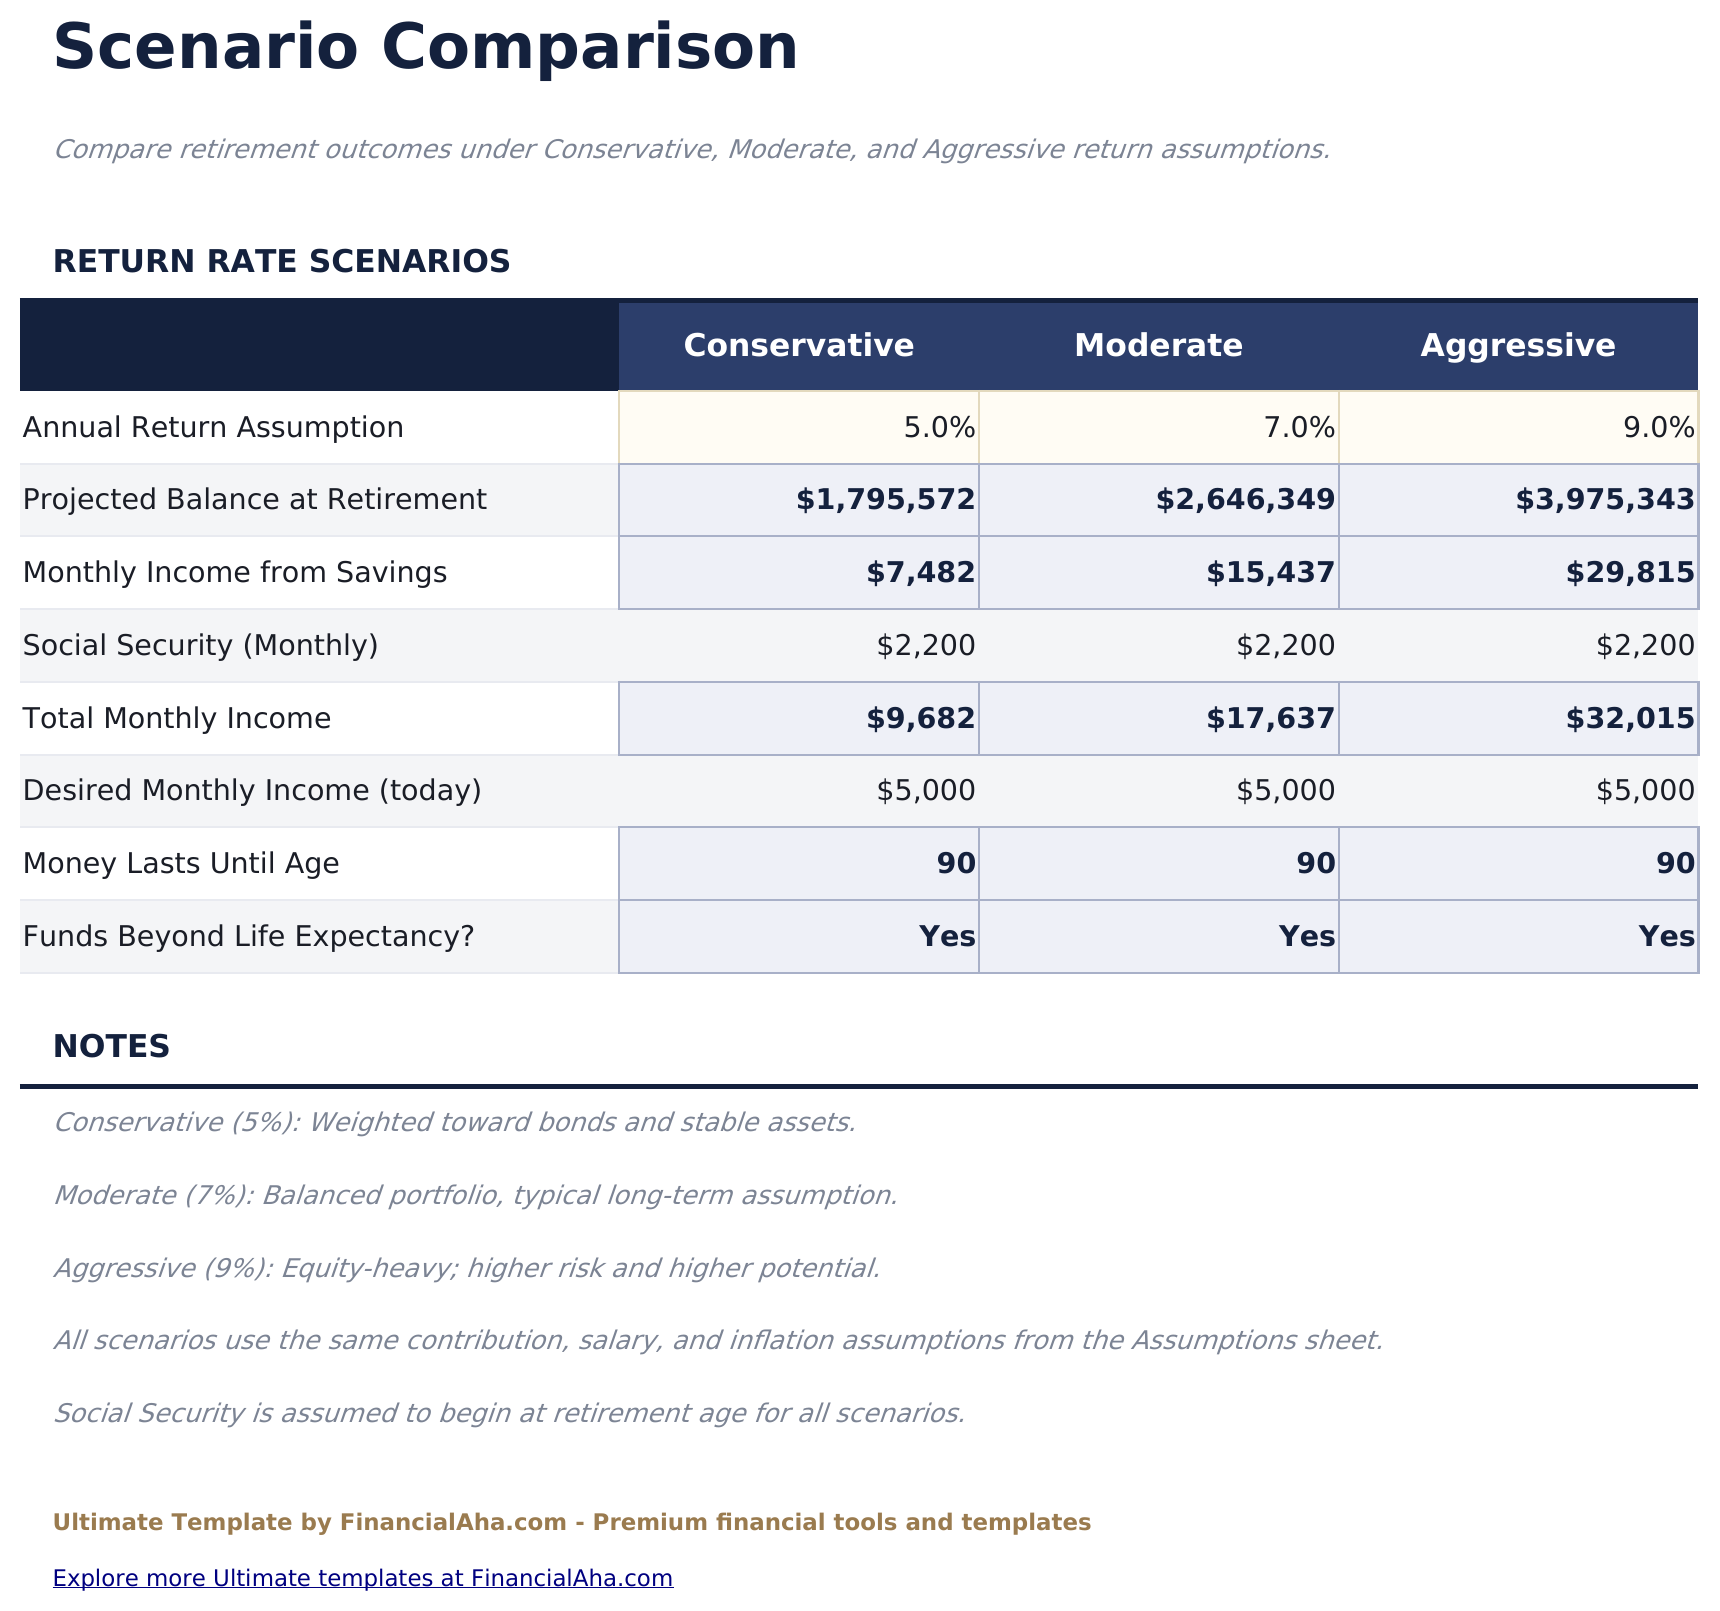
- 3-scenario comparison modeling conservative (5%), moderate (7%), and aggressive (9%) return assumptions side by side - balance at retirement, monthly income, and how long money lasts
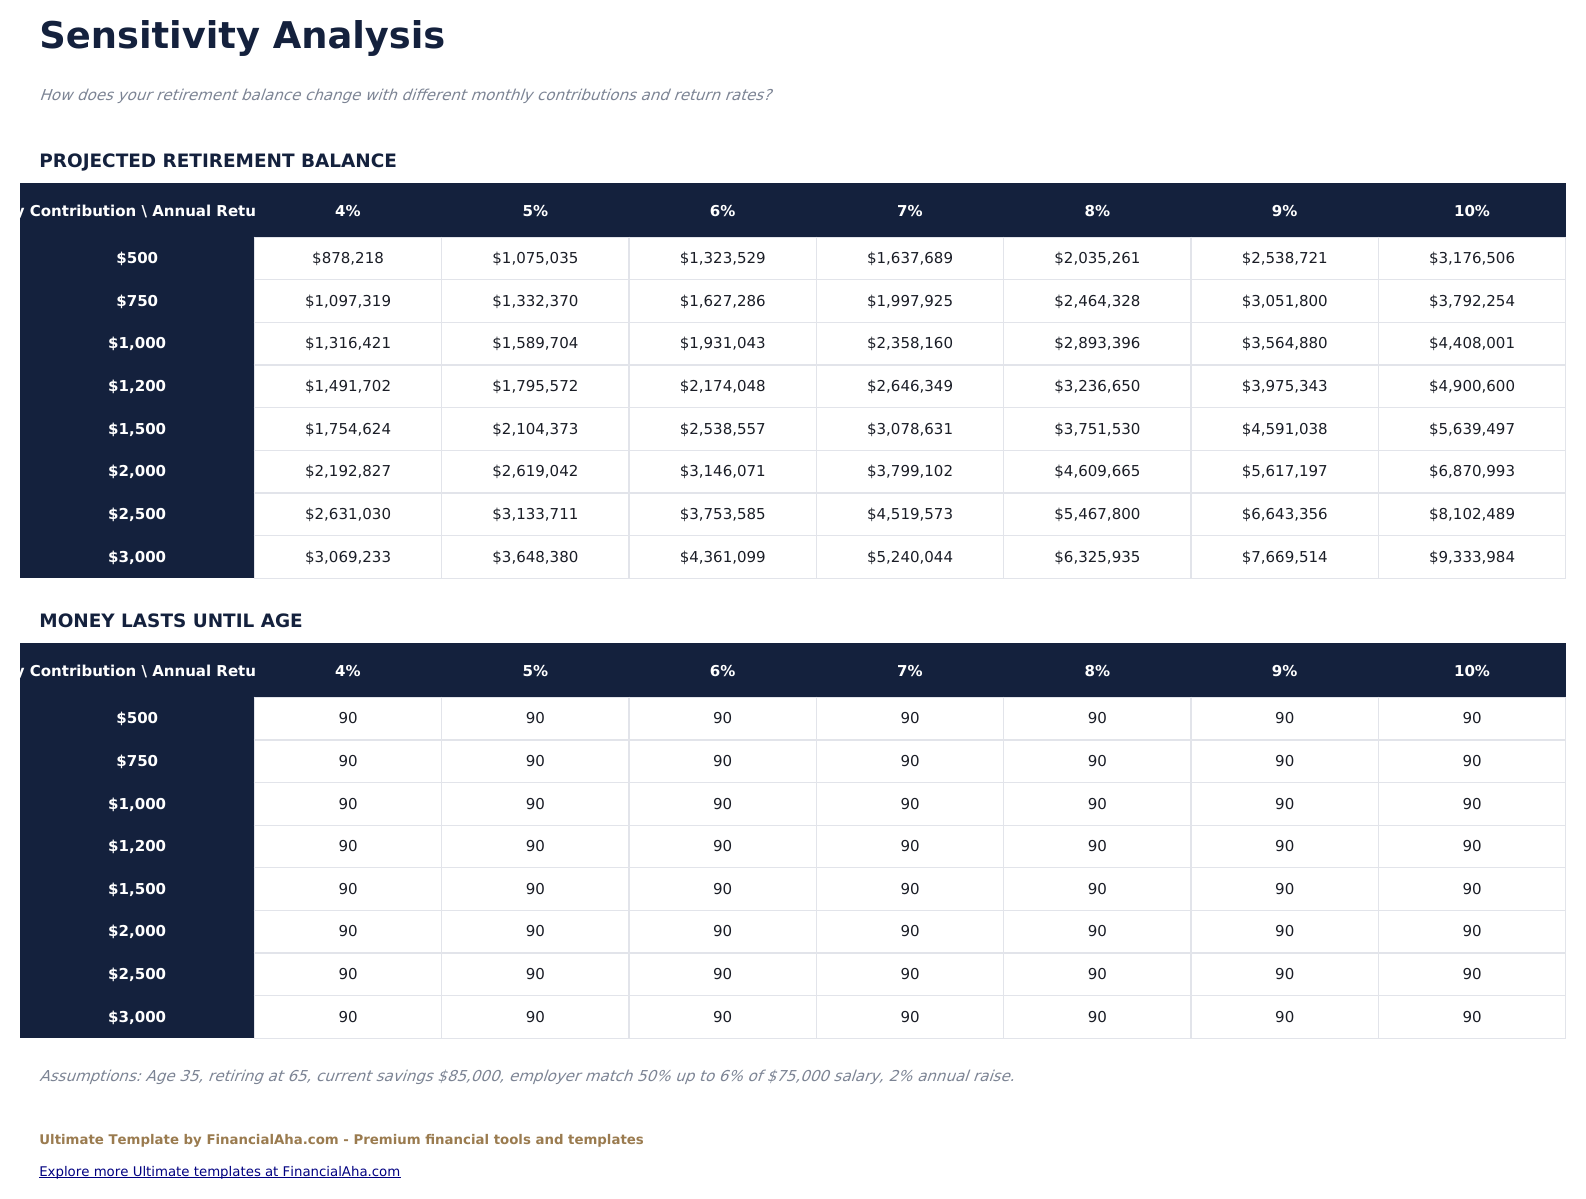
- Sensitivity analysis grids comparing monthly contribution ($500 - $3,000) vs annual return rate (4% - 10%) for both projected balance and money-lasts-until age
- Separate pre-retirement and post-retirement return assumptions plus an inflation rate input
- Employer match modeling with match rate and salary cap (e.g. 50% up to 6% of salary)
- Works in Microsoft Excel, Google Sheets, and LibreOffice Calc with no macros required
Preview
See what's inside this template
How to Use This Template
Enter your assumptions
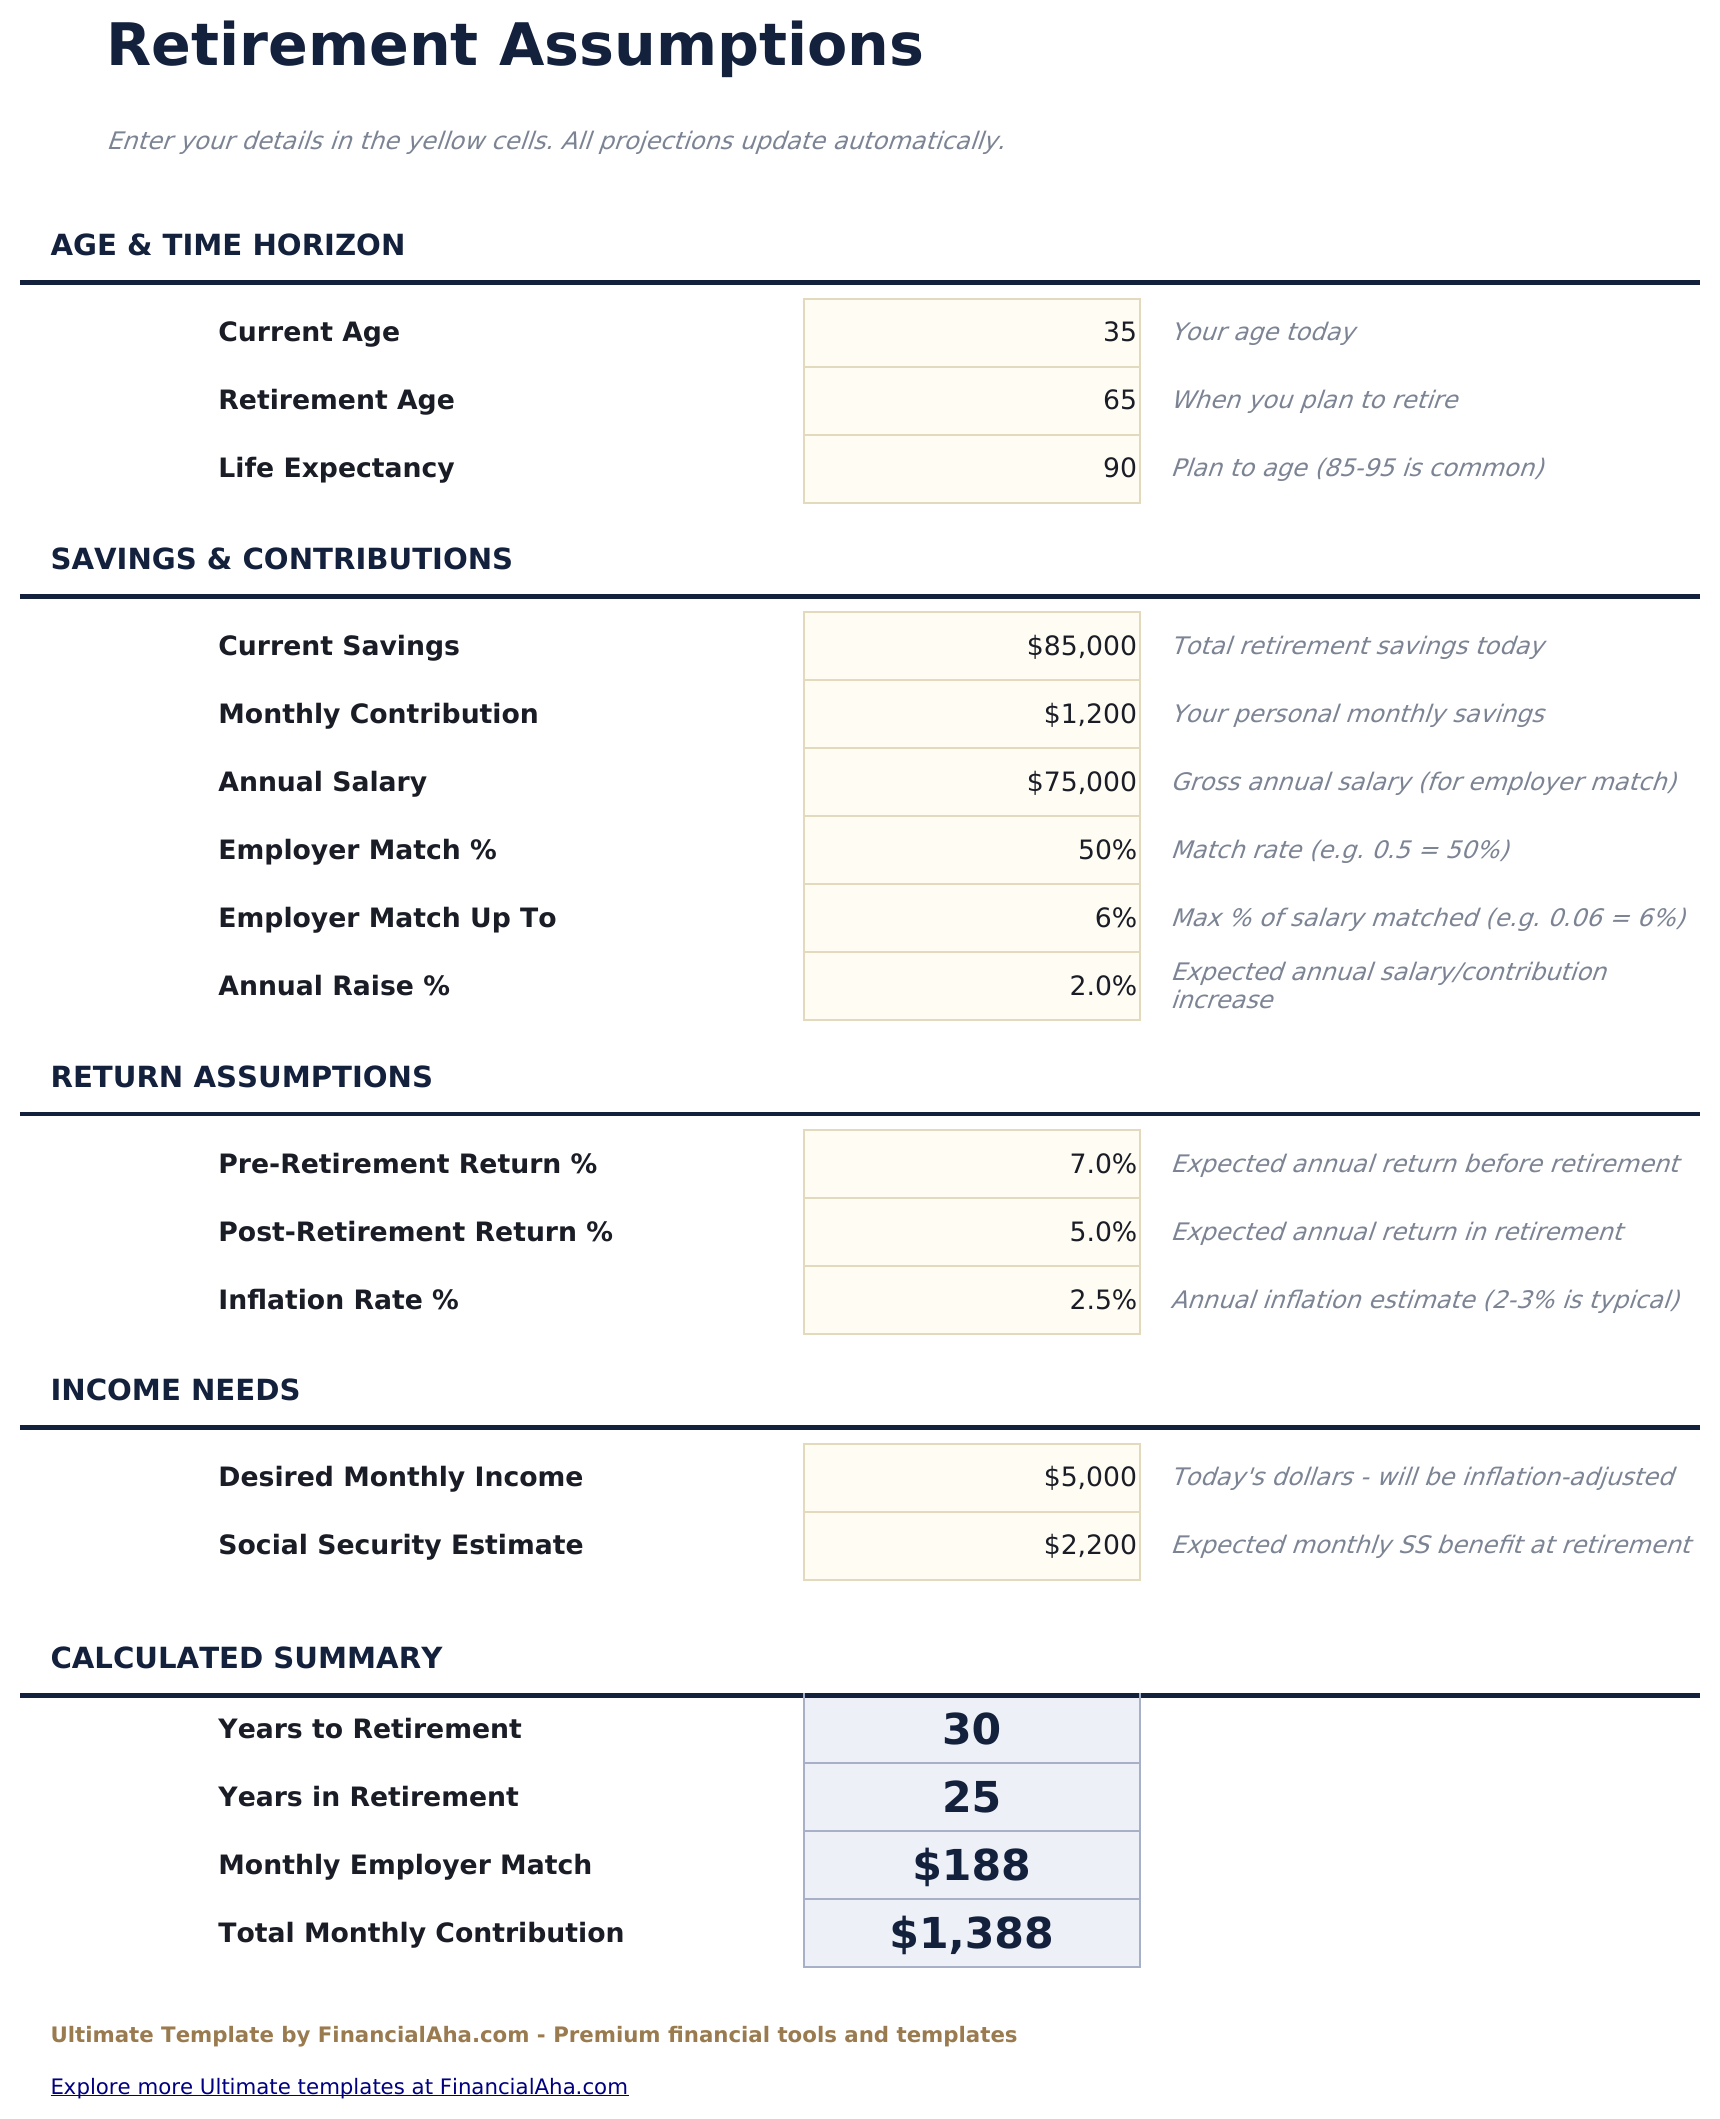
Go to the Assumptions sheet and fill in the light-gray cells: current age, retirement age, life expectancy, total current retirement savings, monthly contribution, salary and employer match, pre and post retirement returns, inflation, desired monthly income, and Social Security estimate.
Review the dashboard
The Dashboard summarizes the six headline KPIs: projected savings, years to retirement, monthly income, surplus vs target, required monthly contribution, and Social Security estimate.
Check the accumulation and withdrawal phases
Growth Projection shows year-by-year contributions, employer match, returns, and ending balance until retirement. Withdrawal Phase shows whether the portfolio lasts through life expectancy.
Compare scenarios and stress test
Scenario Comparison models conservative, moderate, and aggressive return assumptions side by side. Sensitivity Analysis shows how the outcome changes as you vary monthly contribution and return rate.
Customer Reviews
What Our Customers Say
"If I get half as good at handling my finances as you are at customer service, this'll be the best $26 I've spent lately."
"Great tool! Simplifies financial planning without the hassle of complex spreadsheets."
"I recently purchased your super convenient spreadsheet, it really helps me!"
"They're great and super intuitive. Thank you!"
Built by Claude AI. Perfected by us.
We use Claude AI to draft each template, after a deep research. Then our team steps in. We refine the layout, stress-test every formula, fix edge cases, and polish the design until it feels like something we would actually use ourselves. The AI gets us 80% there. The last 20% is all human judgment.
One-time purchase. No subscription. Works in Excel & Google Sheets.
Frequently Asked Questions
Does it track each retirement account separately (401k, IRA, Roth)?
No. The template uses a single combined balance and monthly contribution covering all your retirement savings, with one pre-retirement return assumption. Add up the balances across your 401k, IRA, Roth, and brokerage accounts before entering them in the Assumptions sheet.
How does the scenario comparison work?
The template projects your portfolio under 3 return assumptions - conservative (5%), moderate (7%), and aggressive (9%) - showing balance at retirement, monthly income, and how long the money lasts for each scenario side by side.
Does it model withdrawals in retirement?
Yes. The Withdrawal Phase sheet shows year-by-year drawdown from retirement age through life expectancy with inflation-adjusted withdrawals and the post-retirement return assumption applied to the remaining balance.
Can I include Social Security?
Yes. Enter your projected monthly Social Security benefit in the Assumptions sheet. The dashboard and withdrawal model factor this income into the required portfolio draw.
Does it account for inflation?
Yes. The Assumptions sheet has an inflation rate input, and the Withdrawal Phase inflation-adjusts the desired monthly income each year. The accumulation projection shows nominal balances.
What does the Sensitivity Analysis do?
Two grids show how the outcome shifts as you change monthly contribution (rows) and annual return (columns). One grid shows projected balance at retirement, the other shows how long the money lasts in retirement.
What do I get after purchase?
You receive an Excel file (.xlsx) that works in Microsoft Excel, Google Sheets, and LibreOffice Calc. Download it immediately after purchase - no signup or account required.
Is there a free version?
Yes. The free version of this template is available with basic features. The Ultimate version adds advanced analysis, more capacity, and additional sheets.
What if it does not work for me?
Contact us and we will help troubleshoot. The template works in Microsoft Excel, Google Sheets, and LibreOffice Calc with no macros required.
Highlights:
Looking for more Ultimate templates?
We offer Ultimate versions of our most popular spreadsheet templates with advanced features, more capacity, and deeper analysis.
Get every Ultimate template instead
All 58 Ultimate templates in one purchase for $299 - $1,102 value, you keep $803.