Break-Even Analysis Spreadsheet Template for Excel & Google Sheets
Find the unit volume and revenue at which each product covers all its costs. Built around the contribution-margin model: CM per unit = price minus variable cost, break-even units = fixed cost divided by CM per unit. Per-product and blended figures, expected profit at your expected volumes, margin of safety, and a sensitivity table that flexes price, variable cost, and fixed cost by plus or minus 20%. One spreadsheet, dual compatible with Microsoft Excel and Google Sheets.
Instant digital delivery · Terms & Conditions apply
See E-commerce Seller Bundle 3 templates included • $48 offOne-time purchase
Break-Even Analysis Spreadsheet
Everything in This Break-Even Spreadsheet
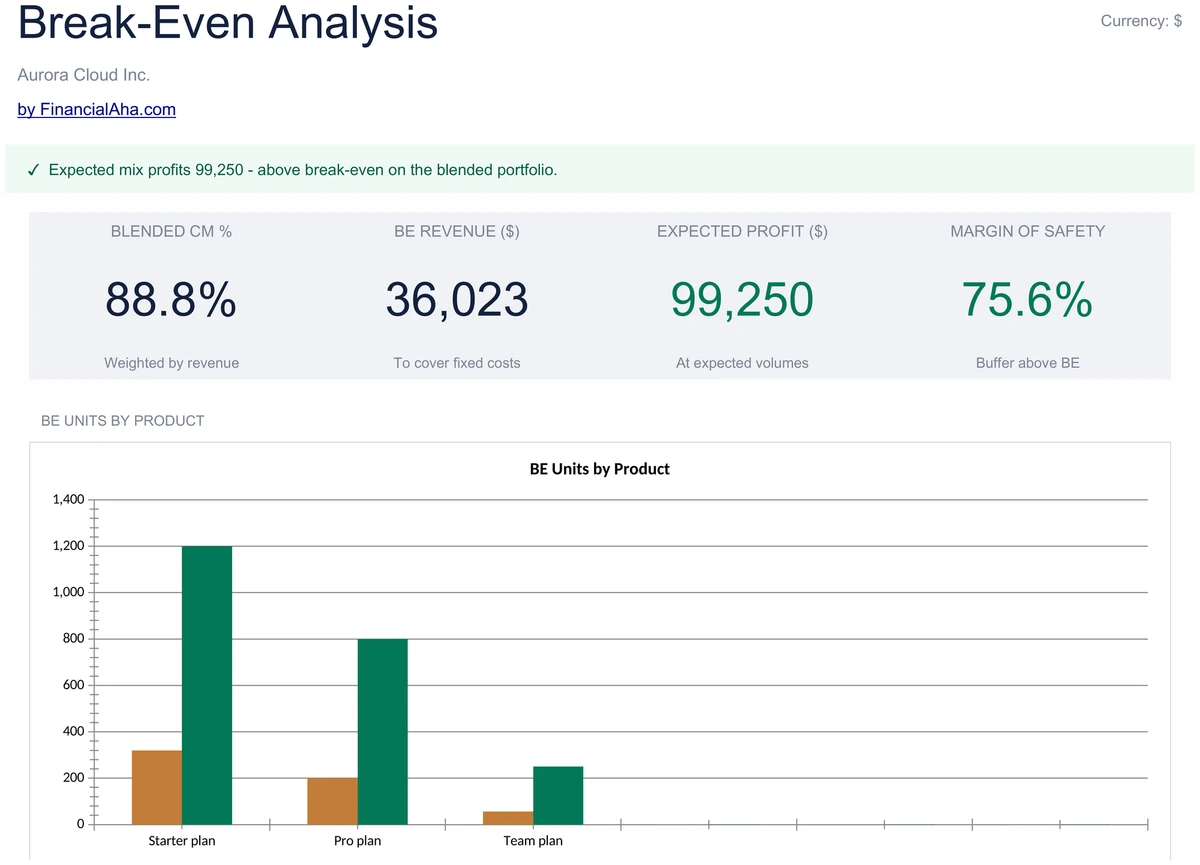
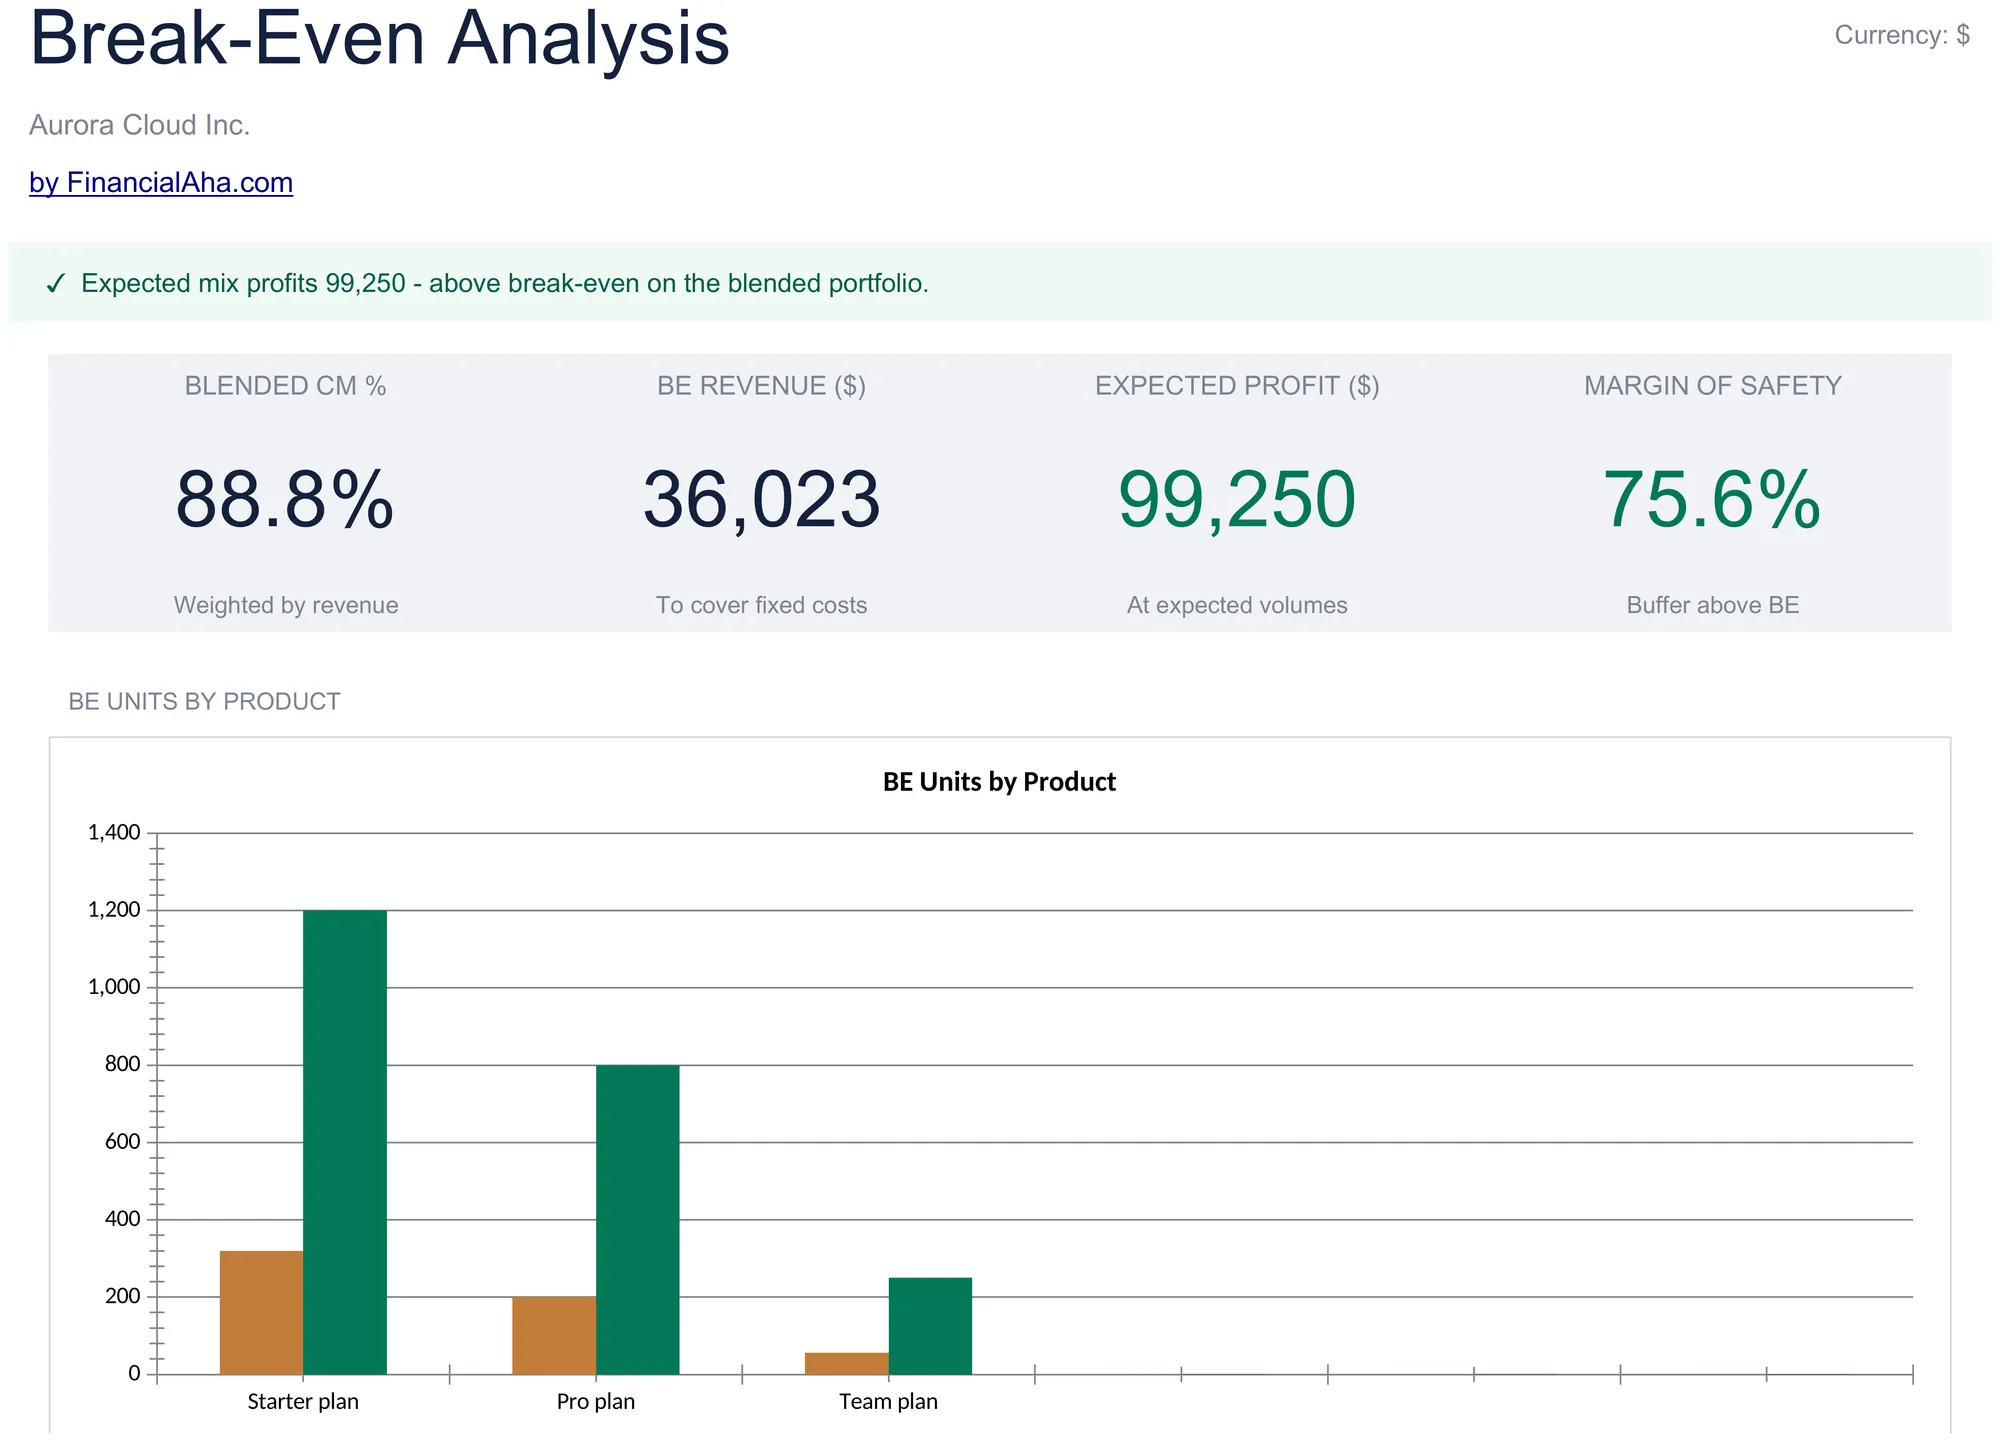
Break-Even at a Glance
Open the Dashboard and see four headline numbers - blended contribution margin %, break-even revenue, expected profit, and margin of safety. A column chart compares break-even units against expected volume for every product so the gap is obvious.
- 4 headline KPIs covering CM, BE revenue, profit, and MoS
- BE units vs expected volume column chart
- Pacing alert banner explains the mix
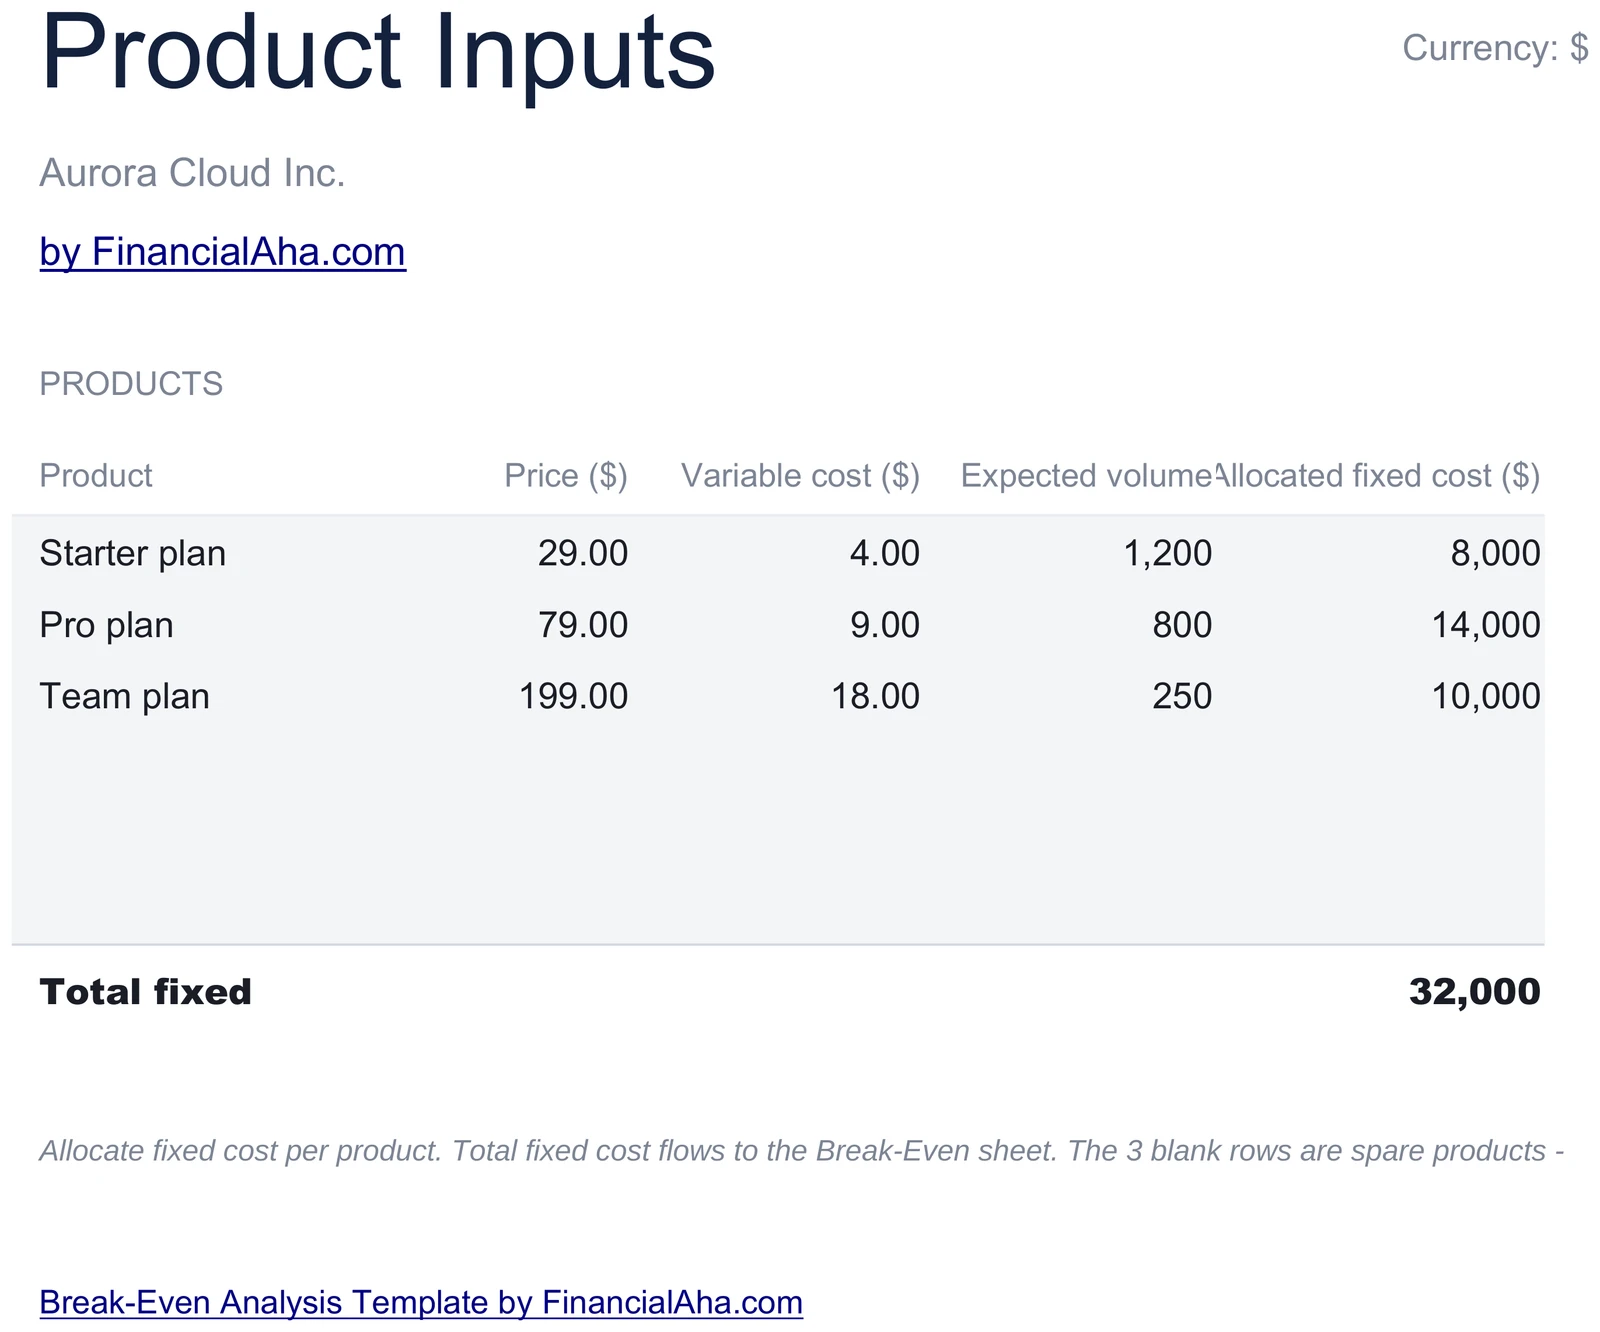
One Row Per Product
Enter price, variable cost, expected volume, and allocated fixed cost for each product. Add or remove rows freely - the Break-Even sheet, Sensitivity table, and Dashboard chart roll up from these inputs. Total fixed cost is summed at the bottom.
- Price, variable cost, expected volume, allocated fixed cost
- Add or remove product rows freely
- Total fixed cost auto-sums to the Break-Even sheet
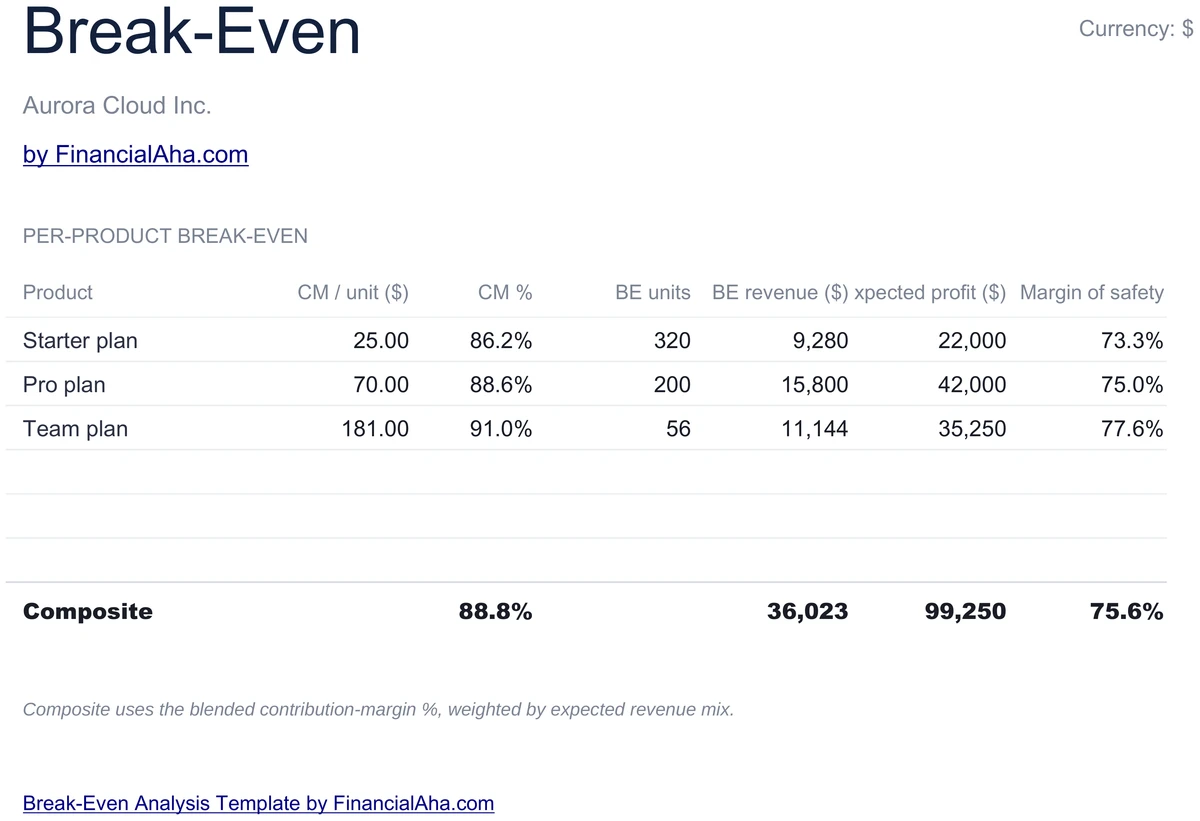
Per-Product Break-Even Math
The core sheet. For each product see contribution margin per unit, CM %, break-even units, break-even revenue, expected profit at your volume, and margin of safety. A composite row at the bottom shows the blended figures weighted by expected revenue mix.
- CM per unit, CM %, BE units, BE revenue per product
- Expected profit and margin of safety per product
- Composite row weighted by expected revenue mix
Stress-Test the Inputs
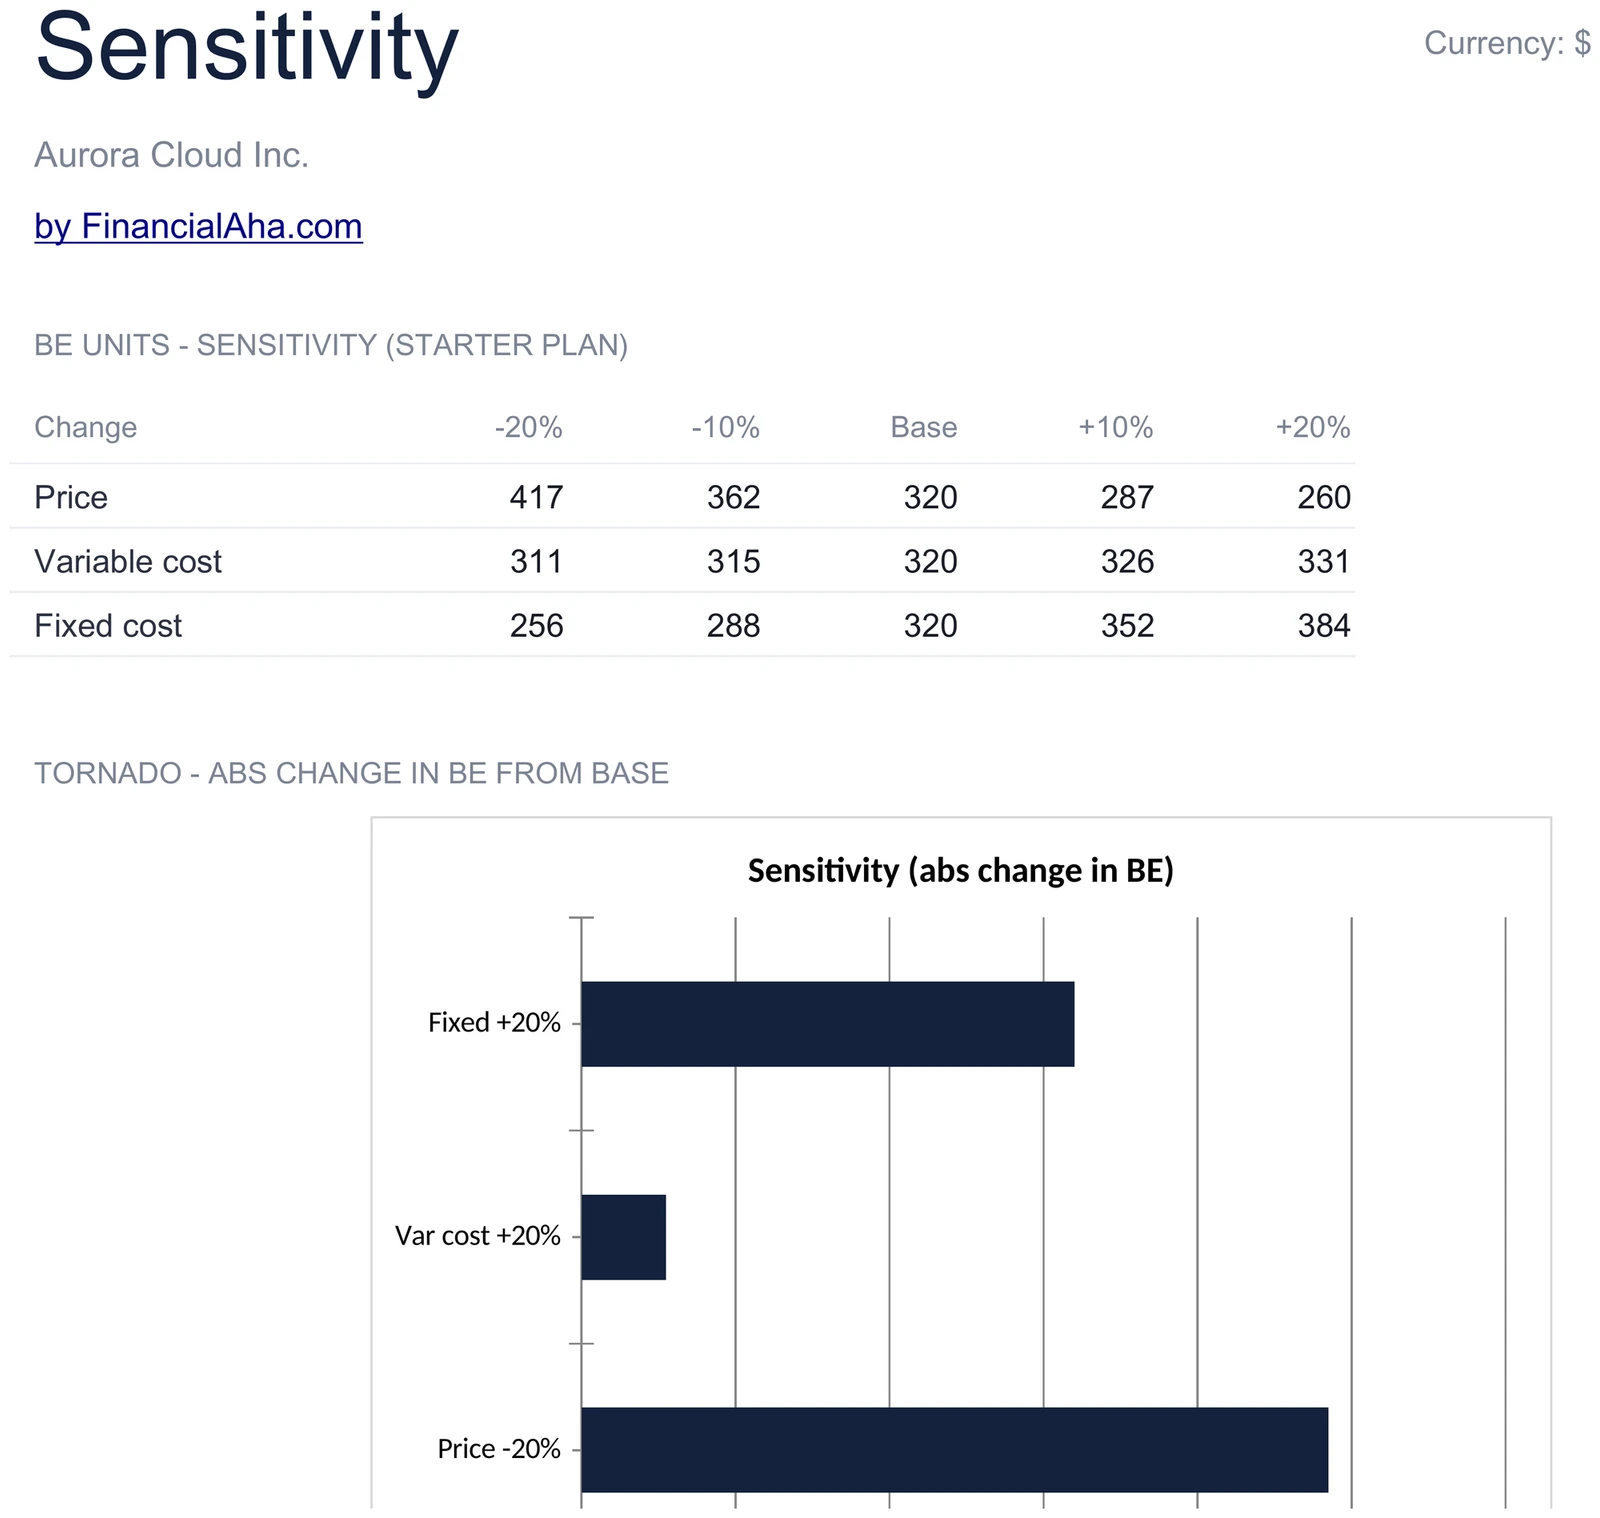
Flex price, variable cost, and fixed cost by minus 20%, minus 10%, plus 10%, and plus 20% on the lead product. The table shows BE units at each scenario, and a tornado chart ranks which lever moves break-even most in absolute terms.
- Plus/minus 10% and 20% scenarios on price, variable, fixed
- BE units recalculated at every scenario
- Tornado chart ranks lever impact
One Blended Break-Even
When you sell more than one product, individual break-evens are not enough. The composite line uses the blended contribution-margin %, weighted by expected revenue mix, to give a single break-even revenue figure for the whole portfolio.
- Blended CM % across the portfolio
- Single composite break-even revenue
- Margin of safety on the whole mix
Are You Above Break-Even?
Expected profit at your expected volumes tells you the answer in one number. The pacing banner on the Dashboard turns green when expected mix profits clear break-even, and amber if they do not - so the headline status is clear at a glance.
- Expected profit at expected volume per product
- Pacing banner flags green or amber
- Margin of safety expressed as %
Configure It for Your Business
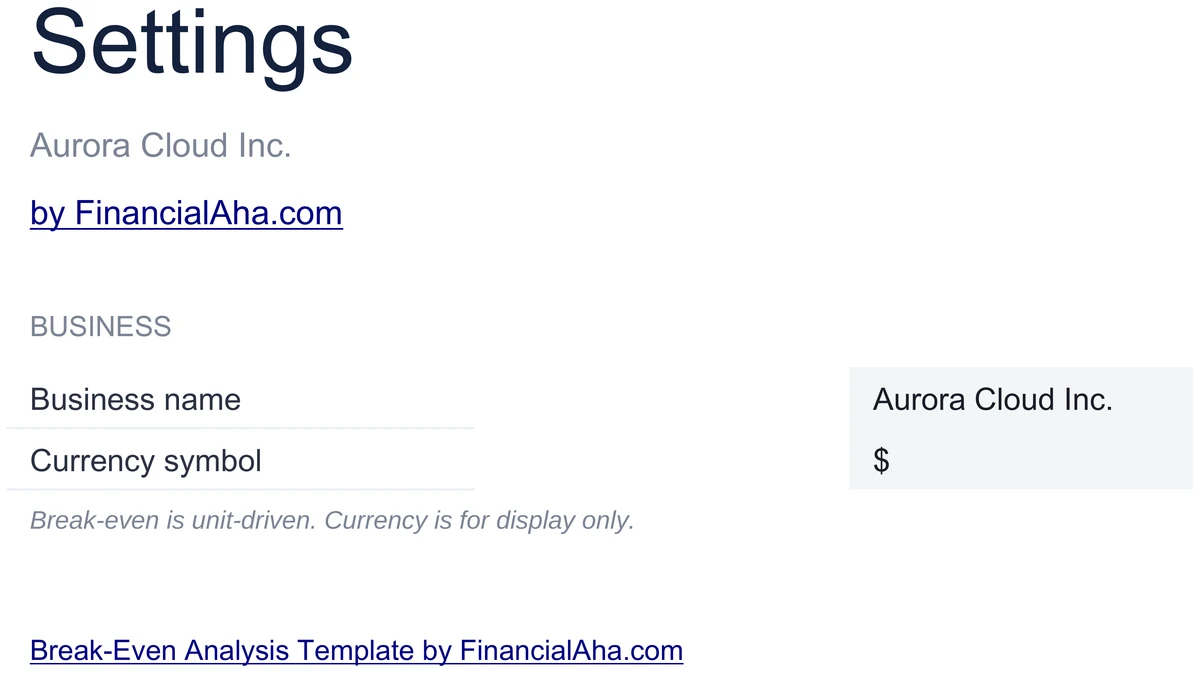
Set your business name and currency symbol on the Settings sheet. The whole workbook reads from these values, so headers, the dashboard meta, and the chart titles all use the same currency.
- Business name and currency symbol
- Used across every sheet header
- Set once - the workbook reads from here
Customizable & Flexible
Adapt the template to your business. Add or remove products, change allocations, flex the inputs - the break-even math and sensitivity table recalculate automatically. Works identically in Excel and Google Sheets.
- Add or remove products freely
- Reallocate fixed cost any way you want
- Excel and Google Sheets compatible
Ready to take control of your finances?
Set Up in 10 Minutes
How the Break-Even Template Works
Open in Excel or Google Sheets
Get instant access after purchase. Open in Microsoft Excel directly, or import into Google Sheets - no software to install, no add-ons.
Configure Your Business
Set your business name and currency symbol on the Settings sheet. Takes about 2 minutes.
Enter Your Products
On the Product Inputs sheet, enter price, variable cost, expected volume, and allocated fixed cost per product. Add as many rows as you need.
Read the Break-Even
The Break-Even, Sensitivity, and Dashboard sheets calculate per-product and blended figures, tornado chart included.
Built for Results
Why This Break-Even Template Works
Per-Product and Blended Break-Even
Break-even units and revenue for every product, plus a composite line weighted by expected revenue mix.
No Formulas to Write
Enter price, variable, fixed, and volume in highlighted input cells. CM, break-even units, expected profit, margin of safety, and the tornado chart are pre-built and update automatically.
Excel and Google Sheets
Works identically in Microsoft Excel and Google Sheets. No macros, no add-ons, no proprietary functions.
Free Lifetime Updates
Any updates we release to the break-even template included at no extra cost.
Your Pricing Data Stays Private
Runs entirely in your spreadsheet. Your data stays in your file - we never see or store it.
One-Time Purchase
Pay once, use forever. No subscriptions, no monthly fees, no recurring charges.
Got Questions?
Frequently Asked Questions
Is this template free to use?
This template is not free, but it is available for a one-time purchase. This purchase gives you lifetime access to the template and to any updates we release.
What do you mean by lifetime access?
Lifetime access means that you will have access to this template for as long as you need it. You will not be required to pay any additional fees for continued access to the template or to any updates we release.
Do I need to sign up to use this template?
You don't need to create an account with us. The template is delivered as an Excel file: open it directly in Microsoft Excel, or import it into Google Sheets from your own Google account if you prefer working there.
What are the benefits of using this template?
This template offers a range of benefits, including: Easy-to-use interface, Customizable to suit your needs, Secure and private, Free access to any updates we release, One-time purchase for lifetime access.
Can I get future updates?
Yes. Whenever we release an update to this template, you get it at no additional cost - lifetime access covers every version we publish. We do not commit to a fixed update schedule; improvements ship when they are ready.
Do you offer any discounts?
There are no discount codes for individual templates, but many templates are also part of a bundle that costs less than buying the same templates separately. Either way it is a one-time purchase with lifetime access and free updates.
Do you have any access to my financial data?
No, we do not have access to your financial data when you use this template. The template is a file you keep yourself, on your computer or in your own Google Drive, so your financial information never reaches us.
Is this template financial advice?
Our templates are not financial advice. They are tools designed to help you manage your personal finances more effectively. If you need personalized financial advice, consider consulting with a financial advisor or accountant.
Can I make my own changes and customize this template?
Yes, you can make your own changes and customize this template to suit your needs. The template is designed to be flexible and adaptable, allowing you to add or remove sections, change formulas, and adjust formatting as needed.
Do you offer technical support?
This is a self-service product, and we do not offer technical support. However, if you encounter any issues or have any questions about the template, please contact our team for assistance. Because everyone's financial situation is unique, consider consulting with a financial advisor or accountant if you need personalized financial advice.
Do you offer refunds?
Because these digital products are delivered instantly, purchases are generally final once you consent to immediate delivery at checkout. If the file we delivered has a genuine error, such as a formula that miscalculates or a feature its page describes but the file lacks, tell us what does not match: we will fix or replace it, or refund you if we cannot. Reporting within 30 days speeds resolution but never limits your statutory consumer rights; the full policy is in our Terms & Conditions.
Can't find the answer you're looking for? Contact our team
Instant digital delivery · Terms & Conditions apply
Highlights:
Know Your Break-Even
Get the Break-Even Analysis template and start finding the volume at which each product covers its costs in Excel or Google Sheets.