A capital gains spreadsheet logs every sale as a tax lot, classifies it short-term or long-term from the dates, and derives the rest: gains by holding period, estimated tax at your own rates, a bracket sensitivity grid, and wash-sale detection on the losses. This walkthrough follows the full structure with a worked example, twelve sales carrying $18,642.50 in realized gains and $3,849.60 in estimated tax. Our Capital Gains Calculator Ultimate Spreadsheet Template ($29) ships the same structure ready-made for Excel and Google Sheets.
Selling an investment is the easy part. Working out what the sale means at tax time is where it gets fiddly, because the same profit can be taxed two very different ways depending on a single fact: how long the position was held. Sell inside a year and the gain is generally ordinary income; hold past the line and a separate, usually lower, set of rates applies. Stack a dozen sales across a year, mix in a couple of losses and a repurchase or two, and the question of what a year of trading actually costs stops being arithmetic anyone wants to do in their head.
That is exactly the shape a spreadsheet handles well. The work breaks into a few parts that hand off in order: a ledger where each sale is logged once and classified automatically, a small set of tax rates that turn classified gains into an estimated bill, a grid that shows how sensitive that bill is to the rates, and a check that flags losses which might run into the wash-sale rule. The examples below come from our Capital Gains Calculator Ultimate Spreadsheet Template ($29), which ships the whole thing ready-made for Excel and Google Sheets. Every formula in it is visible and editable, so the structure is reproducible by hand if you would rather build your own capital gains spreadsheet from scratch.
What a capital gains spreadsheet has to hold
Strip away the broker statements and there are only a few kinds of data behind a capital gains figure:
- Per-sale records. Each realized lot, meaning a batch of shares sold, needs an asset name, a share count, a buy date, a sell date, a cost basis, and the proceeds. This is the raw material for everything else.
- A holding-period rule. One number, the count of days that separates short-term from long-term, applied to every lot.
- Tax rates. One rate for short-term gains and one for long-term, which convert classified gains into an estimated bill.
- Derived views. Totals by holding period, an estimated tax and effective rate, a sensitivity grid, and a wash-sale check. These are all calculations, not entries.
The Ultimate workbook gives each of these its own place across five working sheets, a Tax Lots ledger, a Tax Summary, a Sensitivity sheet, a Wash Sale Tracker, and a Dashboard, with a How to Use sheet carrying the instructions. The walkthrough follows them in the order the work happens, starting with the ledger that feeds all of them.
Log each sale once: the Tax Lots ledger
The Tax Lots sheet is the only place a sale is ever typed, and every other sheet reads back from it. It holds up to 50 realized transactions in a single period. Six columns are entries, and four are computed. You type the Asset, the number of Shares, the Date Bought, the Date Sold, the Cost Basis, and the Proceeds. From those the sheet fills in the Gain or Loss, the percent return, the Days Held, and the short-term or long-term Type.
The formulas are plain. Gain or Loss is proceeds minus cost basis. Percent return is that gain divided by the cost basis. Days Held is the sell date minus the buy date. Type compares Days Held against the holding-period cell that sits above the table, which ships set to 365, and returns Long-Term when the count is greater and Short-Term otherwise. Cost Basis is described on the How to Use sheet as the total amount paid to acquire the position including fees, and Proceeds as the amount received from the sale net of fees, so brokerage costs fold into the two figures you type rather than needing a column of their own.
One row makes the flow concrete. The sample’s first lot is 50 shares of AAPL bought on July 15, 2025 for a $7,125 cost basis and sold on March 10, 2026 for $9,462.50 in proceeds. The gain is $2,337.50, a 32.8 percent return, held 238 days, and because 238 is fewer than 365 the lot reads Short-Term. Compare that to NVDA: 40 shares bought April 1, 2024 for $3,600 and sold March 25, 2026 for $5,264, a $1,664 gain over 723 days, which crosses the line and reads Long-Term. Two lots with similar-sized gains land on opposite sides of the tax treatment purely on the calendar, which is the whole reason the Days Held and Type columns exist.
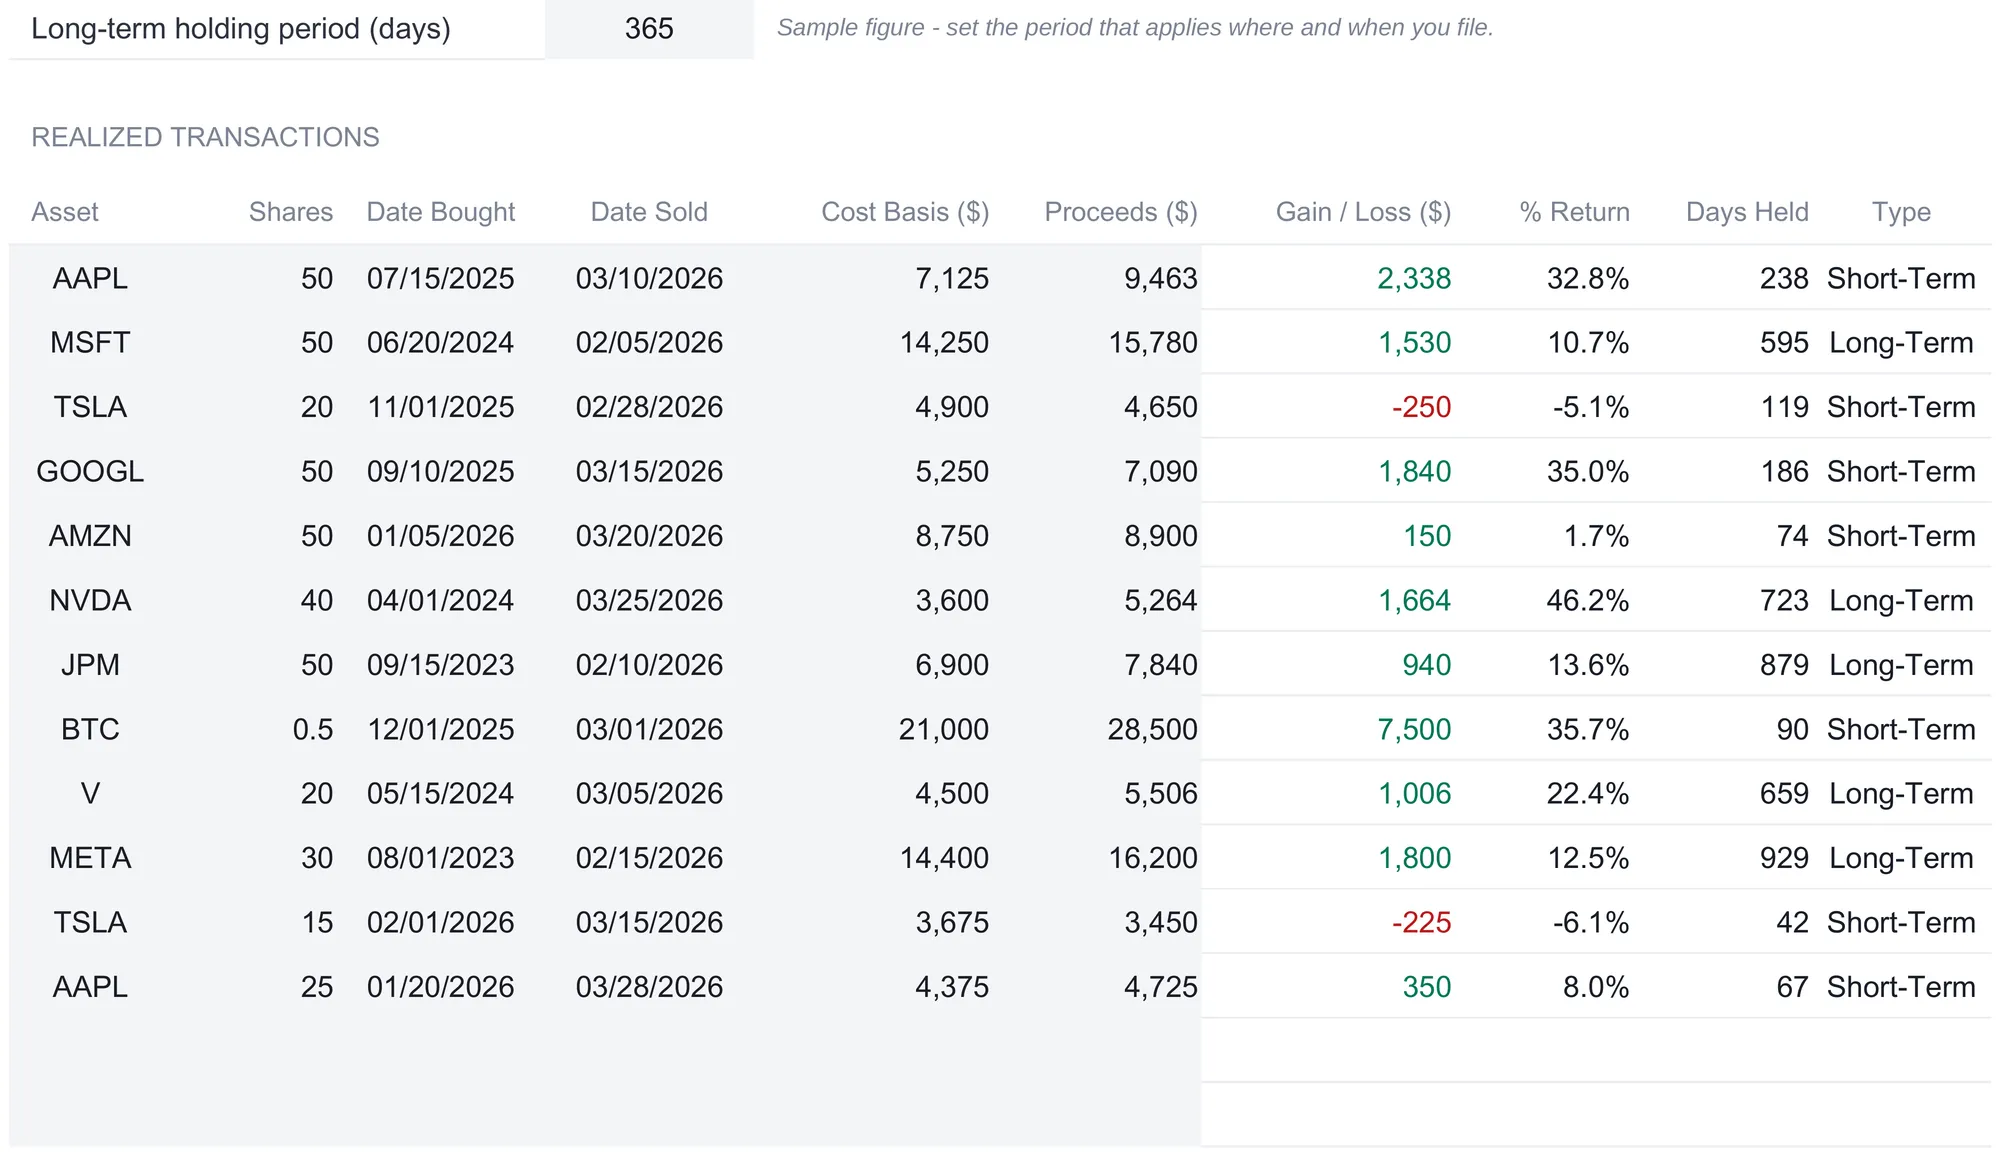
The sample carries twelve sales across a mix of stocks and one crypto lot: AAPL, MSFT, TSLA, GOOGL, AMZN, NVDA, JPM, BTC, V, META, a second TSLA lot, and a second AAPL lot. The largest single gain is the BTC lot, 0.5 of a coin bought December 1, 2025 for $21,000 and sold March 1, 2026 for $28,500, a $7,500 gain held 90 days and therefore Short-Term. Because the ledger does not care what the asset is, a fractional crypto position sits in the same table as round-lot equities and is classified by the same day count.
At the bottom, a TOTALS row sums the shares, cost basis, proceeds, and gain columns: 400.5 shares, $98,725 in combined cost basis, $117,367.50 in proceeds, and $18,642.50 in total gain or loss, with a blended 18.9 percent return on cost beside it. Below that, two subtotal lines split the gain by classification using the Type column: a short-term total of $11,702.50 and a long-term total of $6,940. Those two figures are the hinge of the whole file, because they are what the rates get applied to. Everything downstream reads them rather than re-deriving anything.
Two design details are worth copying into any hand-built version. The blank rows beneath the sample already carry the gain, return, days-held, and type formulas and already sit inside every total, so the next sale goes on the first free row and the whole workbook updates with no formula to drag. And because every summary reads this one ledger, the sheets cannot drift apart, which is exactly where hand-built trackers usually break, when a sale is typed into one summary but missed by another.
What the ledger does not do is fill itself. There is no broker connection and no trade import, so each sale is a handful of typed cells. For a year with a dozen realized lots that is a few minutes; for an active trader closing hundreds of positions it is real work, which is what a broker’s own gain/loss report and dedicated tax software exist to remove. The trade is the familiar one, an automated feed for someone who wants the numbers to arrive on their own, a spreadsheet for someone who wants to read every formula, change any of them, and keep the file on their own machine.
Set your rates: the Tax Summary sheet
The Tax Summary sheet is where classified gains become an estimated bill. It is short and deliberately so. Two rate cells drive it, each shipping as a sample and each labeled as yours to set.
The short-term block reads the short-term gains total from the ledger, $11,702.50, and multiplies it by the Short-Term Tax Rate, which ships at 24 percent, for $2,808.60 of short-term tax. The note beside the rate says to set it to the ordinary income rate that applies to you, since short-term gains are generally taxed as ordinary income. The long-term block reads the long-term gains total, $6,940, and multiplies by the Long-Term Tax Rate, which ships at 15 percent, for $1,041 of long-term tax.
A small but important detail lives in those formulas: each side is taxed only when its gains are positive. The rate is applied to the greater of zero and the gains total, so a net loss on either side is never multiplied by a rate to produce a negative tax. The How to Use sheet spells this out, and it is the honest behavior, because a net capital loss does not generate a refund by itself; how losses offset other gains or income is a separate rule the sheet leaves to the reader and a professional.
The tax liability summary at the foot ties it together. Total Realized Gains reads the ledger’s $18,642.50. Total Estimated Tax adds the short-term and long-term tax for $3,849.60. The Effective Tax Rate divides that tax by the total gains, landing at 20.6 percent, a blended figure that sits between the 15 percent long-term rate and the 24 percent short-term rate because the gains are split between the two. After-Tax Gains subtracts the tax from the gains for $14,792.90, the number that actually stays.
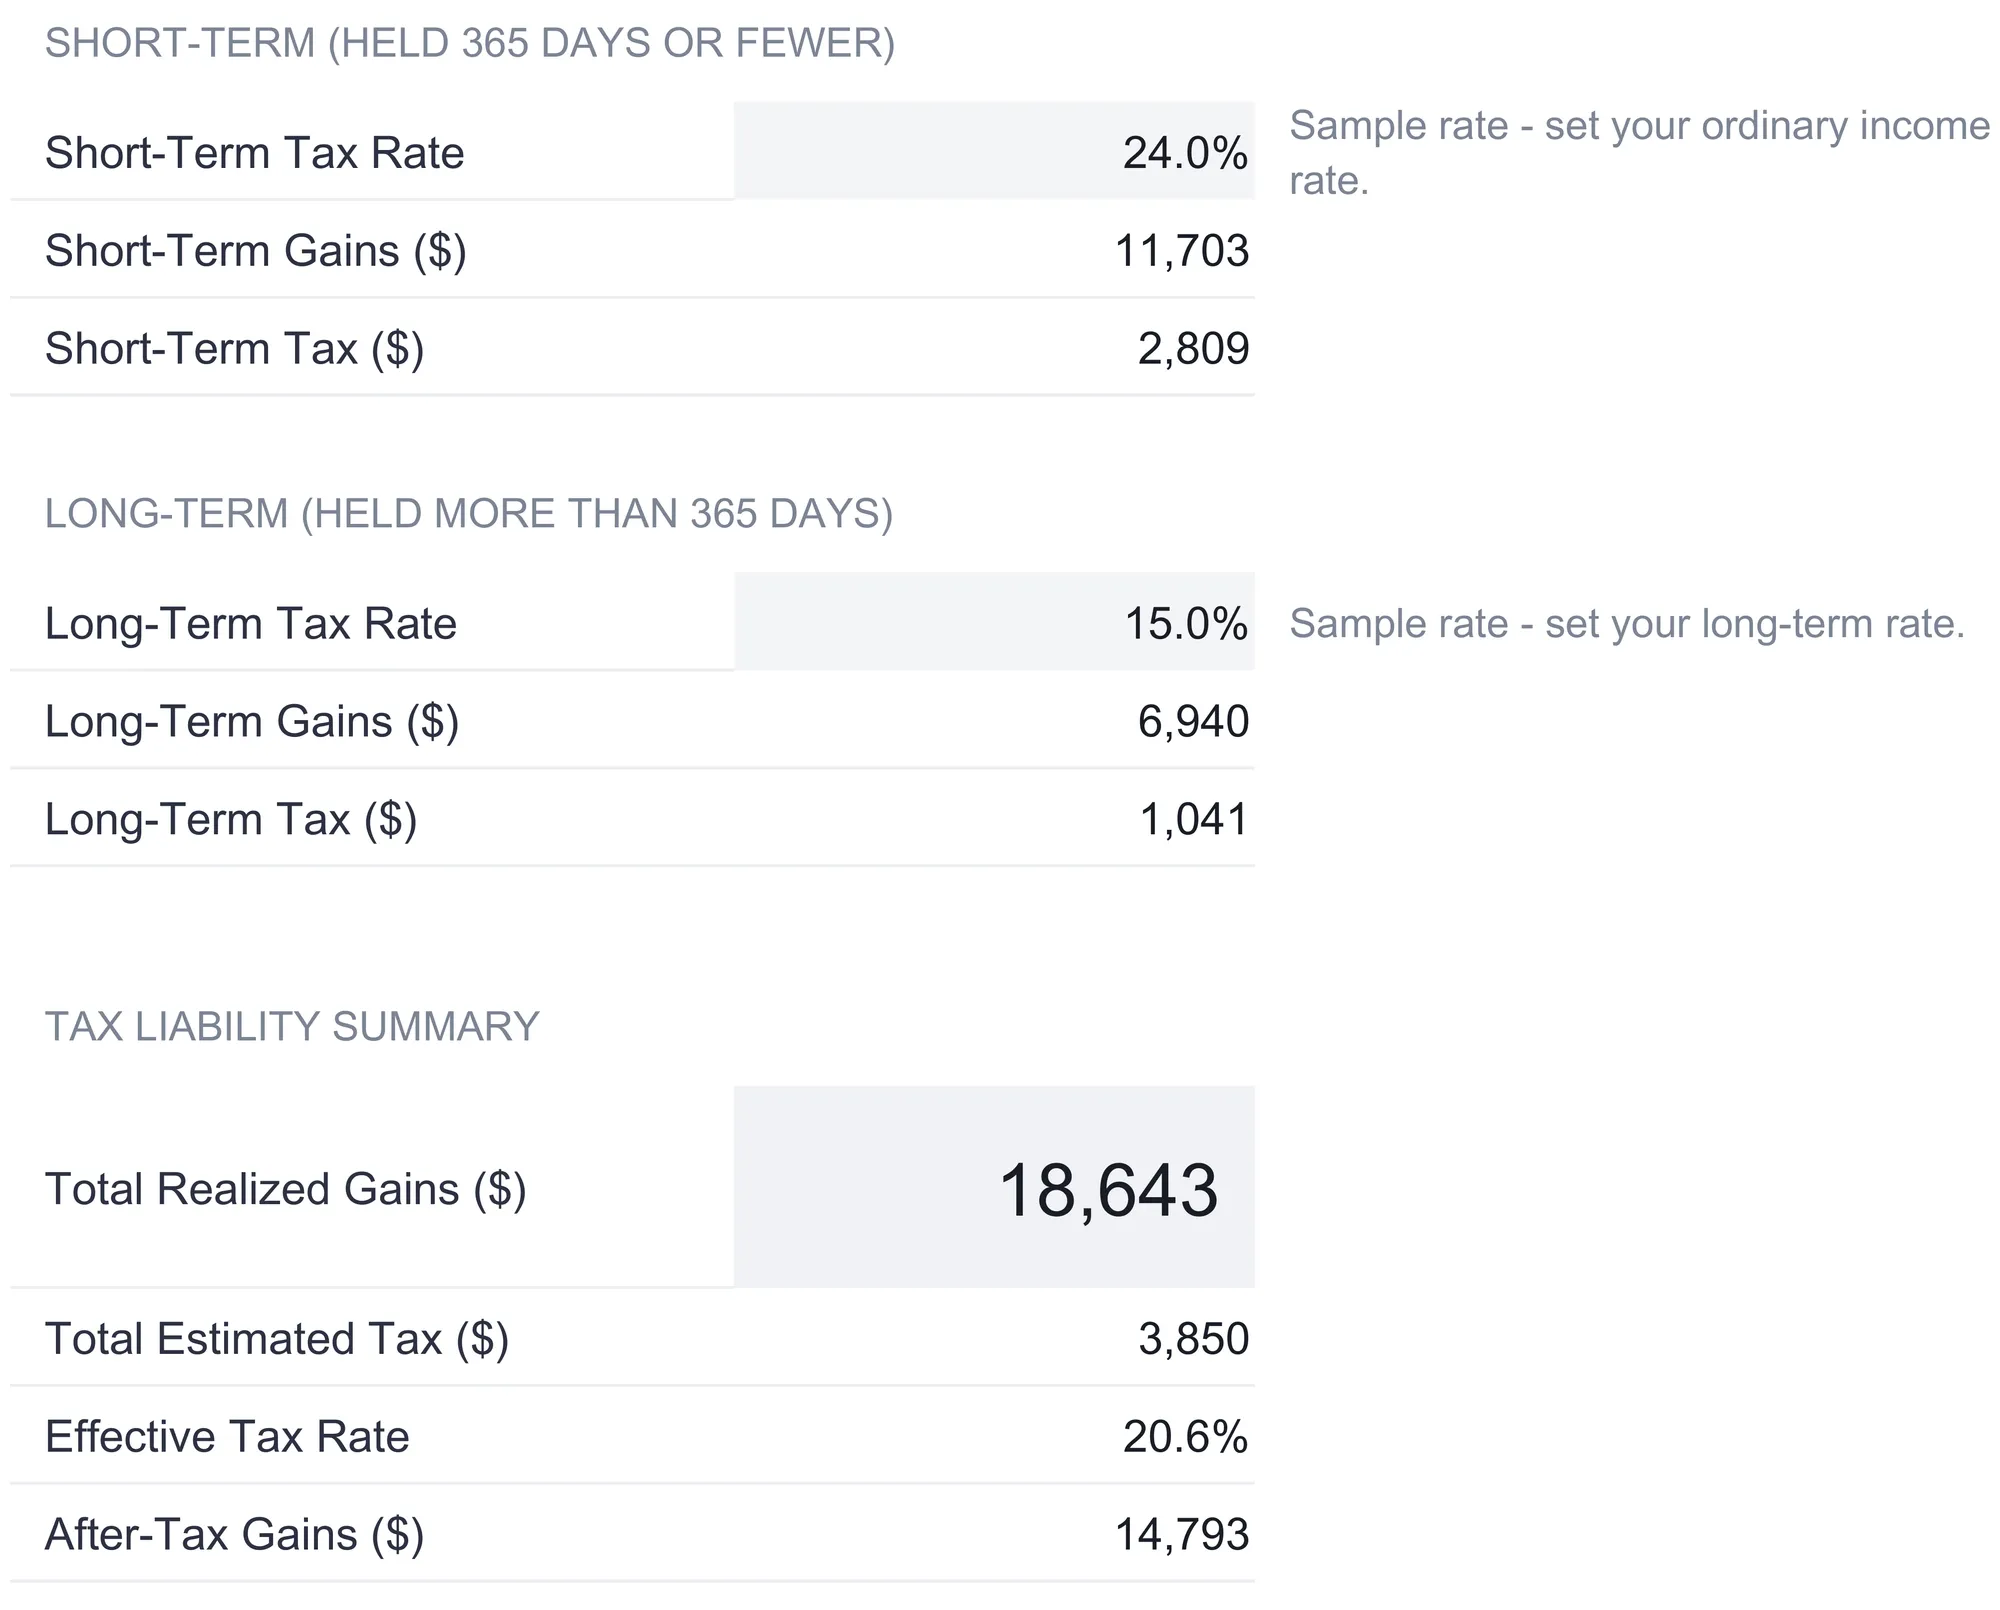
The effective rate is the number worth sitting with. Two portfolios can realize the same $18,642.50 and owe very different amounts depending on how the gains split between short and long, and the effective rate is the single figure that captures that mix. Pushing a sale from short-term to long-term, or the reverse, moves gains between the two blocks and moves this number, which is precisely what the next sheet is built to explore.
See the range: the Sensitivity sheet
A single pair of rates gives one answer. The Sensitivity sheet gives a whole field of them, because the rates that actually apply depend on total income and can change between years, and it is often more useful to see how the bill moves than to trust one guess.
The top of the sheet is a bracket grid titled Estimated Tax by Bracket Combination. Seven short-term rates run down the left edge, 10, 12, 22, 24, 32, 35, and 37 percent, the familiar ordinary-income steps. Five long-term rates run across the top, 0, 10, 15, 20, and 23.8 percent. Every cell in the grid is the total estimated tax if those two rates applied to the sample’s actual gains, so it reads the same $11,702.50 short-term and $6,940 long-term totals and prices them at each pairing. The lowest corner, a 10 percent short-term rate against a 0 percent long-term rate, comes to $1,170.25. The highest, 37 percent against 23.8 percent, reaches $5,981.65. The cell where the sample’s own 24 percent and 15 percent rates meet reads $3,849.60, the same figure the Tax Summary produces, which is a useful sanity check that the grid and the summary agree.
That last long-term column is not an arbitrary number. It ships at 23.8 percent because it already folds in the 3.8 percent Net Investment Income Tax on top of the 20 percent top long-term rate, so the grid shows the combined figure a higher-income seller might actually face rather than the headline rate alone.
Below the grid, a Tax Scenario Comparison prices the same gains against three full rate pairs at once, labeled Low, Mid, and High bracket, all editable. In the sample the Low column pairs a 12 percent short-term rate with a 0 percent long-term rate, producing $1,404.30 of total tax and $17,238.20 in after-tax gains. The Mid column uses the file’s own 24 and 15 percent, giving the familiar $3,849.60 of tax and $14,792.90 kept. The High column pairs 37 percent with 20 percent, for $5,717.93 of tax and $12,924.58 kept. Read across, the same $18,642.50 of realized gains keeps anywhere from about $17,238 to about $12,925 depending purely on the rate environment, a spread of more than $4,300 that no single-rate calculator would ever show.
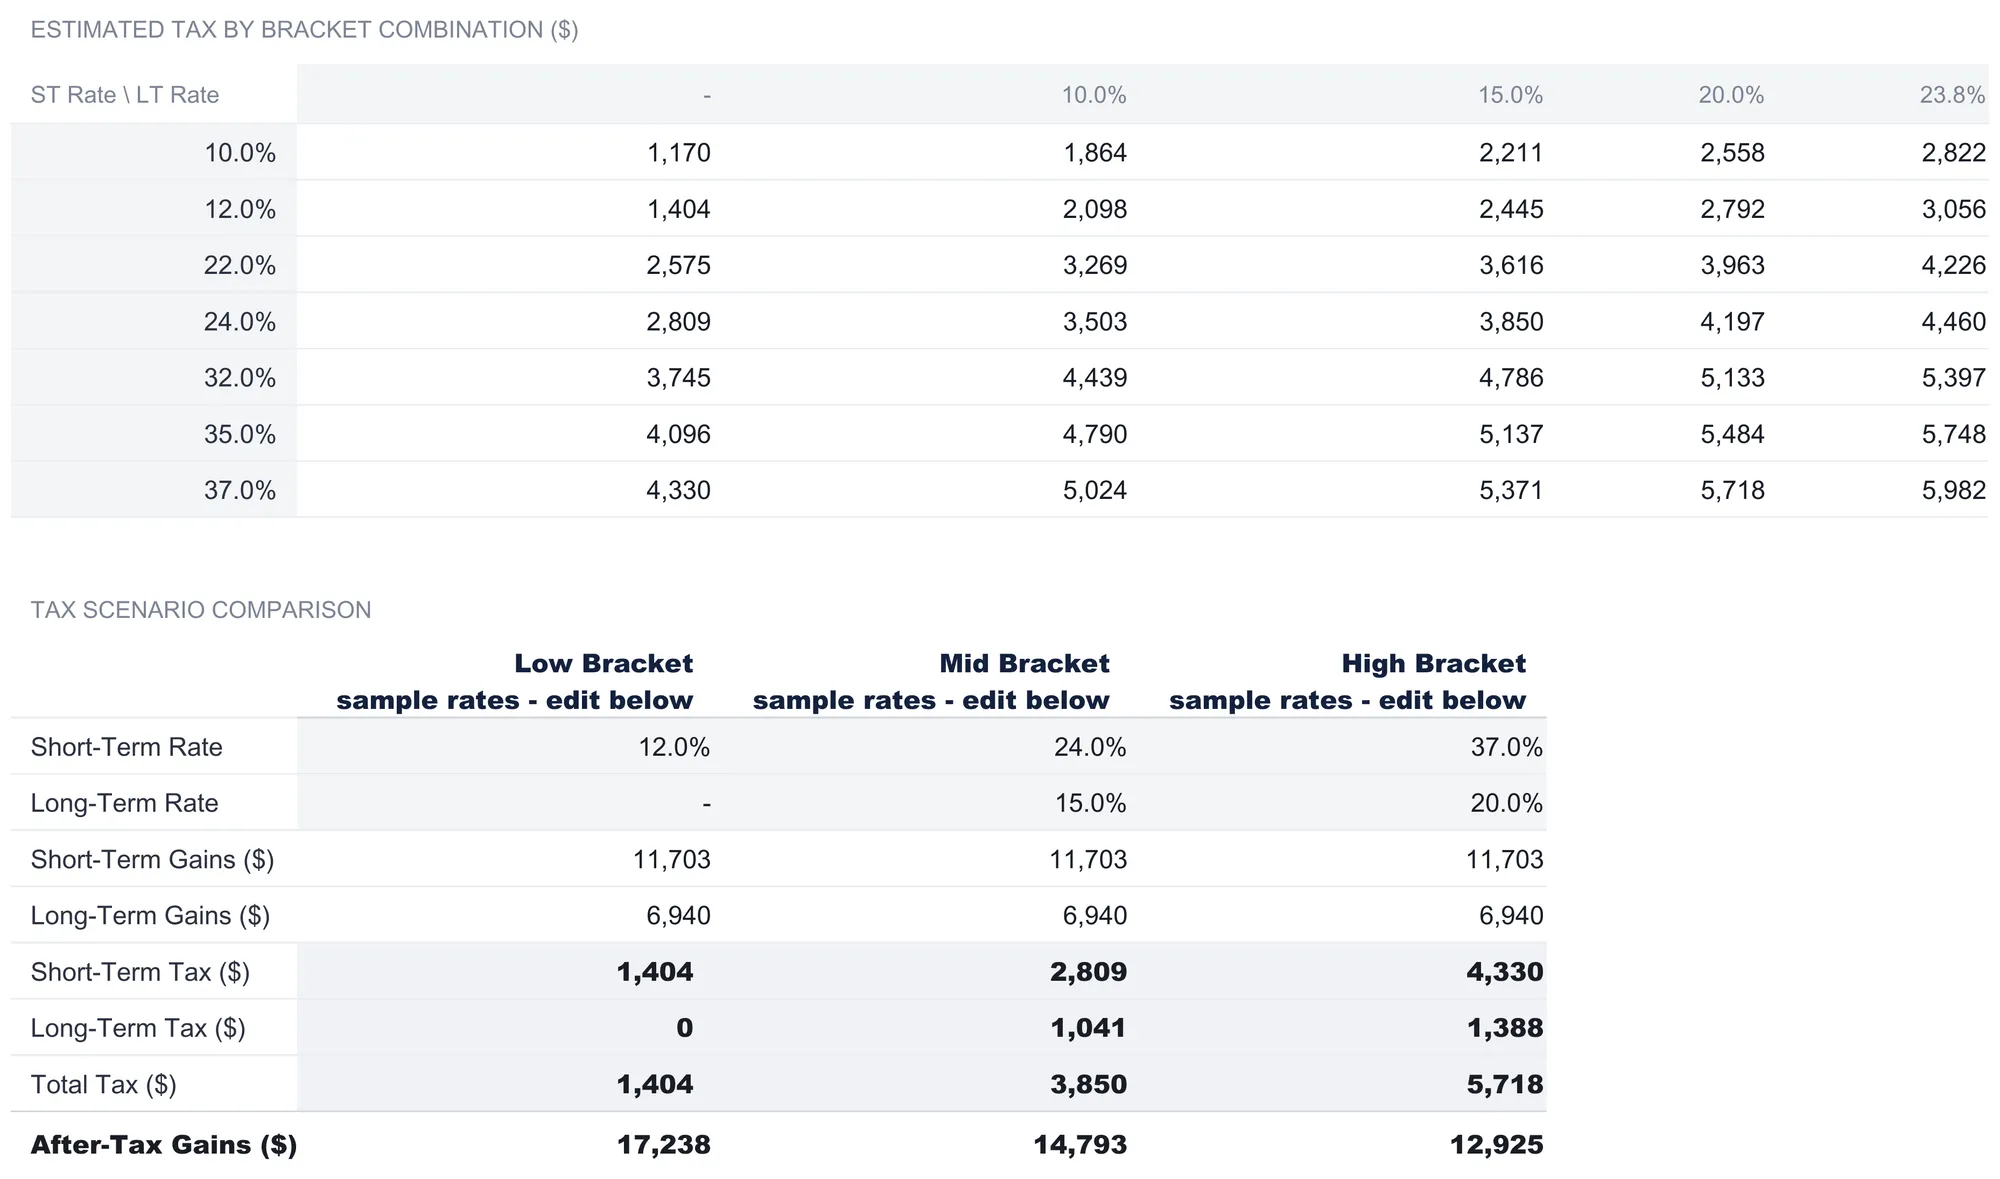
Both axes of the grid are editable, along with the six rate cells in the scenario comparison, so typing a rate that matches your situation over any of them recalculates that row, column, or scenario instantly. Everything below those rate cells is formulas reading the ledger. The How to Use sheet frames the intended use plainly: year-end planning, such as weighing whether to realize a gain this year or next when a bracket is expected to change. The sheet does not tell anyone which to choose; it lays the two costs side by side so the choice can be made with the numbers visible.
Flag the risky losses: the Wash Sale Tracker
Losses have a wrinkle that gains do not. The wash-sale rule can disallow a loss when the same security is bought back within a set window around the sale, and a disallowed loss cannot offset gains the way a clean one does. The Wash Sale Tracker is a helper that surfaces the losses worth checking, and it is careful to present itself as exactly that rather than as a verdict.
The sheet mirrors the Tax Lots ledger row for row. A lot that closed at a loss appears here; every profitable lot leaves its row blank. A single editable cell at the top sets the window, shipping at 30 days, meaning the check looks 30 days on each side of the sale date. For each loss it lays out the asset, the date sold, the loss amount, the window opening and closing dates, a count of Buys in Window, and a Wash Sale flag.
The sample has two losses, both TSLA. The first is the 20-share lot sold February 28, 2026 at a $250 loss. Its window opens January 29 and closes March 30, and the sheet counts one other TSLA purchase falling inside that span, the buy that opened the second TSLA lot on February 1. Because the count is above zero, the flag reads Possible. The second loss is the 15-share TSLA lot sold March 15, 2026 at a $225 loss, whose window runs February 13 to April 14. No qualifying TSLA purchase falls inside it, the count is zero, and the flag reads No.
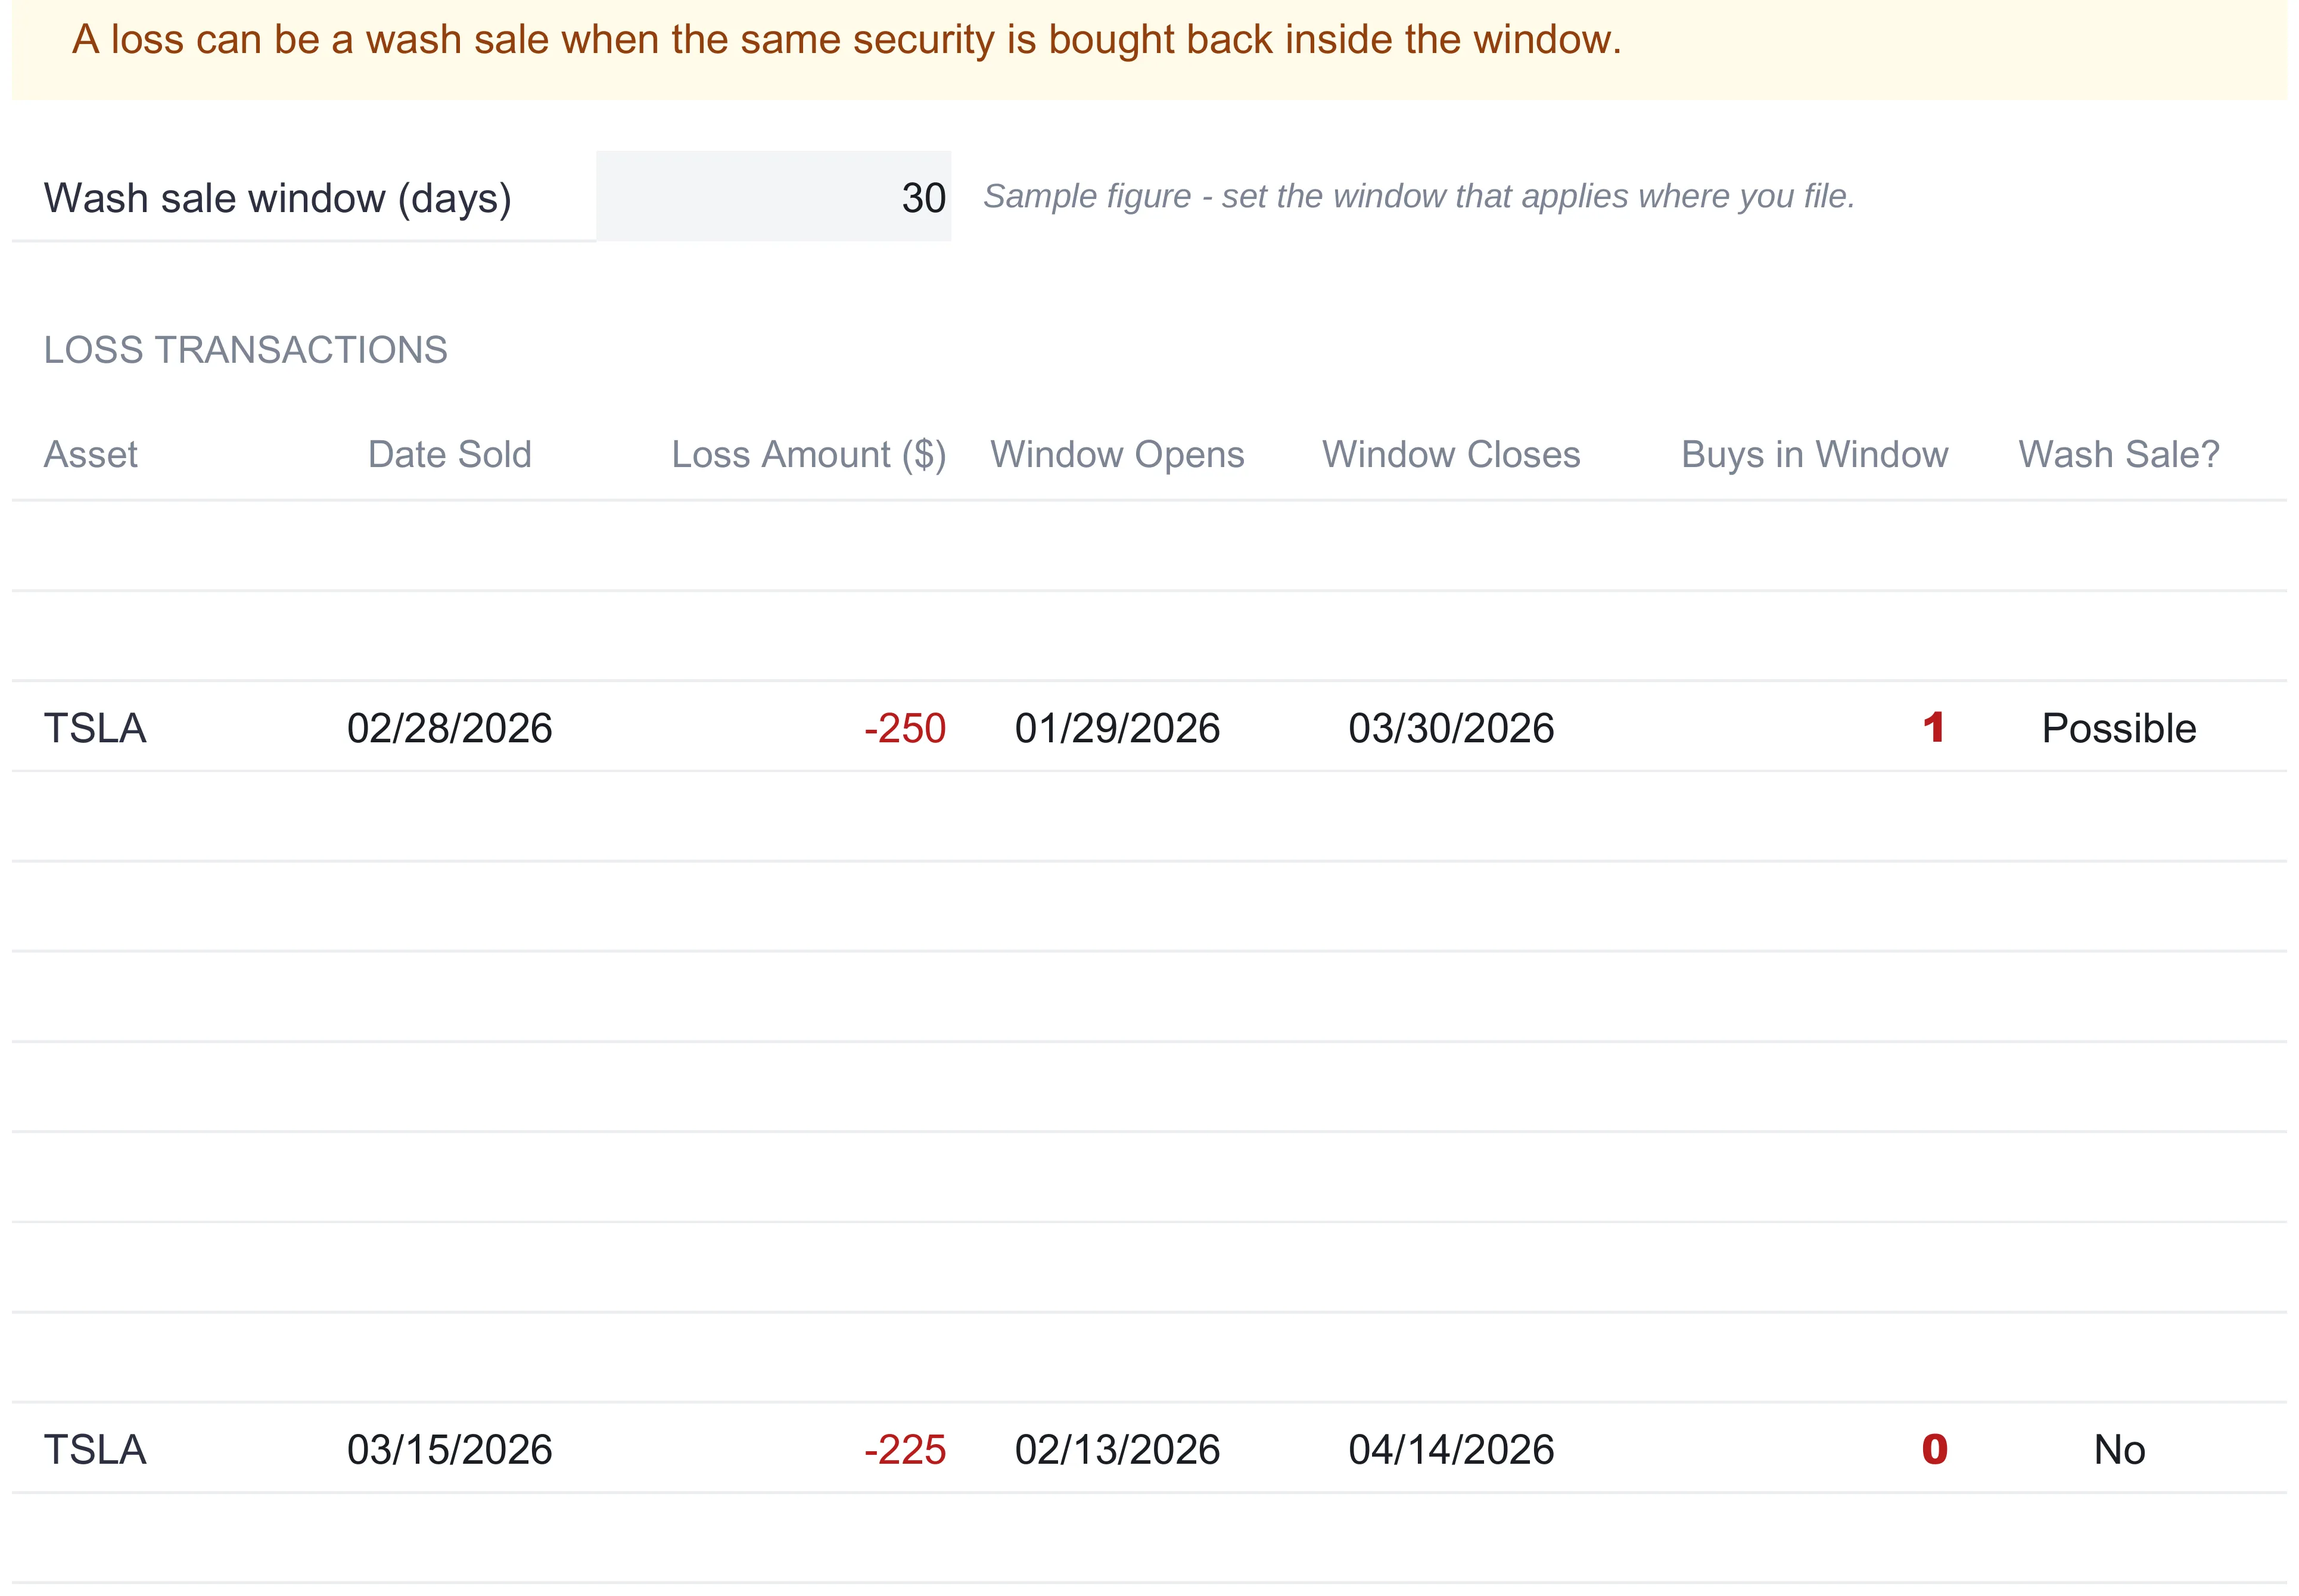
The Possible flag is a prompt, not a ruling, and the How to Use sheet is explicit that where a loss truly is a wash sale the disallowed amount is added to the cost basis of the replacement shares. The sheet cannot make that call, because the actual rule turns on securities being substantially identical, which can pull in options and other related instruments and is a judgment rather than a date comparison. What the tracker does well is narrow the field: instead of eyeballing a year of trades, you look only at the losses it flags and take those to a professional.
The dashboard: six numbers and two charts
With the ledger built and the rates set, the Dashboard reads it all back. Six KPI tiles sit across the top:
| Tile | Sample value | What it reads |
|---|---|---|
| Total realized gains | $18,643 | Every lot’s gain or loss, summed |
| Short-term | $11,703 | Gains on lots held 365 days or fewer |
| Long-term | $6,940 | Gains on lots held more than 365 days |
| Est. tax owed | $3,850 | Short-term tax plus long-term tax |
| Effective rate | 20.6% | Total tax divided by total gains |
| Transactions | 12 | Sales recorded this period |
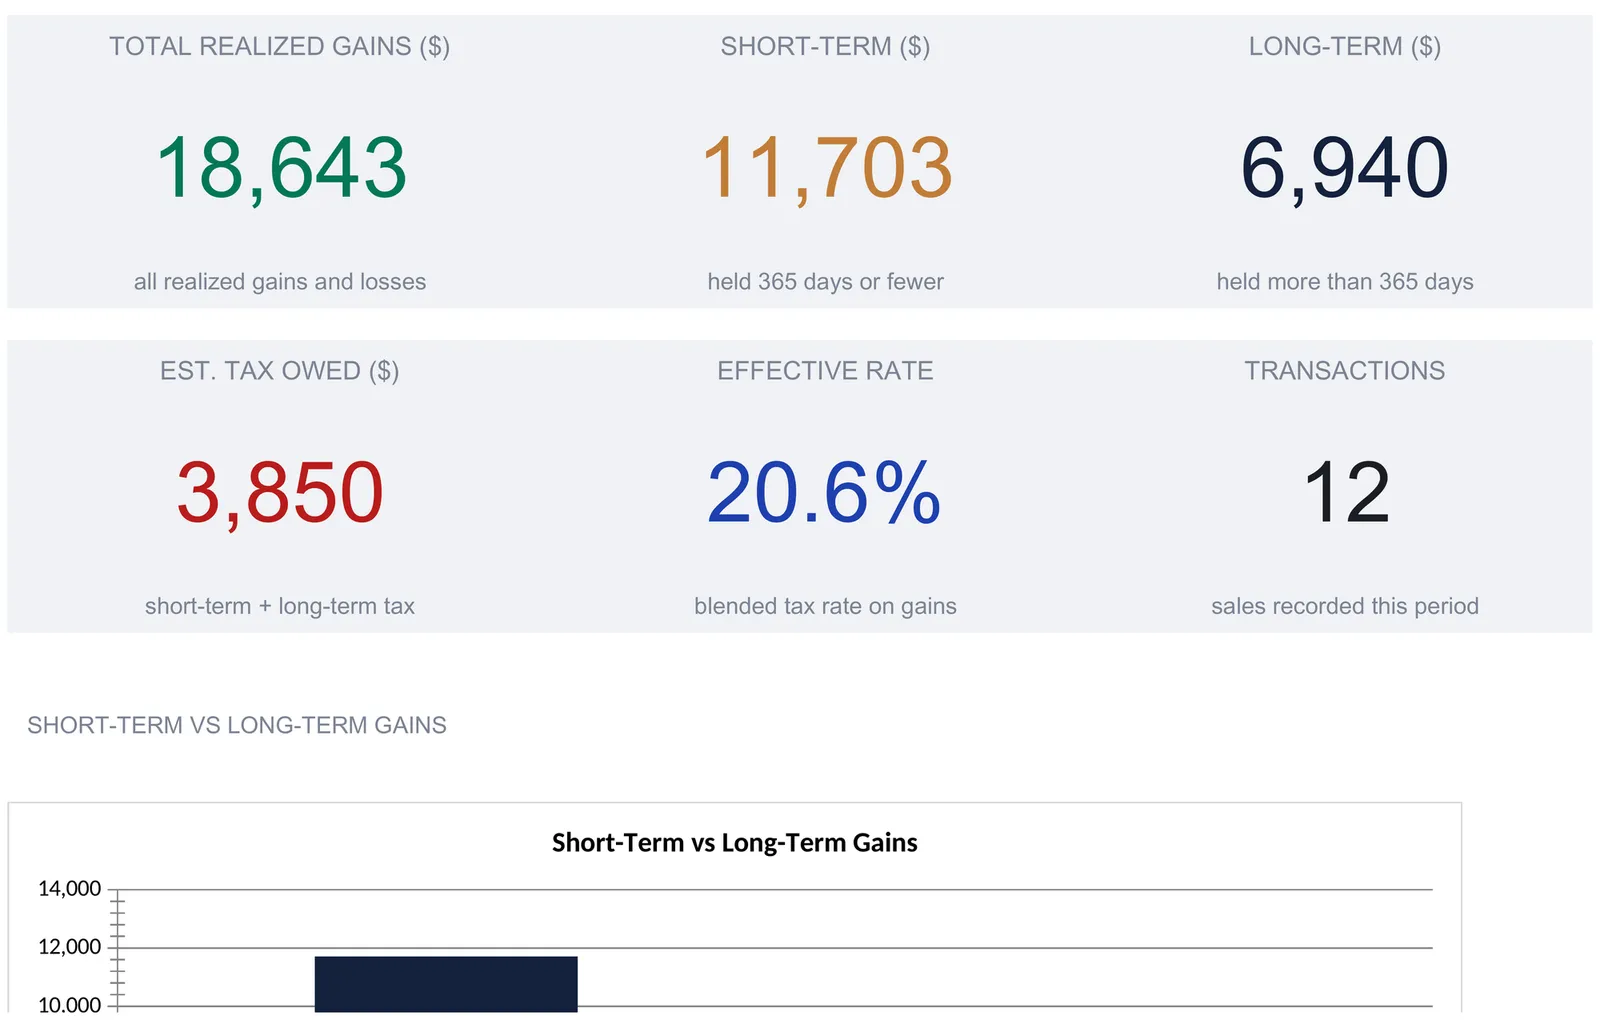
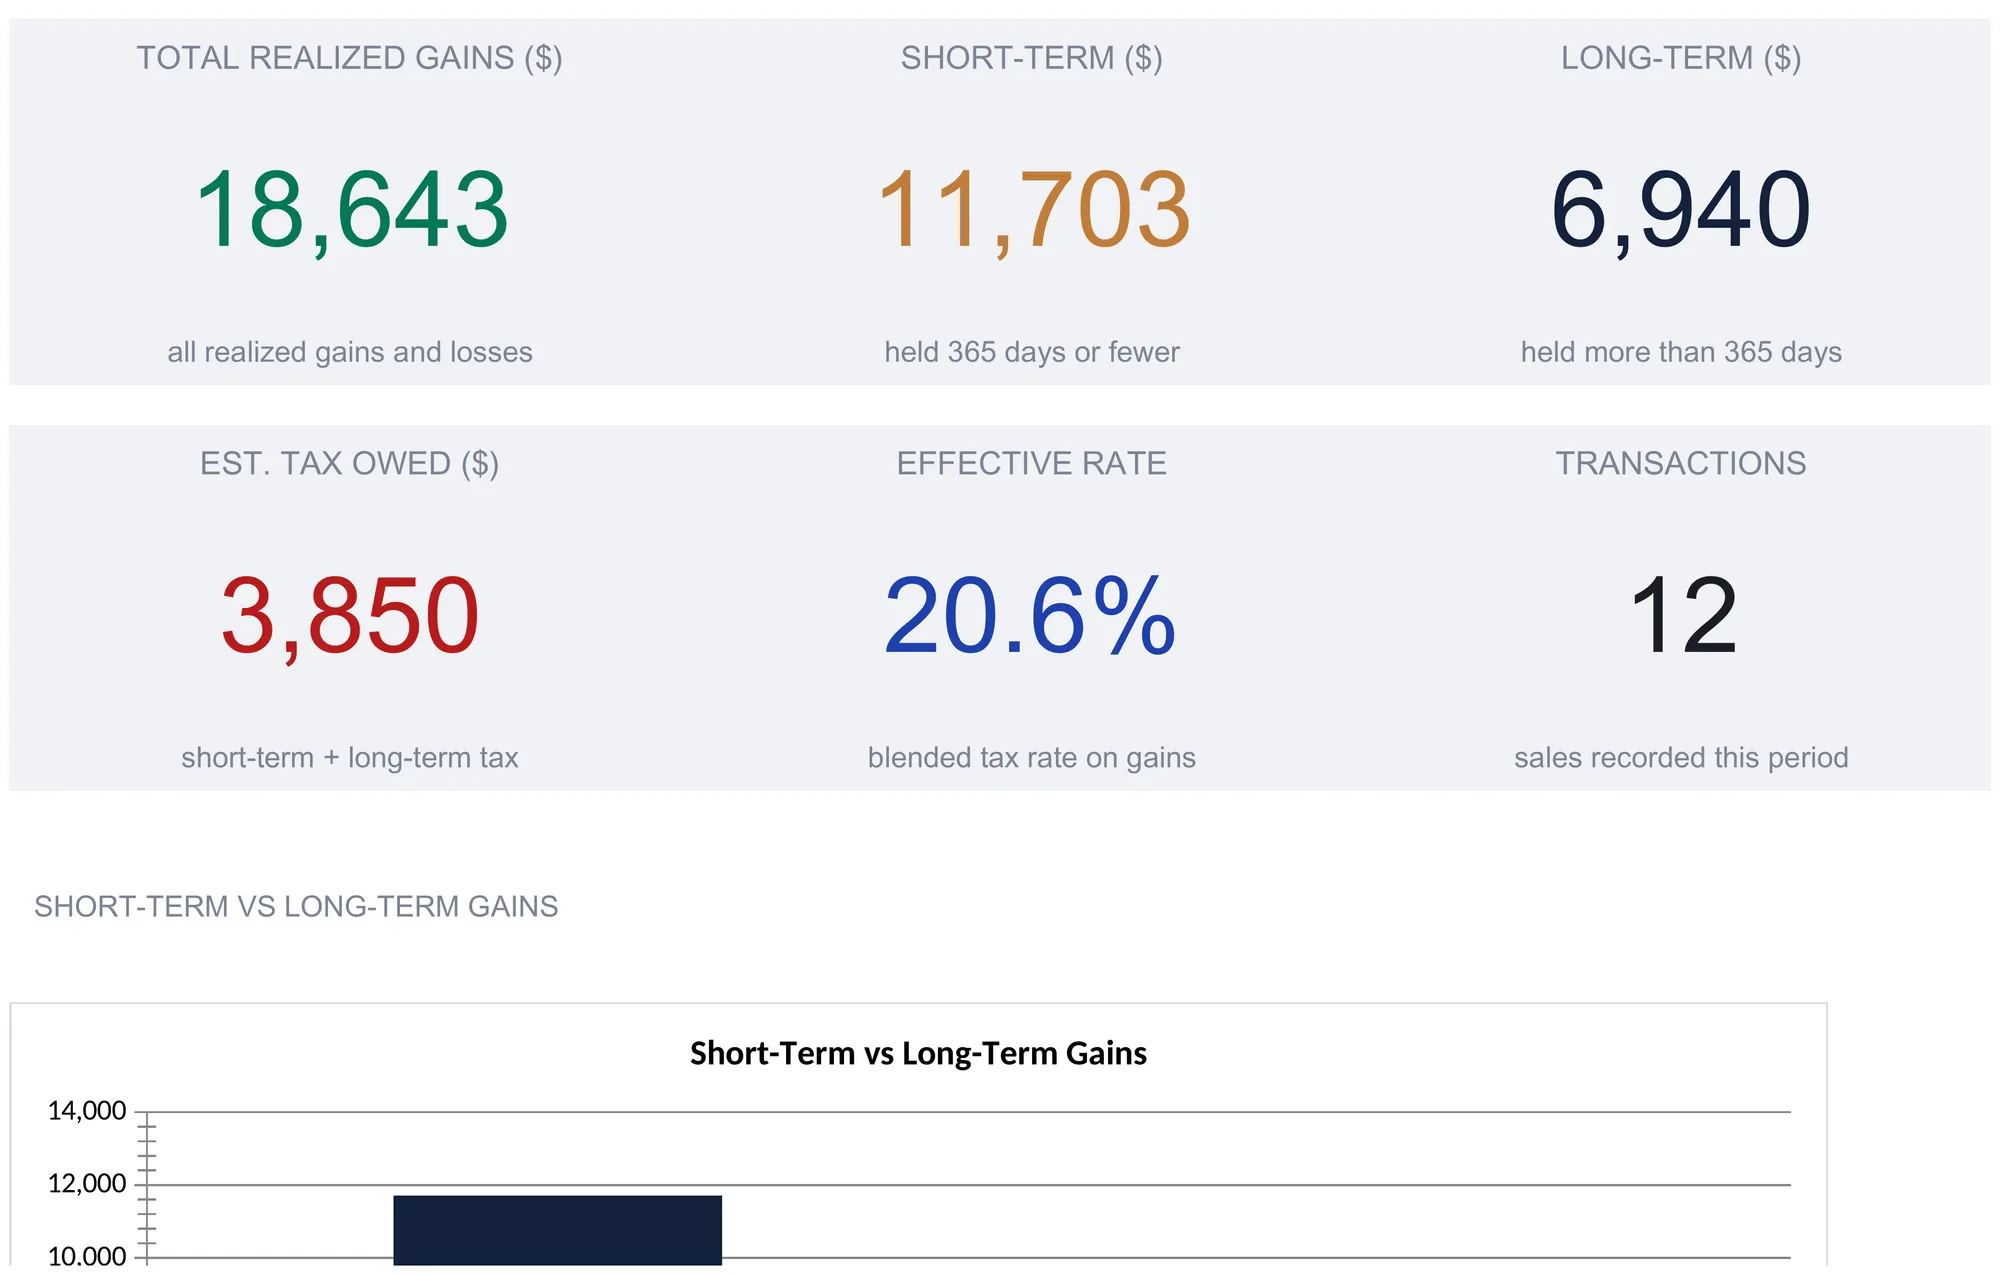
The money tiles round to whole units for display while the underlying figures keep their cents, which is why the total realized gains tile shows 18,643 against the ledger’s exact $18,642.50. Two of these repay a second look. The short-term and long-term tiles sit side by side precisely because the split between them is what drives the tax, and seeing $11,703 against $6,940 makes the mix visible at a glance: this sample is weighted toward the more heavily taxed short-term side, which is why its effective rate lands above the long-term rate. The Transactions tile counts filled rows in the ledger, so it climbs on its own as sales are added.
Below the tiles, a Short-Term vs Long-Term Gains column chart draws the same split as a picture, and an Estimated Tax Breakdown bar chart under it plots the short-term tax, the long-term tax, and the after-tax gains the Tax Summary produces. Both read from a small table at the foot of the sheet that restates those figures. The only cell anyone sets on the dashboard is the currency selector at the top; every number is a mirror of the sheets behind it, so a correction on the ledger flows straight through to the tiles and the charts.
Short-term, long-term, and effective rate in plain terms
Three ideas carry most of the confusion, and each is a short step from the numbers the ledger already holds.
Short-term means a lot held for the holding period or less, 365 days in the sample, and its gain is generally taxed at ordinary income rates. AAPL held 238 days is short-term.
Long-term means a lot held longer than that period, and its gain generally gets the lower long-term rates. NVDA held 723 days is long-term.
Effective rate is the single blended figure, total estimated tax divided by total realized gains, 20.6 percent here. It is not either headline rate; it is where they land once the short-term and long-term gains are weighted by size. That is why it is the honest one-number summary of a mixed year, and why moving a sale across the one-year line, which shifts gains from one block to the other, moves it.
Where the numbers go at tax time
For US investors, the figures this workbook produces line up with how realized gains are actually reported, without the template ever claiming to file anything. Brokers report sales on Form 1099-B, individual lots are detailed on Form 8949, and the totals roll up onto Schedule D. The IRS capital gains topic sets out the short-term versus long-term distinction the ledger automates, along with the rate treatment the Tax Summary approximates. Publication 550 covers the details the template deliberately leaves to others, including how losses offset gains, the treatment of net losses, and the wash-sale rule the tracker only flags. The rates and windows in the file are editable sample figures rather than the current official ones, and which apply to a specific person is a question for a tax professional. Arriving at that conversation with each sale already classified and totaled turns filing prep into a lookup rather than a reconstruction.
Excel or Google Sheets for capital gains
The template is an .xlsx file built on standard formulas, with no macros and no add-ons, so it behaves the same in Microsoft Excel and in Google Sheets after upload, and the How to Use sheet notes it works in LibreOffice Calc as well. Google Sheets suits someone who wants to open the same live file from a phone or a second machine; Excel suits someone who prefers a local file they control. The structure described here, a tax-lot ledger feeding a rate-driven summary, a sensitivity grid, and a wash-sale check, is equally buildable in either, and nothing in this walkthrough depends on a feature only one of them has. A currency dropdown next to the dashboard title relabels every money header and KPI label across the workbook, changing the symbol shown without converting the underlying numbers.
Which template fits the job
- Capital Gains Calculator Ultimate Spreadsheet Template ($29) is the workbook this walkthrough follows: the 50-lot ledger with automatic short-term and long-term classification, the rate-driven tax summary, the bracket sensitivity grid with its scenario comparison, the wash-sale tracker, and the six-KPI dashboard. It is the version built for a full year of realized sales across mixed holdings. The tier family starts smaller, with a free Capital Gains Calculator template that is a single sheet for computing a gain, and a Capital Gains Calculator Essentials ($19) that wraps a dashboard around the core tax-lots ledger. The Ultimate version is the one that carries the sensitivity analysis and the wash-sale detection.
- Stock Trading Journal Ultimate Spreadsheet Template ($29) sits one step upstream. Capital gains start from closed trades, and the journal is where those trades are logged as they happen, with a performance summary, monthly profit and loss, and strategy analysis across up to 200 trades. Its realized results are the raw material the capital gains ledger classifies and taxes at year-end.
Related
- Capital Gains Tax Calculator: What You Owe When You Sell Investments - the plain-English explainer on how short-term and long-term rates work, a good read before filling the ledger
- How to Keep a Stock Trading Journal in a Spreadsheet - the trade log whose closed positions become the realized lots here
- How to Track an Investment Portfolio in a Spreadsheet - the open-position view that sits alongside a record of sales
Frequently asked questions
How does the spreadsheet decide short-term versus long-term?
It counts the days between the buy date and the sell date and compares that to a holding-period cell above the ledger, which ships set to 365. A lot held that many days or fewer is tagged Short-Term; one held longer is tagged Long-Term. Because the threshold is a single editable cell, changing it re-classifies every lot at once, which matters since the line differs by country and can change between tax years. In the sample, AAPL held 238 days reads Short-Term while NVDA held 723 days reads Long-Term.
Are the tax rates in the template the correct ones for me?
No, they are sample figures you replace. The Tax Summary sheet carries an editable Short-Term Tax Rate, set to 24 percent in the sample, and an editable Long-Term Tax Rate, set to 15 percent, each with a note saying to set your own. Short-term gains are generally taxed as ordinary income while long-term gains use separate lower rates, and the actual figures depend on your total income, filing status, and jurisdiction. A tax professional can confirm the rates that belong on a real return.
What does the sensitivity grid show?
It prices the same realized gains against many rate combinations at once. A grid pairs seven short-term rates down the side with five long-term rates across the top, so every cell is the total tax at that pair, running from $1,170.25 in the sample at the lowest combination to nearly $5,982 at the highest. Below it, a scenario comparison prices the gains against three full rate pairs, a low, mid, and high bracket, showing total tax and after-tax gains side by side. It is built for year-end planning, such as comparing realizing a gain this year against next if a bracket is changing.
How does the wash-sale detection work, and is it a ruling?
It is a helper view, not a ruling. The Wash Sale Tracker mirrors the ledger row for row, shows only the lots that closed at a loss, and for each one counts other purchases of the same asset inside a window set by an editable cell, 30 days on each side in the sample. A count above zero flags the loss as a Possible wash sale, which is a prompt to check it rather than a finding that it is disallowed. The real rules turn on securities being substantially identical, which the count cannot judge, so the sheet points you at the lots worth reviewing with a professional.
Does the template file my taxes or track cost basis lot by lot as I buy?
No. It is a calculator for sales you have already made: you type each realized lot's cost basis and proceeds, and it classifies, totals, and estimates tax from your rates. It does not connect to a broker, import trades, track open positions, or generate any tax form. Brokers issue a Form 1099-B and the IRS Schedule D and Form 8949 are where realized gains are actually reported, and arriving there with sales already classified and totaled turns filing prep into a copy job.
Sources
- Topic no. 409, Capital gains and losses - Internal Revenue Service
- About Schedule D (Form 1040), Capital Gains and Losses - Internal Revenue Service
- Publication 550, Investment Income and Expenses - Internal Revenue Service
About this article
Sheets, typed inputs, formulas, number formats, charts and every quoted figure checked on 2026-09-10 against the published Capital Gains Calculator Ultimate workbook (Dashboard, Tax Lots, Tax Summary, Sensitivity, Wash Sale Tracker, How to Use), the exact file customers download. Screenshots re-read on 2026-09-10 and captions matched to what each crop shows. Tier differences checked on 2026-09-10 against the published free and Essentials Capital Gains Calculator workbooks, and the Stock Trading Journal Ultimate workbook. IRS capital gains topic, Schedule D, and Publication 550 references checked against the live IRS pages on 2026-09-10. Last reviewed September 2026.