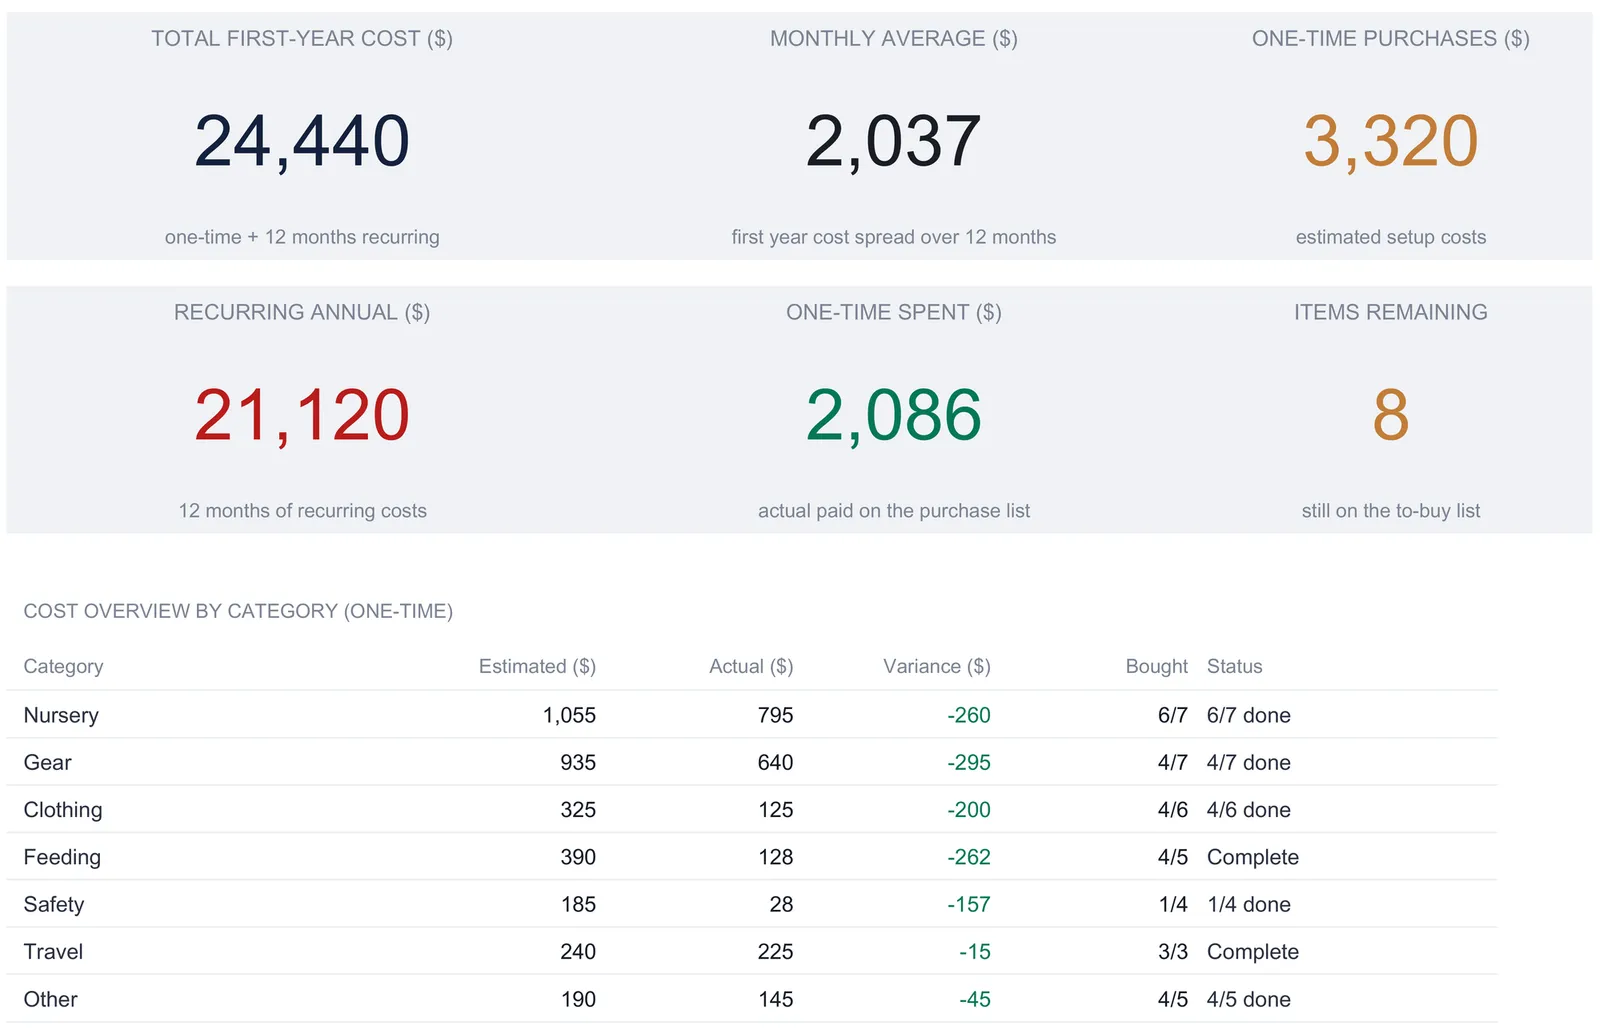
A baby budget spreadsheet splits the cost of a first year into two different halves, a one-time setup list of gear and nursery items, and the monthly recurring costs that run for twelve months, then reads a dashboard back over both. This walkthrough follows the full structure with a worked example, a first-year total of $24,440 built from $3,320 of estimated setup and $21,120 of recurring costs, with childcare alone at 71 percent of the monthly outflow. Our Baby Budget Planner Ultimate Spreadsheet Template ($29) ships the same structure ready-made for Excel and Google Sheets.
The cost of a first year with a baby is two costs wearing one label. There is the setup, the crib and the stroller and the car seat, bought once before or just after the baby arrives. Then there is the running cost, the diapers and formula and childcare that arrive every month for twelve months and do not stop when the year ends. Most expectant parents can name a rough total they have heard, something in the tens of thousands. Far fewer can say how much of that is a one-time outlay to plan around a due date, and how much is a monthly bill to fit into a household budget. Those two halves are saved for differently, spent differently, and worry people for different reasons, and a single number hides the distinction that matters most.
A spreadsheet built for the job keeps them apart. That structure is a set of sheets that hand off in order: a one-time purchase list, a monthly recurring cost sheet, a month-by-month timeline of what actually gets spent, a registry tracker, a budget-versus-actual view, and a dashboard that reads the two cost sheets back into a summary. The examples below come from our Baby Budget Planner Ultimate Spreadsheet Template ($29), which ships the whole thing ready-made for Excel and Google Sheets. Everything it does is reproducible by hand if you would rather build your own baby budget spreadsheet from scratch.
What a baby budget spreadsheet has to hold, and what a single estimate leaves out
A general first-year estimate is a useful starting point, and for someone at the very beginning it is the right size. What it cannot do is track the year as it happens, because it never separates the two kinds of spending underneath the total. This workbook is built around that separation, and it carries four things a single number does not.
- The one-time and the recurring, split apart. Setup costs and monthly costs live on their own sheets. In the sample that is $3,320 of estimated one-time purchases against $21,120 of recurring cost across twelve months, two figures that add to the $24,440 first-year total but are planned for in completely different ways.
- Estimated against actual, on both halves. The purchase list carries an Actual Cost column beside every estimate, and a first-year timeline logs real spending month by month. Neither half stays a plan once the year starts.
- A registry, valued. A dedicated sheet tracks what has been asked for, what has arrived as a gift, and what is still yours to buy, and it puts a dollar figure on the gifts received.
- A year, read back two ways. A budget-versus-actual sheet compares planned to logged for every category and tracks a handful of savings goals, and a dashboard turns the purchase list and the recurring plan into six numbers and two charts.
The walkthrough below follows the sheets in the order the work happens, starting with the purchase list most parents fill in first and a How to Use sheet that carries the instructions.
Build the setup list: the One-Time Purchases sheet
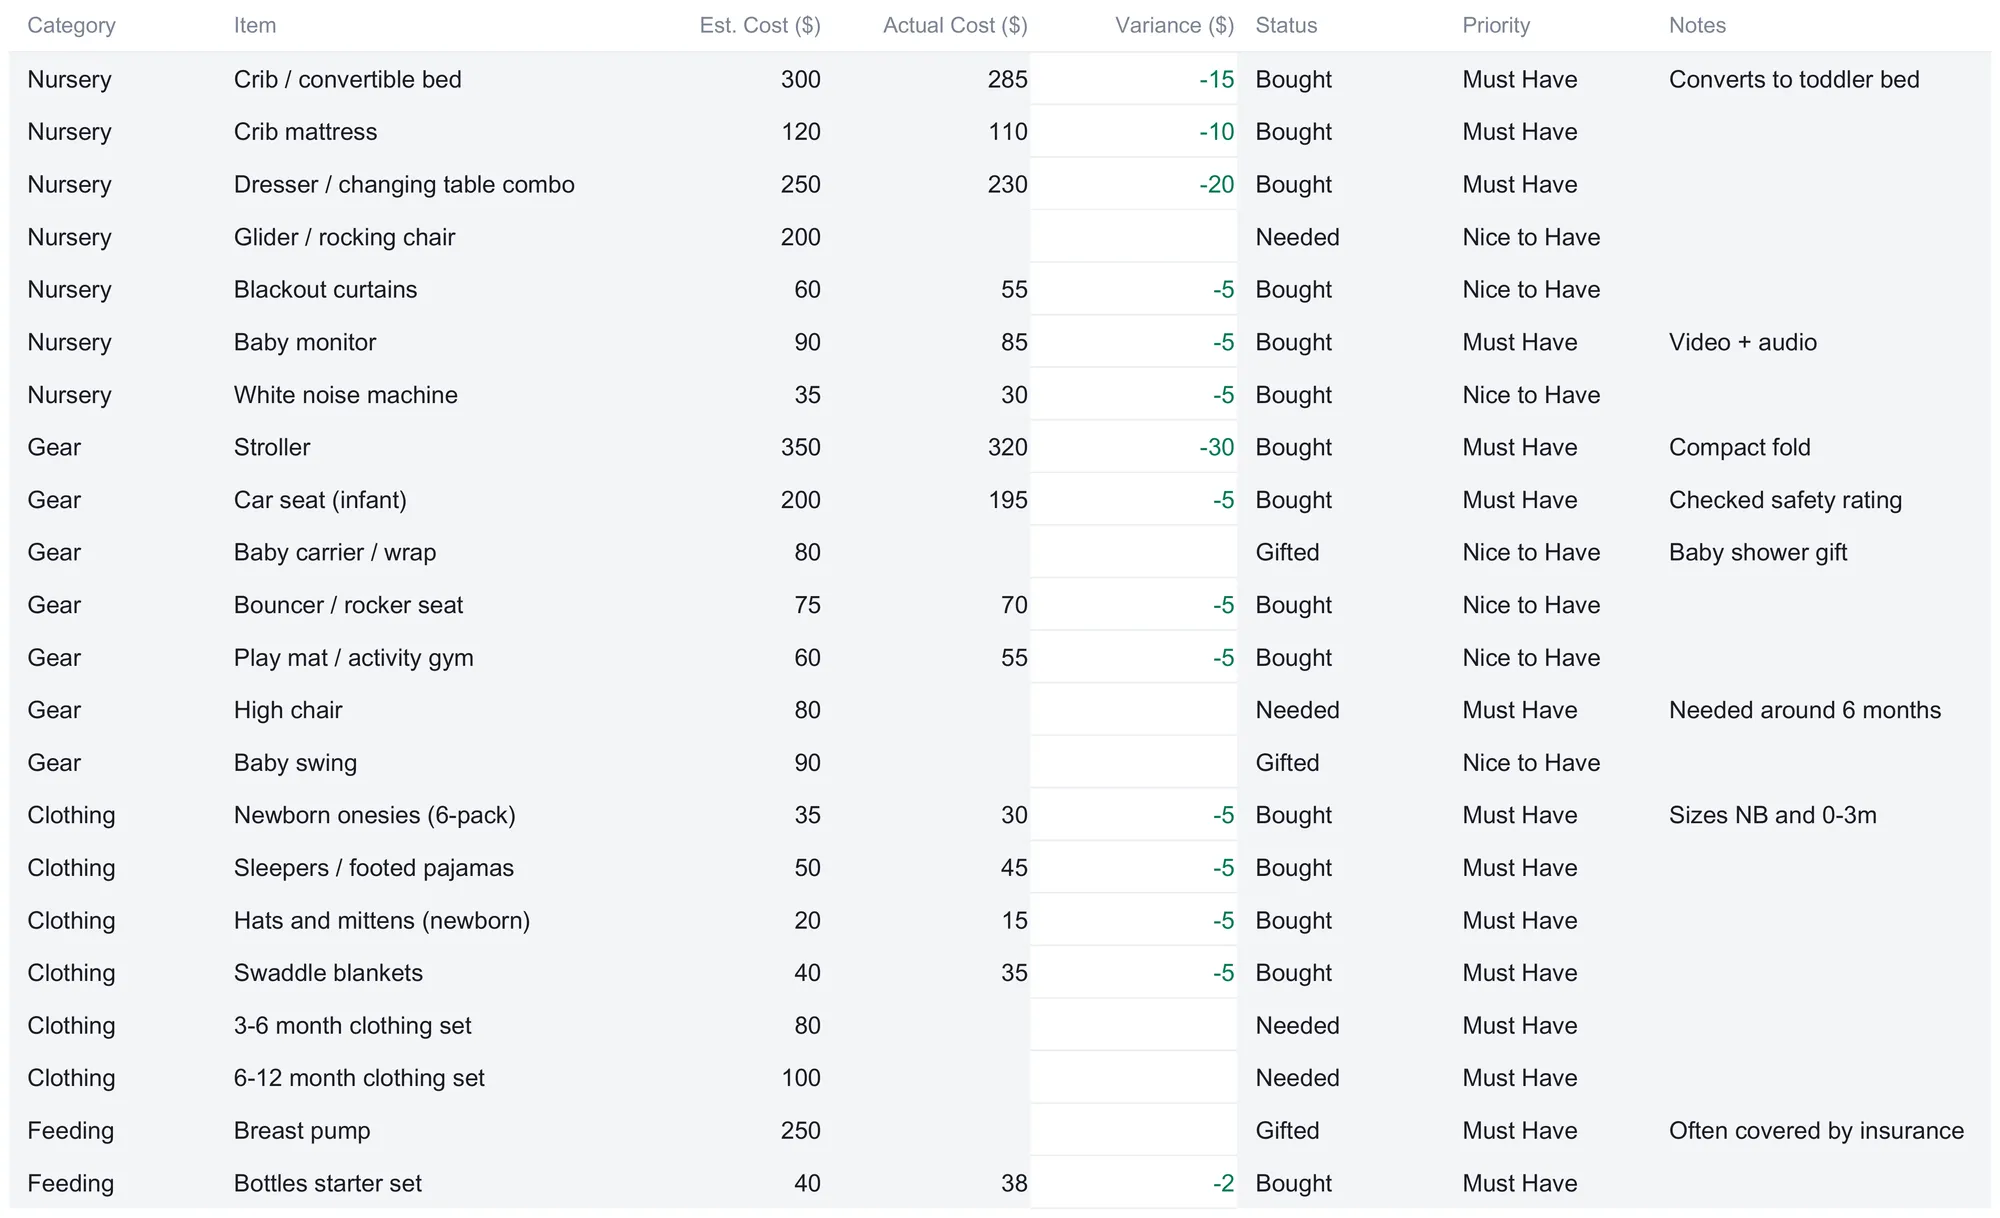
The one-time list is where most people start, because it is the part of a baby budget that looks like a shopping list. The sheet ships pre-filled with about 37 common items across seven categories, Nursery, Gear, Clothing, Feeding, Safety, Travel, and Other, and it holds up to 40 rows so there is room to add your own. Each row carries eight columns: the category, the item, an estimated cost, an actual cost, a variance, a status, a priority, and a notes field.
Two of those columns do the real work. The Status column is a dropdown with four settings, Needed, Bought, Gifted, and Skipped, and it decides whether a row counts. Marking a row Skipped drops it out of every total on the sheet, so ruling out an item you have decided you do not want lowers the budget straight away rather than leaving a number you have to remember to ignore. The Priority column is a second dropdown, Must Have or Nice to Have, and a block at the bottom splits the estimated and actual cost between the two, so the essentials and the extras can be read apart.
The Variance column is Actual minus Estimated, shown in green when a purchase came in under its estimate and red when it went over. A row from the sample makes the flow concrete: a crib and convertible bed estimated at $300 came in at $285, a variance of negative $15 in green. A stroller estimated at $350 came in at $320. A car seat estimated at $200 came in at $195. Not every row is bought yet, and the status tags show it: a breast pump estimated at $250 sits as Gifted with a note that it is often covered by insurance, a baby carrier and a baby swing are both Gifted, and a high chair is still marked Needed.
Run the whole list and the totals read $3,320 estimated against $2,086 actually paid, a variance of negative $1,234 that mostly reflects the items still to buy rather than a run of bargains. Underneath, a by-category block rebuilds the total seven ways, and the grand-total row counts the statuses: 26 items bought, 3 gifted, and 8 still needed. A by-priority block splits the same list again, $2,275 of estimated Must Have cost across 21 items with 6 still needed, and $1,045 of Nice to Have across 16 items with 2 still needed. That split answers the question every setup list eventually raises, which is what is left that genuinely has to be bought versus what can wait.
Set the monthly bill: the Monthly Recurring sheet
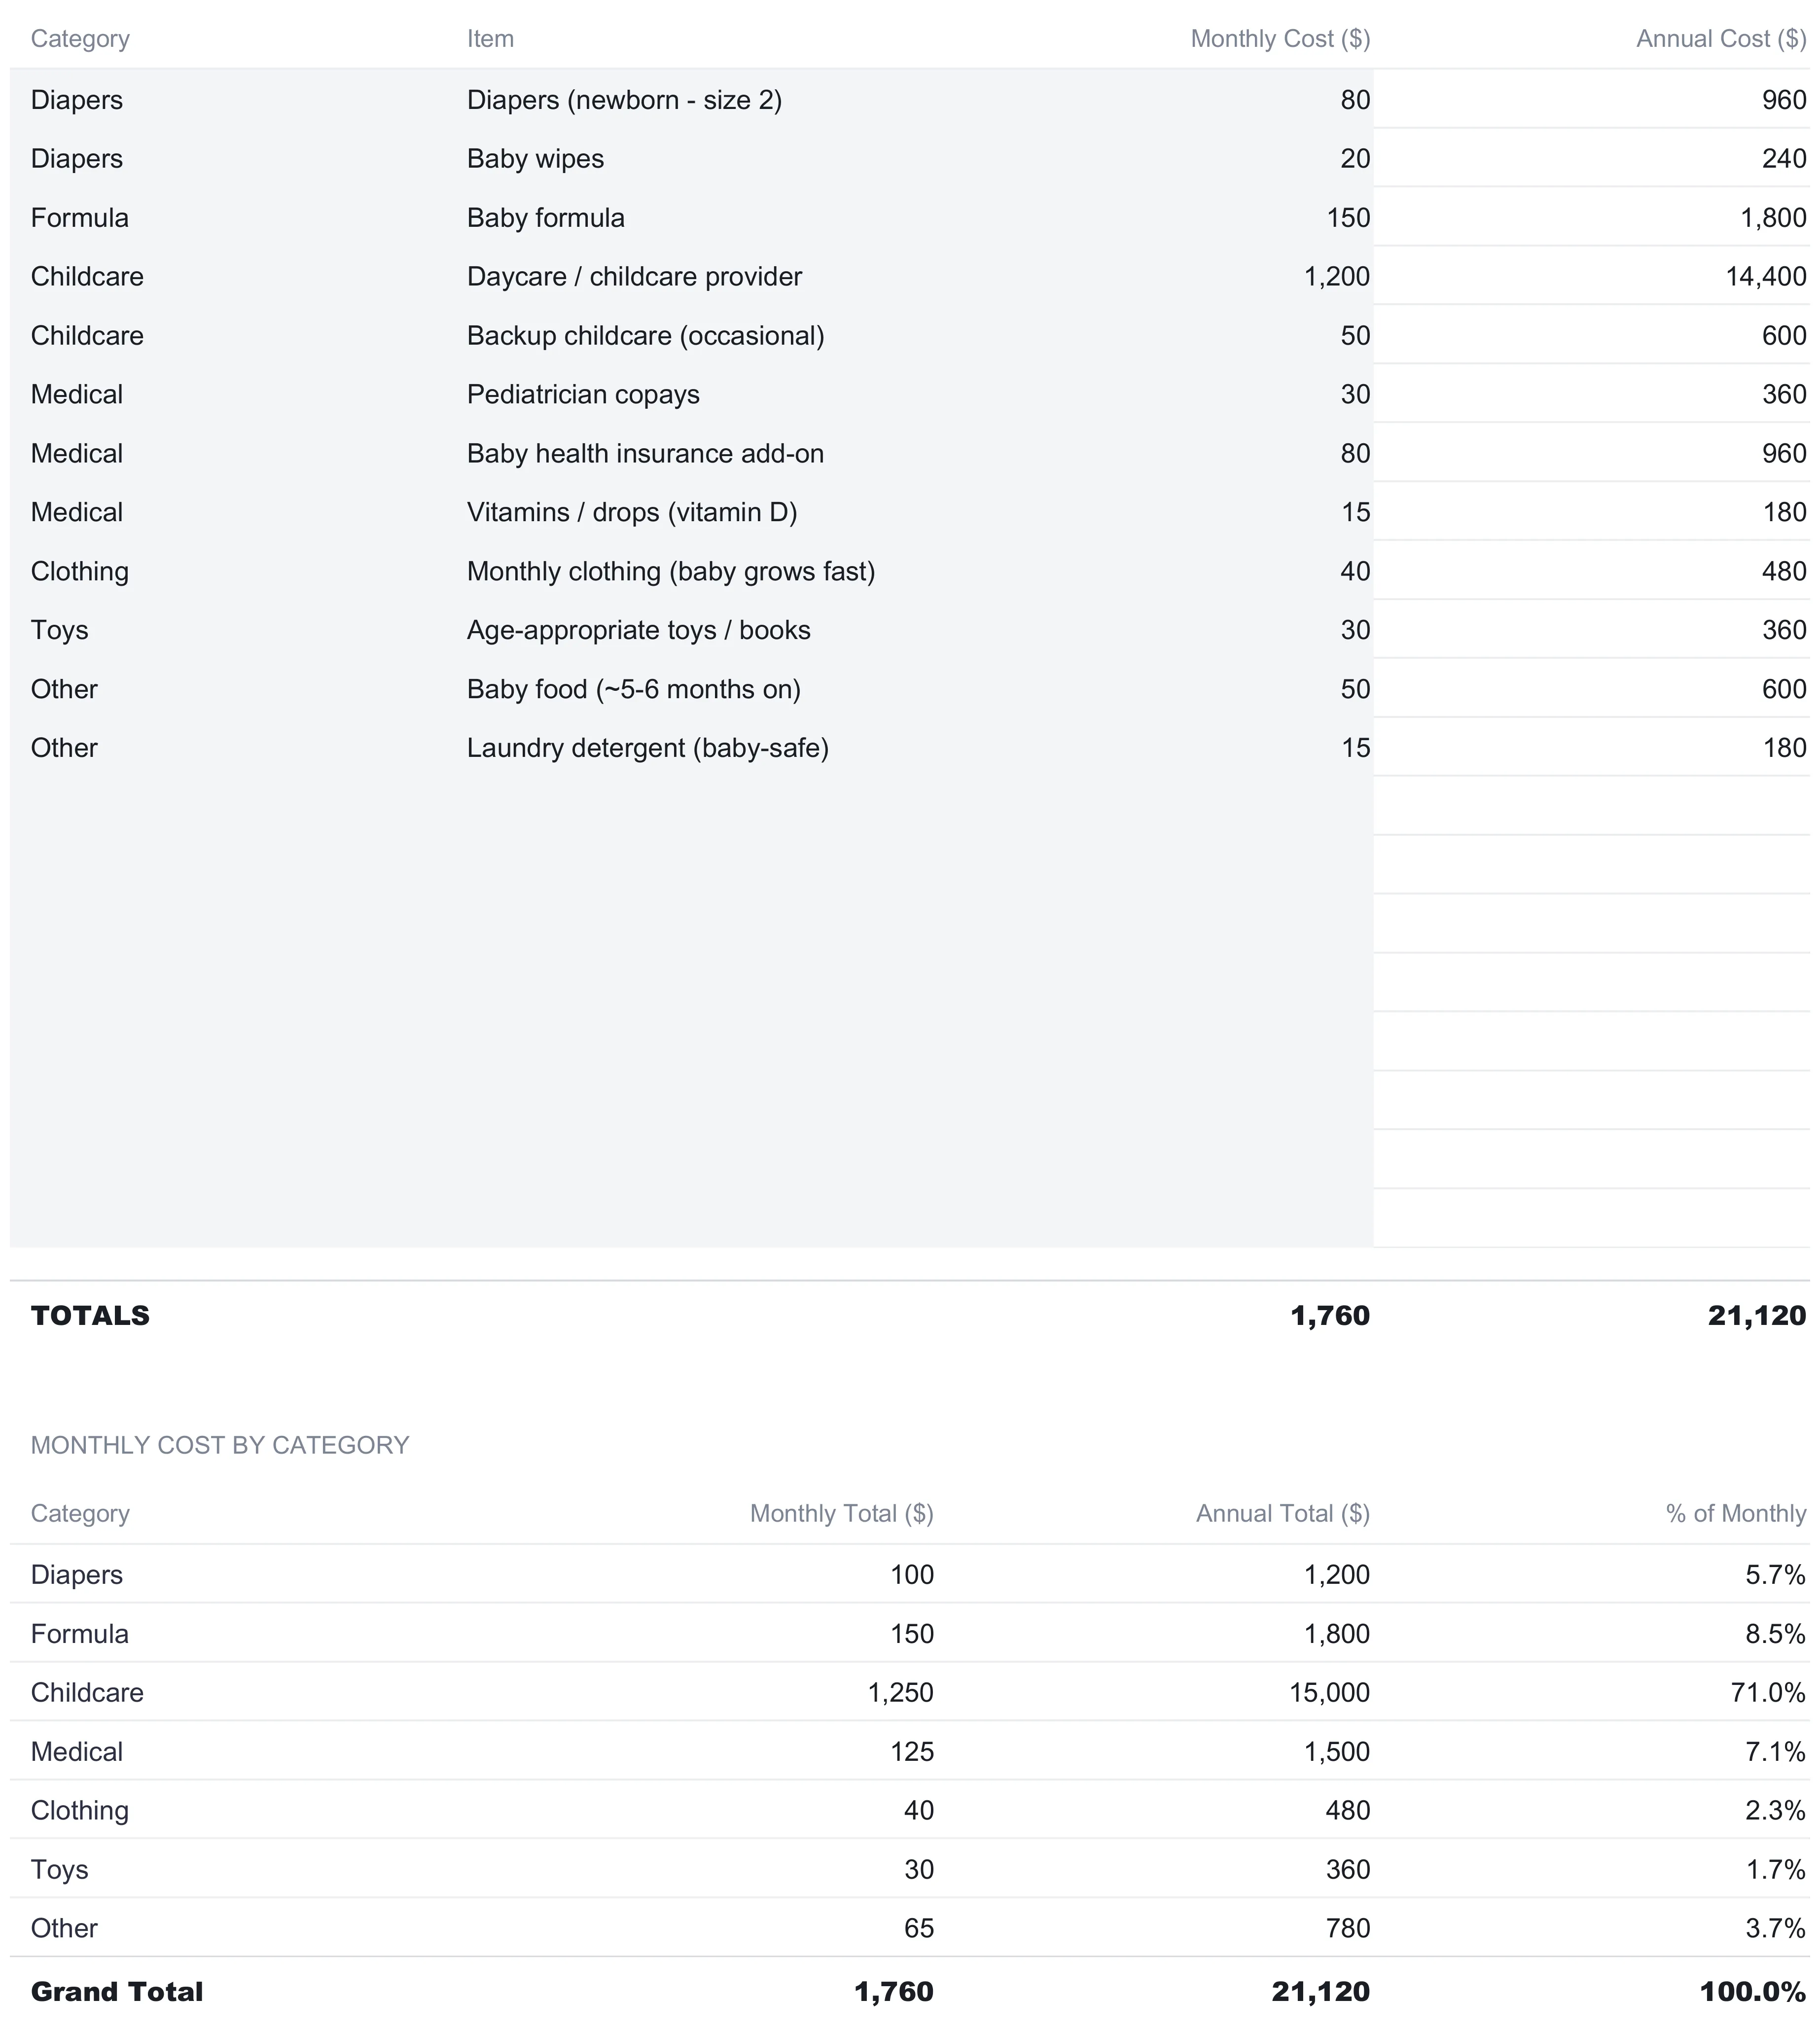
The setup list is a one-off. The Monthly Recurring sheet is the other half of the picture, the costs that arrive every month and keep arriving after the first year closes. It is a shorter sheet, twelve pre-filled items in twenty rows, with four columns: the category, the item, a monthly cost, and an annual cost that computes automatically as the monthly figure times twelve.
The categories are the ones that recur: Diapers, Formula, Childcare, Medical, Clothing, Toys, and Other. In the sample, diapers and wipes run $100 a month, formula $150, pediatrician copays and a health-insurance add-on and vitamins total $125 under Medical, and smaller lines cover monthly clothing as the baby grows, toys and books, baby food from around five or six months on, and baby-safe laundry detergent. The monthly total is $1,760, which the sheet annualizes to $21,120.
One line dominates everything else. Childcare sits on its own, and it is $1,250 a month, a daycare provider at $1,200 plus $50 of occasional backup care. That single category is 71 percent of the monthly outflow, more than diapers, formula, medical, clothing, toys, and other combined. The template puts childcare on its own row rather than folding it into a group precisely because it is the number most likely to decide the total, and a by-category block at the bottom of the sheet makes the imbalance plain: diapers are 5.7 percent of the monthly cost, formula 8.5 percent, medical 7.1 percent, and childcare 71.0 percent. For a family without paid childcare that one line falls away and the monthly figure changes shape entirely, which is exactly why it is the easiest cell in the workbook to find and edit.
Log the year as it happens: the First Year Timeline sheet
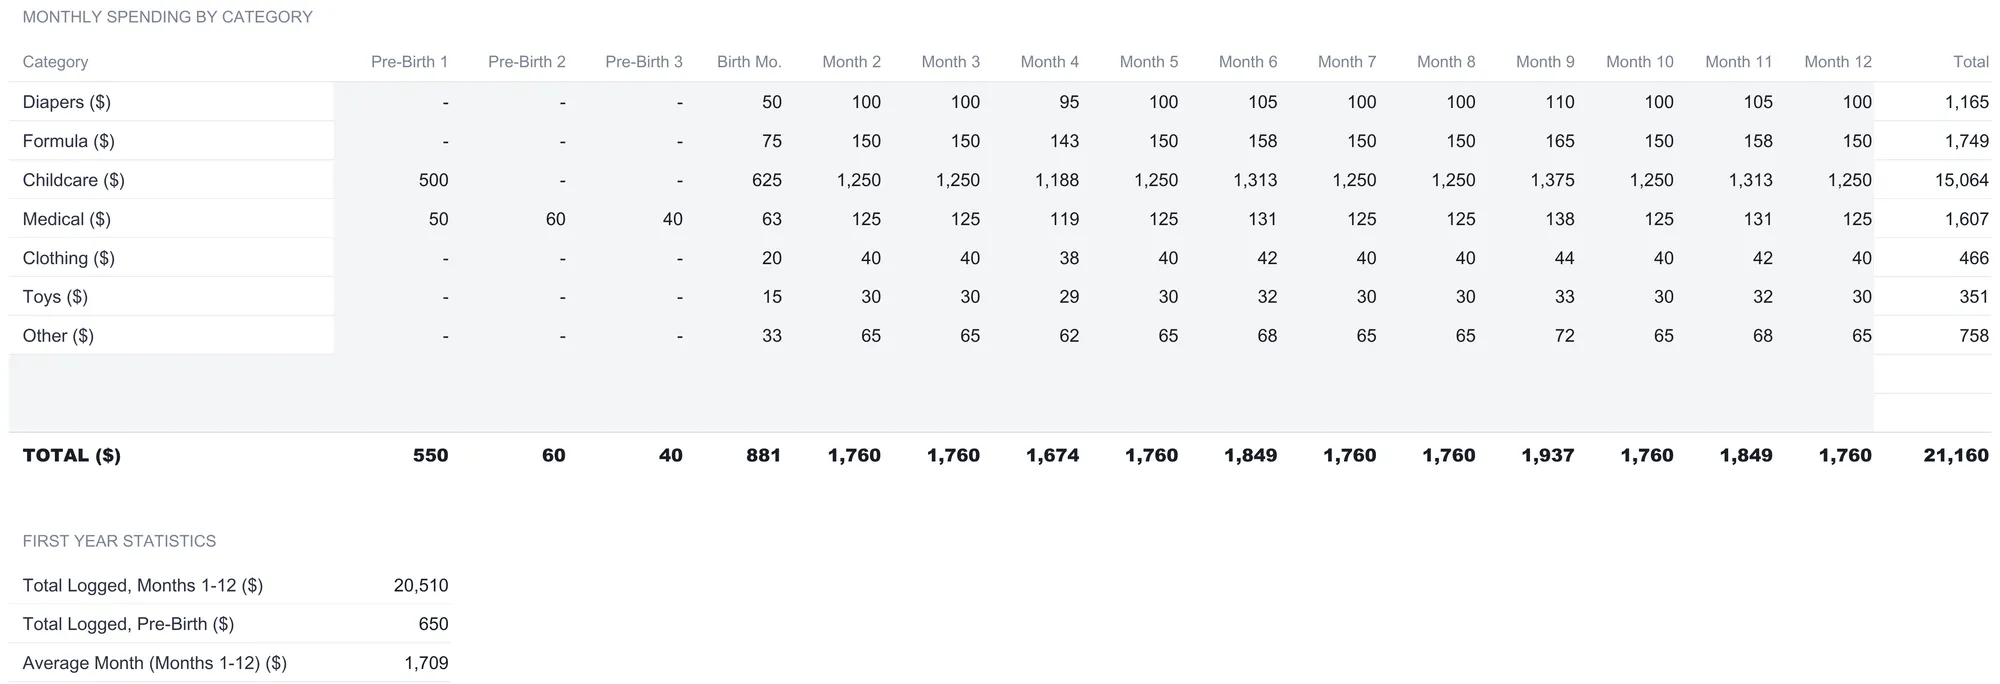
The two sheets so far hold the plan. The First Year Timeline is where the plan meets reality, month by month. It is a grid of seven category rows, the same recurring categories, laid across sixteen columns: three pre-birth months, the birth month, and then Month 2 through Month 12, with a total column on the end. Two spare rows sit inside every column total, ready for a category of your own.
The pre-birth columns matter more than they look. A baby costs money before it arrives, and the timeline has somewhere to put that: the sample shows a $500 childcare deposit in the first pre-birth month and prenatal medical copays across all three, while diapers, formula, and the rest stay at zero because there is no baby to spend them on yet. The birth month then shows about half a month of recurring cost as things ramp up, and Months 2 through 12 settle into the full ongoing rate, most of them landing near $1,760 with small month-to-month wobble.
Because the sheet logs real spending rather than a flat rate, the category totals for the year differ slightly from the tidy recurring plan. Childcare logs $15,064 across the year against the $15,000 the plan implies, formula $1,749 against $1,800, medical $1,607 against $1,500. Those small gaps are the reality the timeline is built to capture. A statistics block at the bottom is careful about the arithmetic that trips people up. It reports $20,510 logged across the twelve baby months and $650 logged across the three pre-birth months separately, then an average month of $1,709, which is the twelve-month figure divided by twelve. Keeping the pre-birth spending out of that average is the difference between an honest monthly cost and one dragged down by three quiet months before the baby came.
Track the gifts: the Registry Tracker sheet
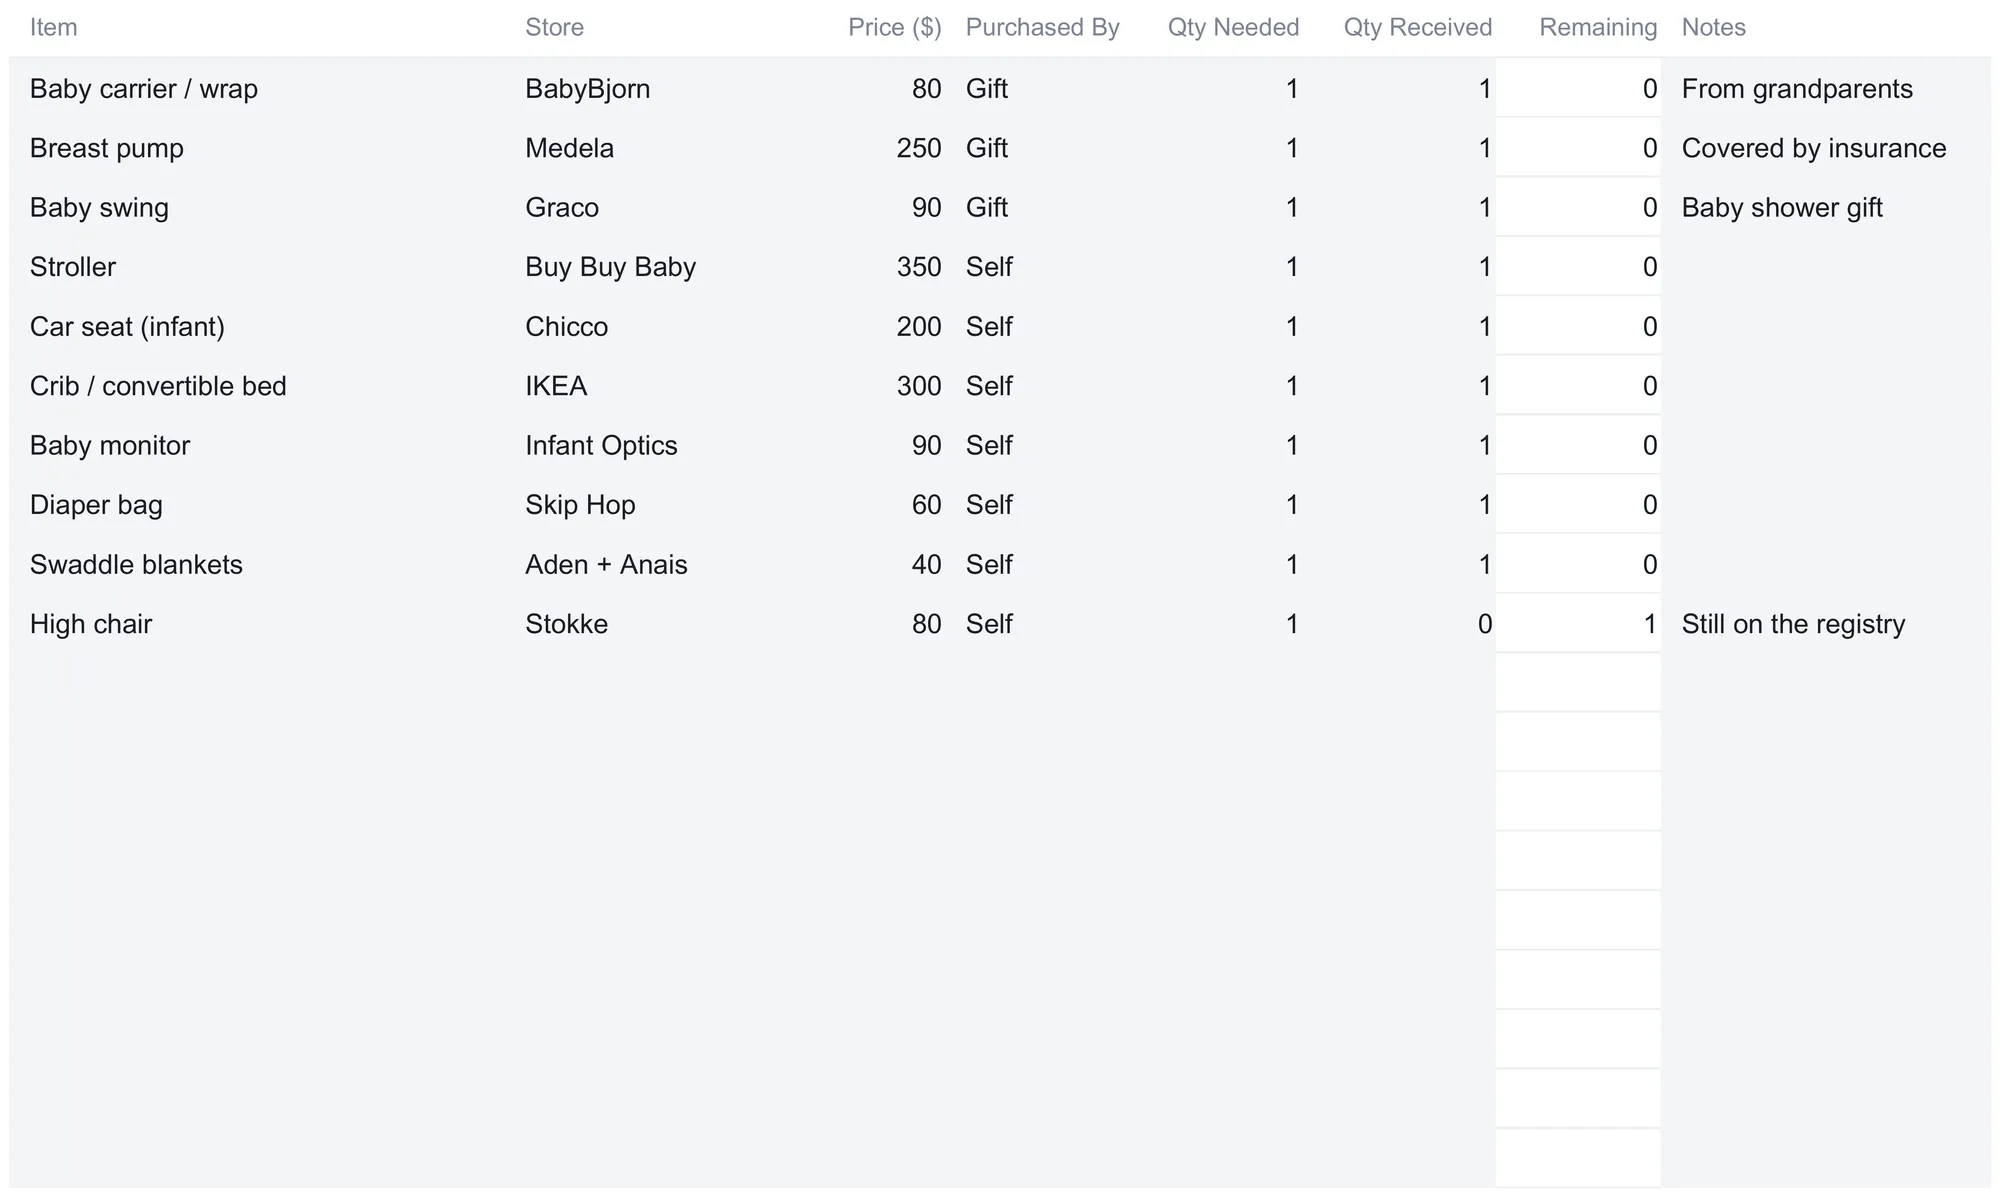
A baby registry changes the math, because a share of the setup list arrives as gifts rather than purchases, and the workbook gives that its own sheet. The Registry Tracker holds up to 30 items, each with a store, a price, a note of who is covering it, a quantity needed, a quantity received, and a remaining count that computes as needed minus received, never dropping below zero.
The Purchased By column is the pivot. Setting a row to Gift marks it as something coming from someone else, and Self marks something you are buying yourself. In the sample, a baby carrier from BabyBjorn, a Medela breast pump, and a Graco swing are all Gifts that have arrived, while a Buy Buy Baby stroller, a Chicco car seat, an IKEA crib, and several others are Self purchases already received. A Stokke high chair is the one item still on the registry, needed but not yet received. The totals count it plainly: 10 items needed, 9 received, 1 remaining.
Below the list, a Gift Value Summary turns the tracker into two dollar figures. The Total Value of Gifts Received is $420, the summed price of every arrived Gift, the carrier at $80, the breast pump at $250, and the swing at $90. The Self-Purchase Remaining figure is $80, the value of what is still yours to buy, the high chair that has not arrived. Those two numbers answer a question the setup list alone cannot, which is how much of the gear a family is genuinely paying for once the generosity of a baby shower is counted.
Read the whole plan back: the Budget vs Actual sheet
With the purchase list, the recurring sheet, and the timeline filled, the Budget vs Actual sheet pulls them together, and it is the sheet where the workbook earns its keep. Nothing on it is typed except the savings balances and three of the five goal targets. Every planned and actual figure is read live from the other sheets, so the comparison cannot drift out of sync with the underlying numbers.
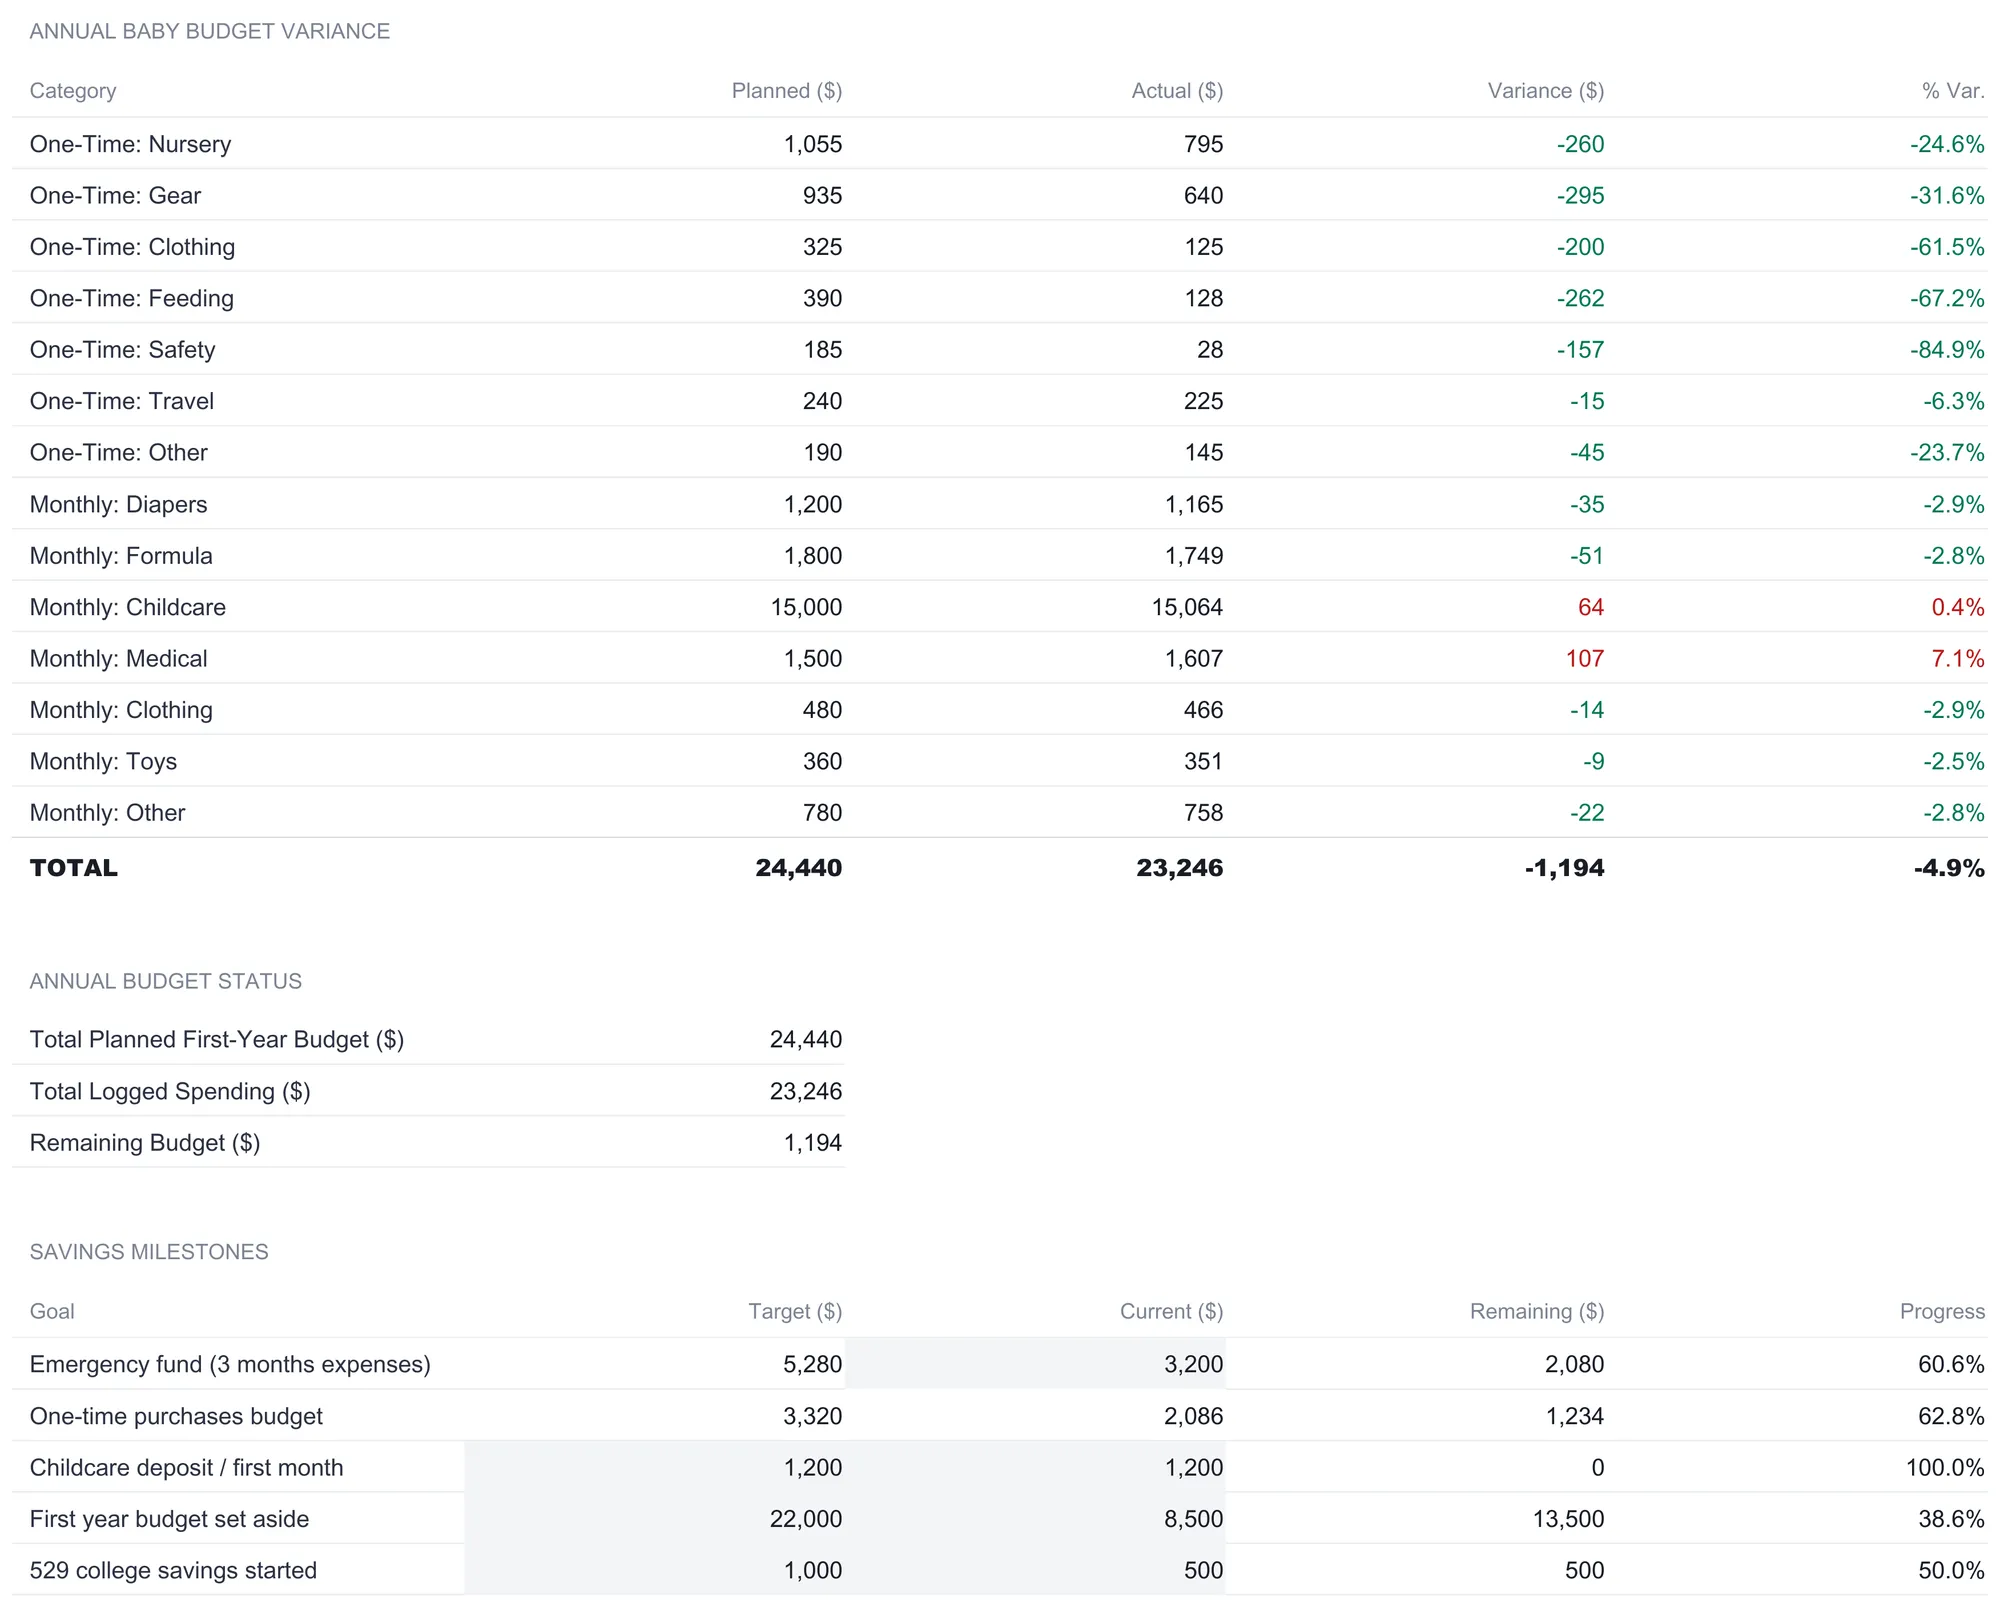
The main table, the Annual Baby Budget Variance, lines up planned against actual for every category in the file. The one-time rows read the purchase-list categories, so Nursery shows $1,055 planned against $795 actual, Gear $935 against $640, and so on down the seven setup categories. The monthly rows read the recurring plan against the logged timeline: each monthly category’s Planned figure is twelve times its monthly cost, and its Actual figure is that category’s total from the First Year Timeline. Childcare therefore shows $15,000 planned against $15,064 logged, a small overage of $64 that reads in red, and Medical shows $1,500 against $1,607, over by $107. Every other category came in under. The total lands at $24,440 planned against $23,246 logged, a variance of negative $1,194, or 4.9 percent under budget for the year. A budget that finished under overall while two categories ran over reads differently line by line than it does as a single number, which is the reason the table splits it.
Below the variance table, an Annual Budget Status block states the same result in three lines, $24,440 planned, $23,246 logged, and $1,194 remaining. Then a Savings Milestones block tracks five goals a new-parent budget tends to carry, each with a target, a current balance, a remaining amount, and a progress percentage. The emergency fund goal is set to three months of recurring expenses, and it computes its own target as the monthly recurring total times three, $5,280, against $3,200 saved so far, 60.6 percent of the way there. The one-time purchases goal reads its target straight from the purchase list at $3,320 against $2,086 spent. The remaining three, a childcare deposit at $1,200 fully funded, a first-year budget set aside at $8,500 of $22,000, and a $500 start on a 529 college savings account, are typed goals you set yourself. Because the first two milestones follow the workbook’s own numbers, changing the recurring total or the purchase list re-targets them automatically.
The dashboard: six numbers and two charts
The Dashboard reads the purchase list and the recurring sheet back into six KPI tiles across the top. Together they answer the question a first-year budget is really asking, which is not just what it costs but what shape that cost has.
| Tile | Sample value | What it reads |
|---|---|---|
| Total first-year cost | $24,440 | One-time estimated plus 12 months recurring |
| Monthly average | $2,037 | The first-year cost spread over 12 months |
| One-time purchases | $3,320 | Estimated setup cost |
| Recurring annual | $21,120 | 12 months of recurring cost |
| One-time spent | $2,086 | Actually paid on the purchase list |
| Items remaining | 8 | One-time rows still flagged Needed |
Reading them together is the point. The total first-year cost of $24,440 is the headline, but the two tiles beside it break it open: $3,320 of it is a one-time setup you buy around the due date, and $21,120 is a recurring bill spread across the year. The monthly average of $2,037 spreads the whole first year evenly over twelve months, a useful figure for fitting a baby into a household budget even though the real spending is lumpier than that. The one-time spent tile, $2,086, sits beside the $3,320 estimate as a live measure of how much of the setup is actually paid for, and the items-remaining count, 8, is the same story as a to-do list rather than a dollar figure.
Below the tiles, a Cost Overview by Category table repeats the seven one-time categories with their estimated, actual, and variance figures and a bought count, marking a category Complete once nothing in it is still needed, so Feeding and Travel read Complete while Safety sits at 1 of 4 done. Two charts turn the numbers into a picture, one plotting the one-time cost by category and one showing the first-year cost composition, where the childcare slice makes visible on the page what the 71 percent figure says in words. A currency selector next to the title relabels every money column and KPI across the workbook, changing the symbol shown without converting the underlying numbers.
One-time, recurring, and the first-year total in plain terms
A baby budget only has a few moving parts, and each is a plain step from the one before.
One-time cost is what you buy once to get set up, the crib, the stroller, the car seat, the first round of clothes. In the sample it is $3,320 estimated, and it is spent around the birth rather than every month. Some of it arrives as gifts, which is why the registry sheet exists and why the one-time-spent figure, $2,086, is lower than the estimate.
Recurring cost is what arrives every month and keeps arriving, diapers, formula, medical, and above all childcare. In the sample it is $1,760 a month, or $21,120 across the year, and it does not stop when the first year ends.
First-year total is simply the two added together, $3,320 plus $21,120, or $24,440. Spreading it over twelve months gives the $2,037 monthly average, but the average flatters the early months and understates the ones with a big childcare bill, which is why the timeline logs each month rather than assuming they are all the same. The single most important thing that total hides is that the great majority of it is recurring and childcare-driven, not the gear that gets all the attention on a registry.
Where a baby budget meets taxes and savings
The template records and plans; it does not file anything or move any money, and a couple of the numbers it tracks connect to decisions outside the spreadsheet. Childcare, the line that dominates the recurring total, is one of them. For US families, the IRS Child and Dependent Care Credit can offset part of what is paid for care that lets parents work, within annual dollar limits. Arriving at tax time with a year of categorized childcare spending already totaled turns that from a reconstruction into a lookup. Whether and how much a particular family qualifies for is a question for a tax professional; the workbook’s job is to have the figure ready.
The Savings Milestones block touches the other side, the cushion behind all this spending. Its emergency fund goal is built on three months of recurring expenses, and the CFPB’s guide to building an emergency fund covers the general approach to sizing and holding one. The template does not hold the money or recommend a figure; it sets a target from your own recurring total and tracks the balance you type in against it. The How to Use sheet is candid that the sample costs cover wide ranges: roughly $2,500 to $5,000 of one-time setup, $1,000 to $2,500 a month of recurring cost, and a first-year total between $15,000 and $30,000. Its role is to help build a realistic estimate for a specific situation rather than to state what any family will spend.
Excel or Google Sheets for a baby budget
The planner is an .xlsx file built on standard formulas, with no macros and no add-ons, so it behaves the same in Microsoft Excel and in Google Sheets after upload, and the How to Use sheet notes it works in LibreOffice Calc as well. Google Sheets suits two parents who want to open the same live budget from different phones and add a purchase as they make it; Excel suits a household that prefers a local file it controls. The structure described here, a one-time list and a recurring sheet feeding a timeline, a registry, and a budget-versus-actual view, is equally buildable in either, and nothing in this walkthrough depends on a feature only one of them has.
Which template fits the job
- Baby Budget Planner Ultimate Spreadsheet Template ($29) is the workbook this walkthrough follows: the 40-row one-time purchase list with its priority and status tags, the monthly recurring sheet with childcare on its own line, the pre-birth-and-first-year timeline, the registry tracker with its gift-value summary, the live budget-versus-actual sheet with savings milestones, and the six-KPI dashboard. The tier family starts smaller, with a free Baby Budget Planner template that compares budgeted against actual by category on a single sheet and a Baby Budget Planner Essentials ($19) that splits one-time from monthly costs and adds a dashboard around them. The Ultimate version is the one that carries the timeline, the registry tracker, and the Budget vs Actual sheet with its savings milestones.
- Wedding Budget Ultimate Spreadsheet Template ($29) is the same idea aimed at the other big planned expense: a vendor tracker, a payment schedule, a guest-cost analysis, and a budget-versus-actual view that plan a large one-time event the way the baby planner plans a first year. For anyone weighing both life events in the same season, the two share a way of thinking about a budget that is mostly known in advance.
Related
- Budgeting for a New Baby: Costs to Expect - the general first-year cost guide that estimates the ranges this template then tracks in detail
- How to Build a Wedding Budget in a Spreadsheet - the same planned-event structure applied to a wedding, with vendors and a payment schedule
- How to Plan College Savings in a Spreadsheet - the 529 milestone on the savings block, taken further into its own workbook
Frequently asked questions
How is this different from a general baby budget?
A general estimate is one number, a guess at what a first year costs. This workbook splits that number into the two halves that behave nothing alike: a one-time setup list of gear, nursery, and clothing you buy once, and the monthly recurring costs that run for twelve months. It then tracks each half separately, estimated against actual on the purchase list and planned against logged on a month-by-month timeline, and rolls both into a single first-year figure. Seeing the $3,320 of setup and the $21,120 of recurring cost side by side is the point, because they are saved for and spent in completely different ways.
Are the sample costs realistic for my situation?
They are editable sample figures, not a forecast. Every cost is a cell you type over, and the How to Use sheet gives the wide ranges these numbers actually cover: roughly $2,500 to $5,000 of one-time setup, $1,000 to $2,500 a month of recurring cost, and a first-year total anywhere from $15,000 to $30,000 depending on childcare choices and location. The sample lands at $24,440 with full-time daycare included, and childcare alone is 71 percent of the monthly recurring total, more than the other six categories put together.
Why does childcare sit on its own line?
Because it tends to move the total more than the rest put together. In the sample, the Childcare category is $1,250 a month, which is 71 percent of the $1,760 monthly recurring total, so daycare and backup care outweigh diapers, formula, medical, clothing, toys, and everything else combined. Keeping it on its own row rather than folded into a group means the one number most likely to decide the budget is always visible and easy to change.
What does the registry tracker actually calculate?
It logs each registry item with a price, who is covering it, and how many are needed versus received, then totals two things. The Total Value of Gifts Received sums the price of every item marked Gift that has arrived, $420 in the sample across a carrier, a breast pump, and a swing. The Self-Purchase Remaining figure sums what you still owe on items you are buying yourself, $80 for a high chair still on the registry. It values gifts and flags what is left to buy; it does not send thank-you notes or connect to a store.
Can the spreadsheet track what we actually spend, not just the plan?
Yes, on two sheets. The One-Time Purchases list carries an Actual Cost column next to each estimate, and the First Year Timeline logs real spending month by month across the pre-birth months and the baby's first twelve. The Budget vs Actual sheet then reads both back with nothing retyped, comparing planned against logged for every category. In the sample the year came in at $23,246 logged against $24,440 planned, running $1,194 under, with only childcare and medical finishing slightly over.
Sources
- Topic no. 602, Child and Dependent Care Credit - Internal Revenue Service
- An essential guide to building an emergency fund - Consumer Financial Protection Bureau
About this article
Sheet names, row counts, dropdowns, formulas, cached figures, conditional formatting, and chart types checked on 2026-09-10 against the shipped Baby Budget Planner Ultimate workbook (Dashboard, One-Time Purchases, Monthly Recurring, First Year Timeline, Registry Tracker, Budget vs Actual, How to Use). Tier comparisons checked on 2026-09-10 against the shipped free and Essentials Baby Budget Planner workbooks; screenshot captions checked against the images in the article. IRS Topic 602 and the CFPB emergency-fund guide rechecked against the live pages on 2026-09-10. Last reviewed September 2026.