Profit and Loss Projection Pro
Comprehensive P&L projection with revenue forecasting, COGS, operating expenses, consolidated income statement, and three-scenario analysis.
Free vs Pro
- Project revenue and expenses for a single scenario across 6 months
- Dashboard with gross profit and net income
- Basic P&L structure with revenue minus costs
- Works in Excel and Google Sheets
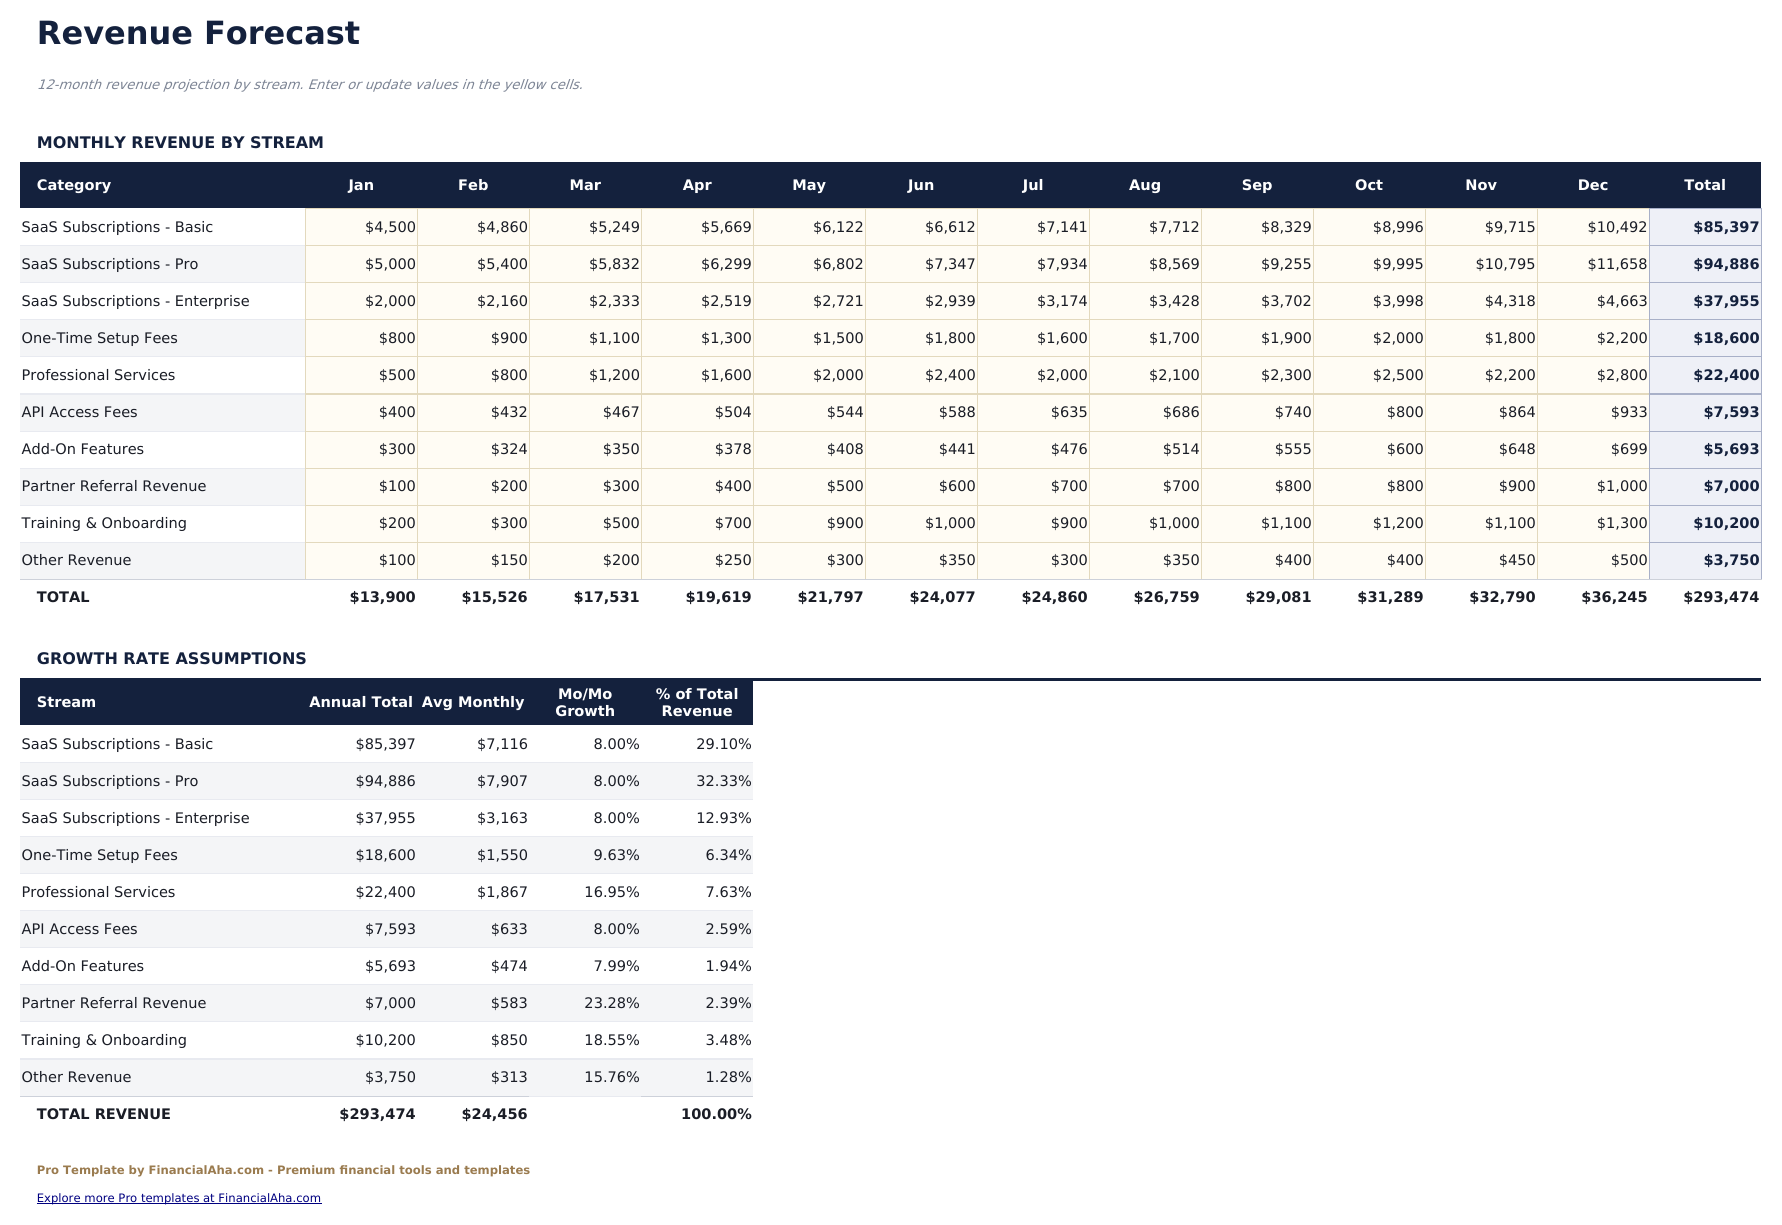
- Revenue Forecast sheet with up to 10 product or service lines, monthly projections, and annual totals with growth rate tracking
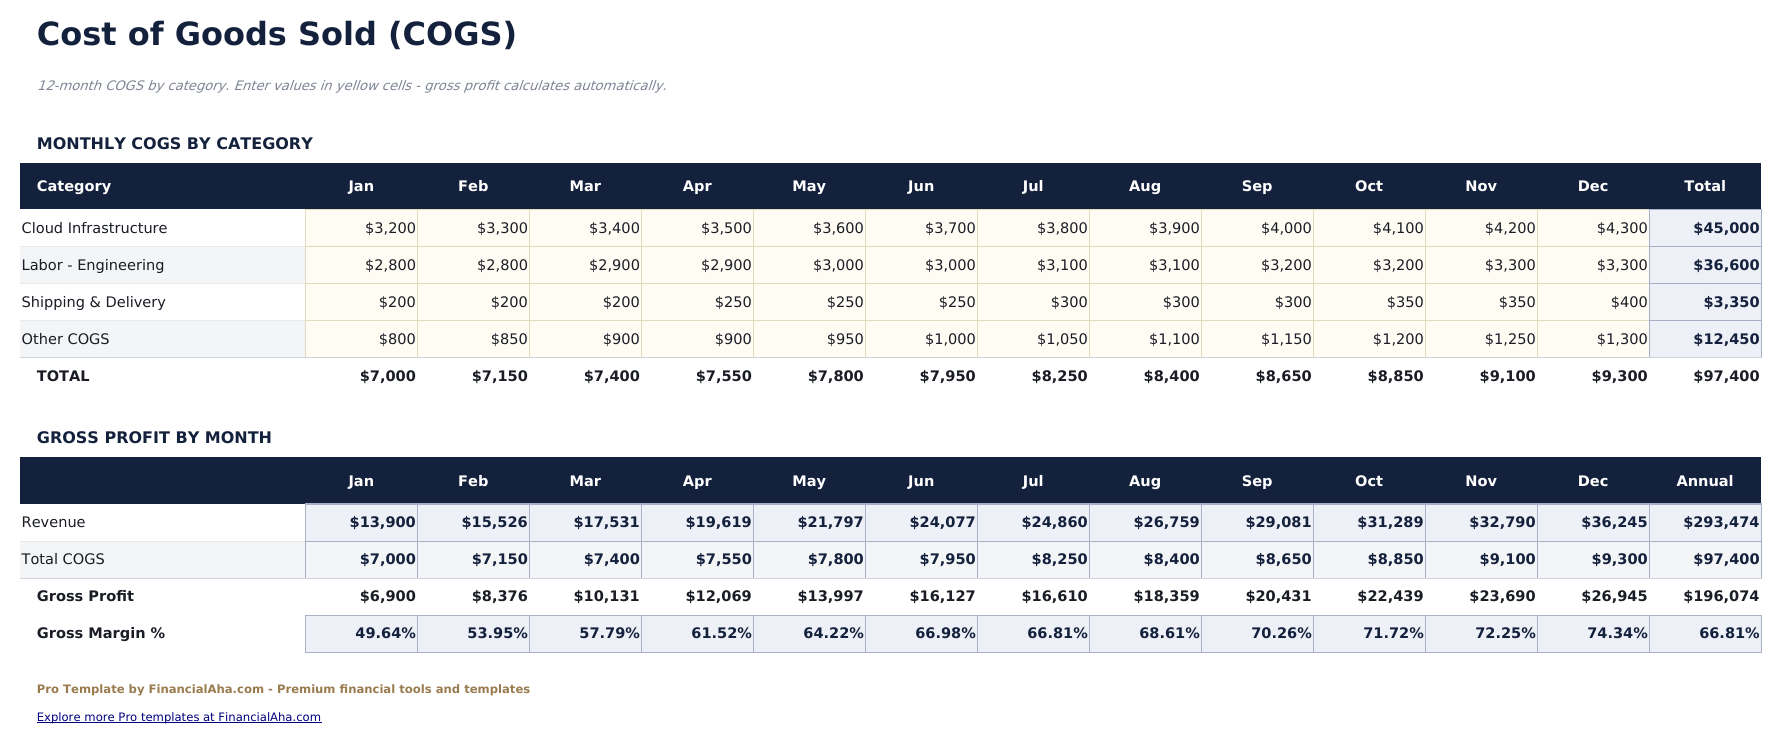
- COGS sheet breaking down direct material, direct labor, and overhead costs per revenue line with gross margin calculations
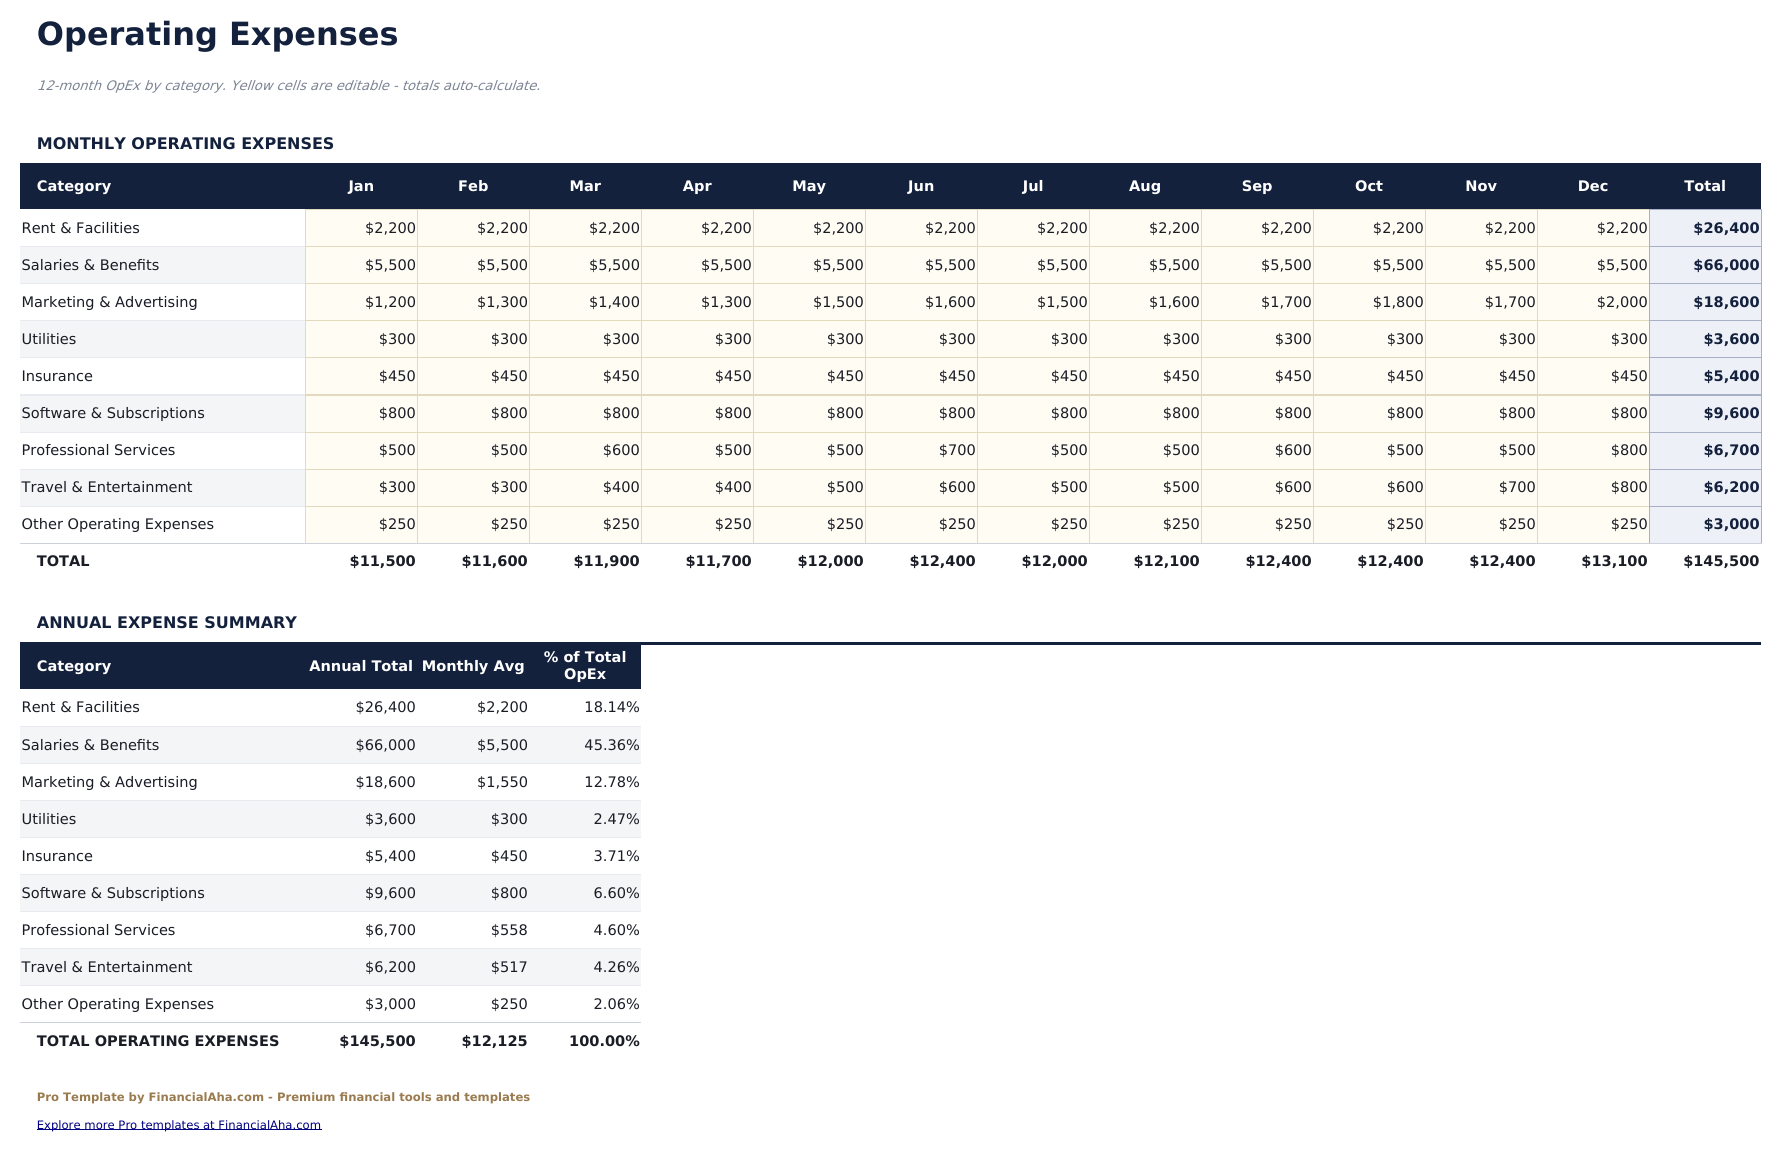
- Operating Expenses sheet with 12 expense categories across 12 monthly columns and annual budget vs actual tracking
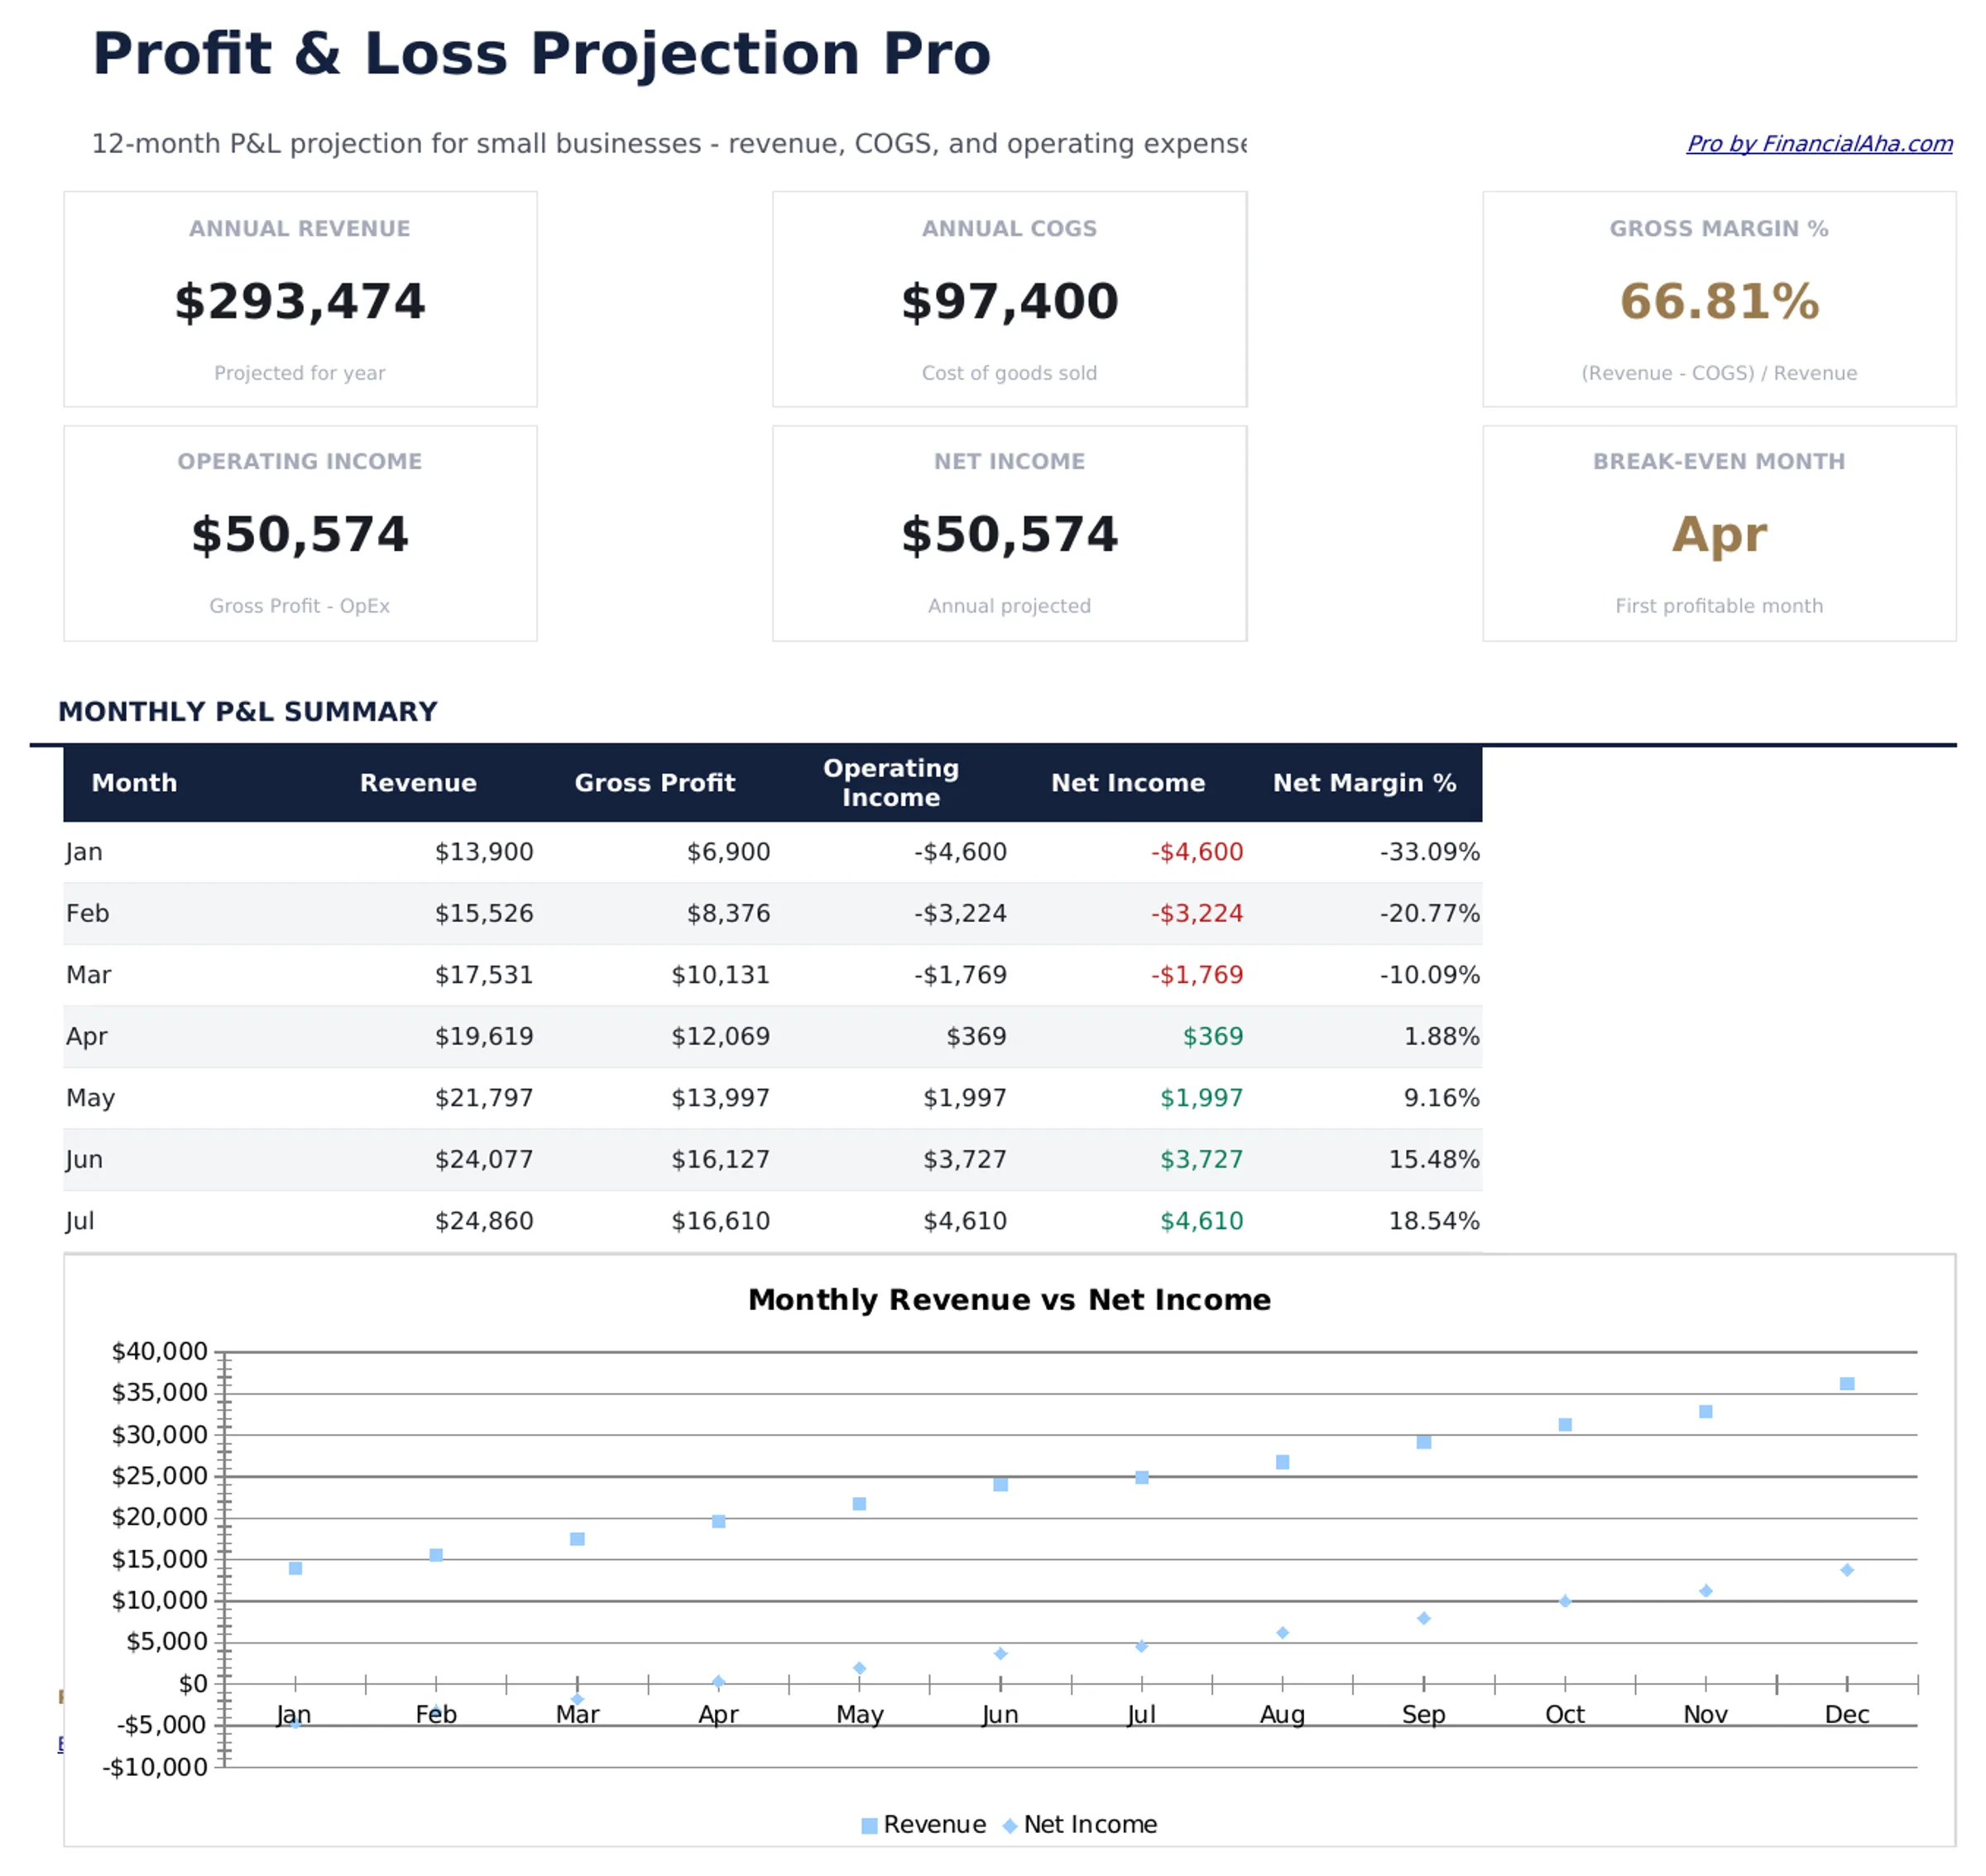
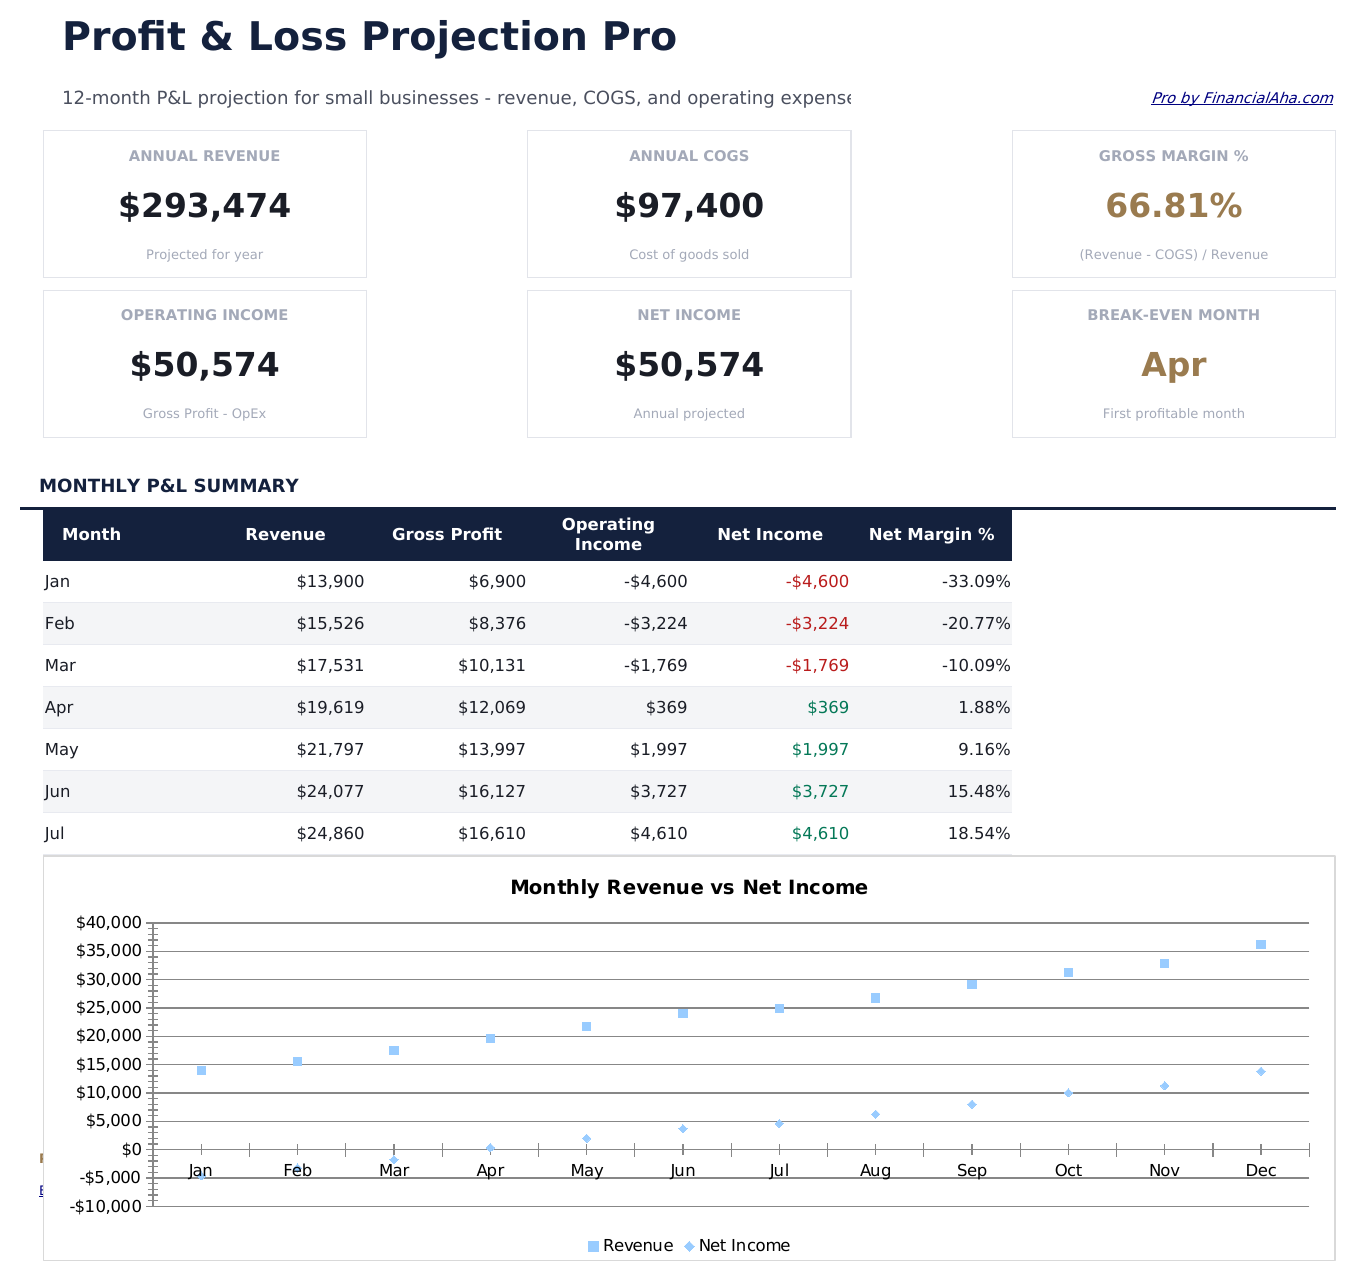
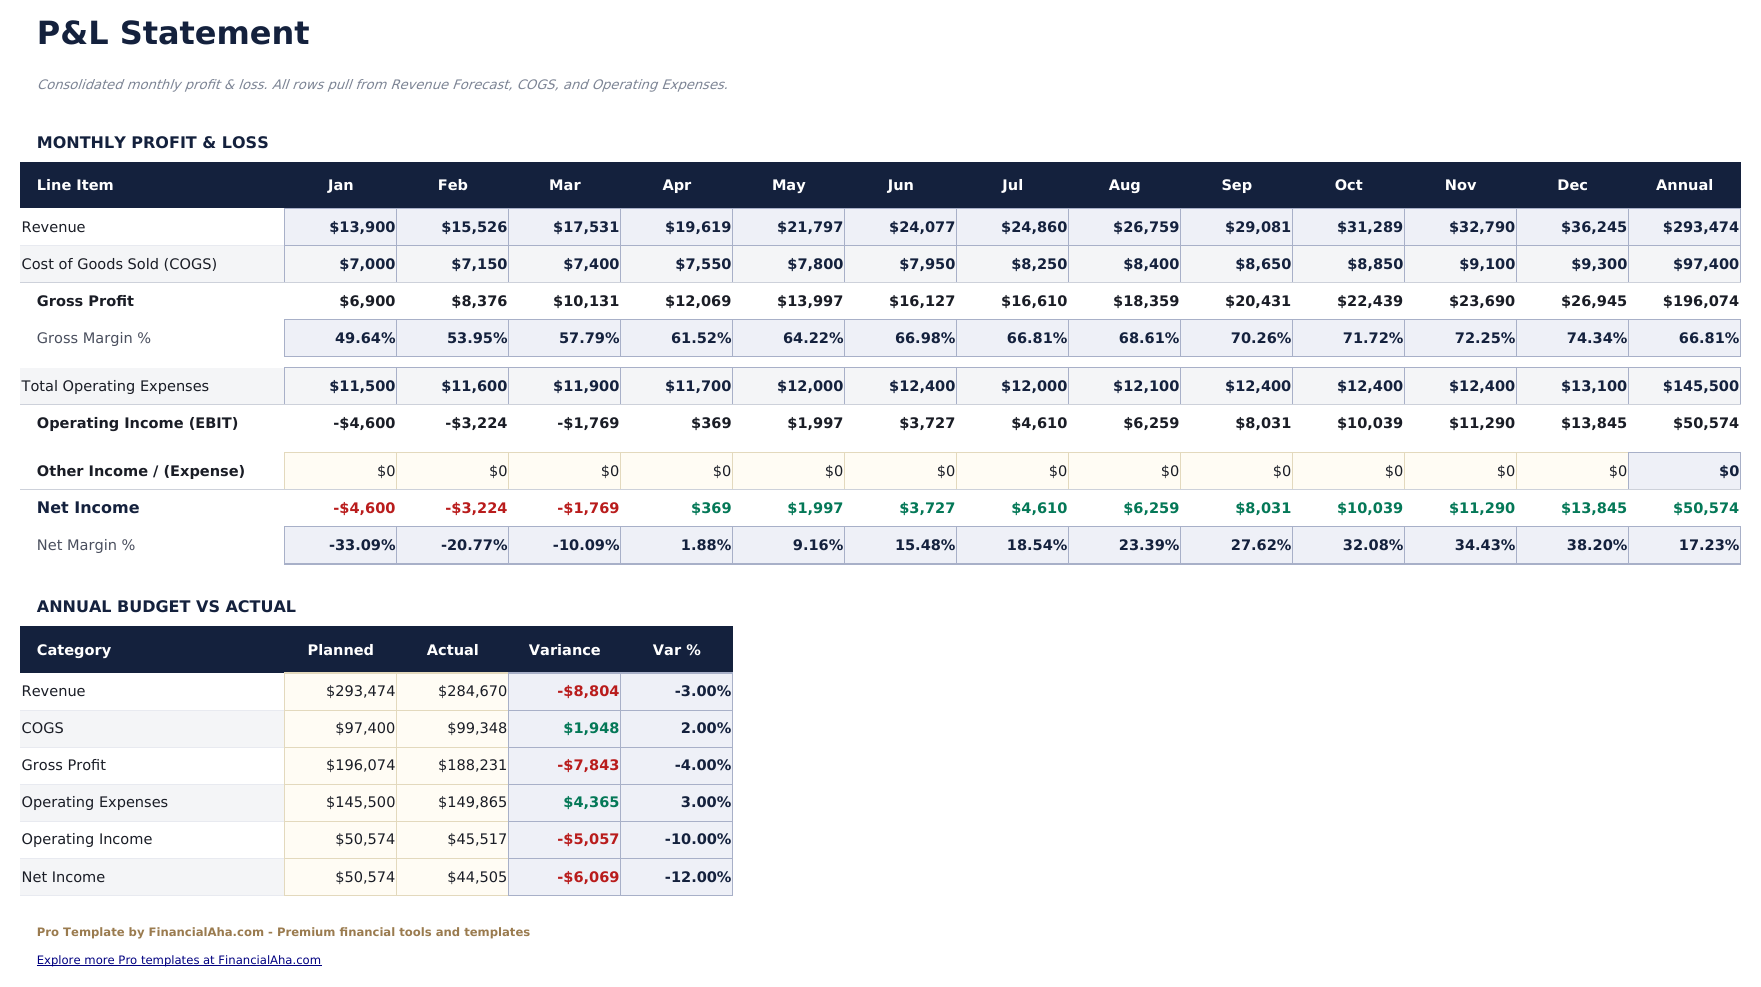
- Consolidated P&L statement pulling from all input sheets: revenue, COGS, gross profit, operating expenses, operating income, and net income
- Dashboard with 6 KPI cards: annual revenue, annual COGS, gross margin %, operating income, net income, and break-even month
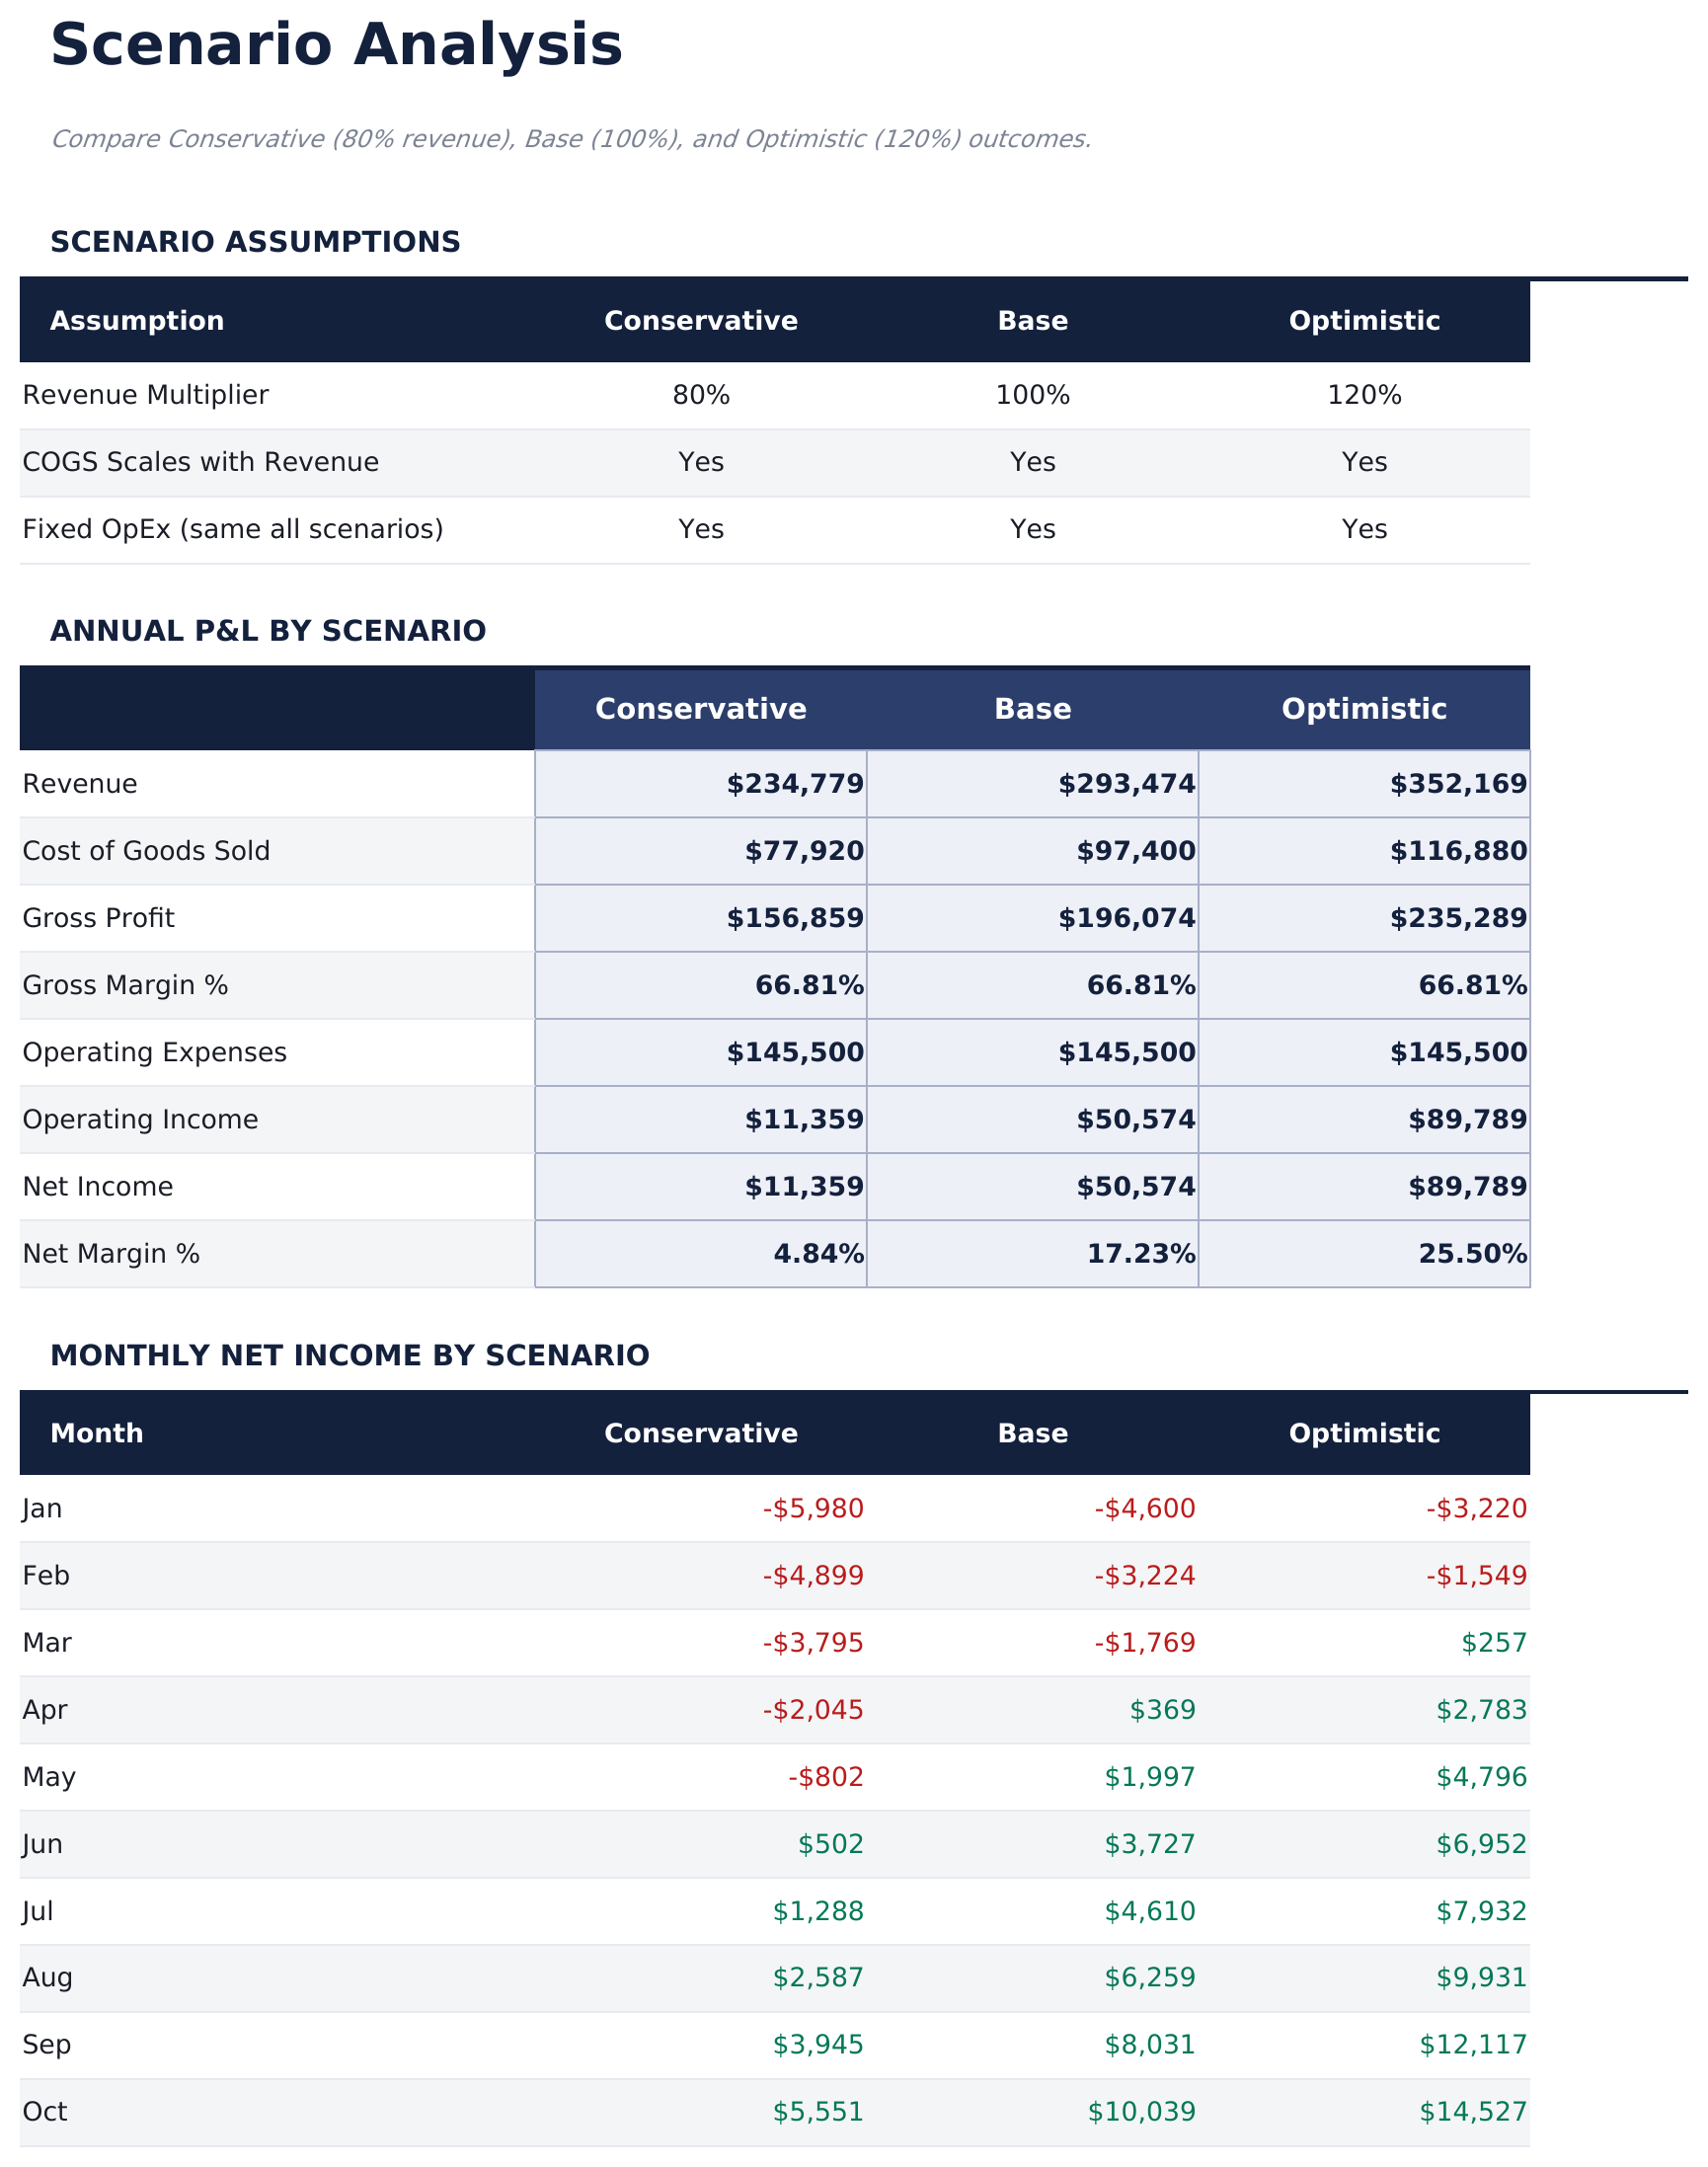
- Scenario Analysis comparing Base Case, Optimistic, and Pessimistic projections on revenue, margins, and net income
- Monthly actuals column alongside projections to track forecast accuracy as the year progresses
- Works in Microsoft Excel, Google Sheets, and LibreOffice Calc with no macros required
Preview
See what's inside this template
How to Use This Template
Enter revenue projections
Go to the Revenue Forecast sheet and add each product or service line with monthly projected revenue and an annual growth rate assumption.
Enter costs
Fill in the COGS sheet with direct material, labor, and overhead costs per line. Then go to Operating Expenses and enter projected amounts for each category by month.
Review the P&L statement
The consolidated P&L pulls from all input sheets automatically. Enter actuals each month to track how projections compare to real results.
Run scenario analysis
Go to the Scenario Analysis sheet and set multipliers for your Optimistic and Pessimistic cases. The three scenarios display side by side for quick comparison.
Built by Claude AI. Perfected by us.
We use Claude AI to draft each Pro template after deep research. Then our team steps in - refining the layout, stress-testing every formula, fixing edge cases, and polishing the design. The AI gets us 80% there. The last 20% is all human judgment.
One-time purchase. No subscription. Works in Excel & Google Sheets.
Frequently Asked Questions
How many revenue lines can I project?
Up to 10 product or service lines, each with monthly projections and a year-over-year growth rate input. All lines roll up automatically into the consolidated P&L.
How does the scenario analysis work?
Enter a revenue multiplier and cost multiplier for each of three scenarios: Optimistic, Base Case, and Pessimistic. The sheet shows projected revenue, gross profit, and net income for each scenario side by side.
Can I track actuals alongside projections?
Yes. The P&L Statement sheet has both a Projected and an Actuals column for each month. Enter actual figures as the year progresses to calculate forecast variance.
What does the break-even month show?
The break-even month identifies the first month where net income turns positive. The dashboard highlights this on the KPI card so you can see when projected revenue covers all costs.
Can I use this for a startup with no historical data?
Yes. All inputs are forward-looking projections. Enter your best estimates for revenue and costs. The scenario analysis helps frame the range of possible outcomes.
What do I get after purchase?
You receive an Excel file (.xlsx) that works in Microsoft Excel, Google Sheets, and LibreOffice Calc. Download it immediately after purchase - no signup or account required.
Is there a free version?
Yes. The free version of this template is available with basic features. The Pro version adds advanced analysis, more capacity, and additional sheets.
What if it does not work for me?
Contact us and we will help troubleshoot. The template works in Microsoft Excel, Google Sheets, and LibreOffice Calc with no macros required.
Looking for more Pro templates?
We offer Pro versions of our most popular spreadsheet templates with advanced features, more capacity, and deeper analysis.