Spreadsheet Guide
Retirement Planning Spreadsheet
Retirement planning involves long time horizons and many variables. A spreadsheet that models different scenarios helps make abstract retirement goals feel concrete and actionable.
In Depth
Making Long-Term Projections Feel Concrete
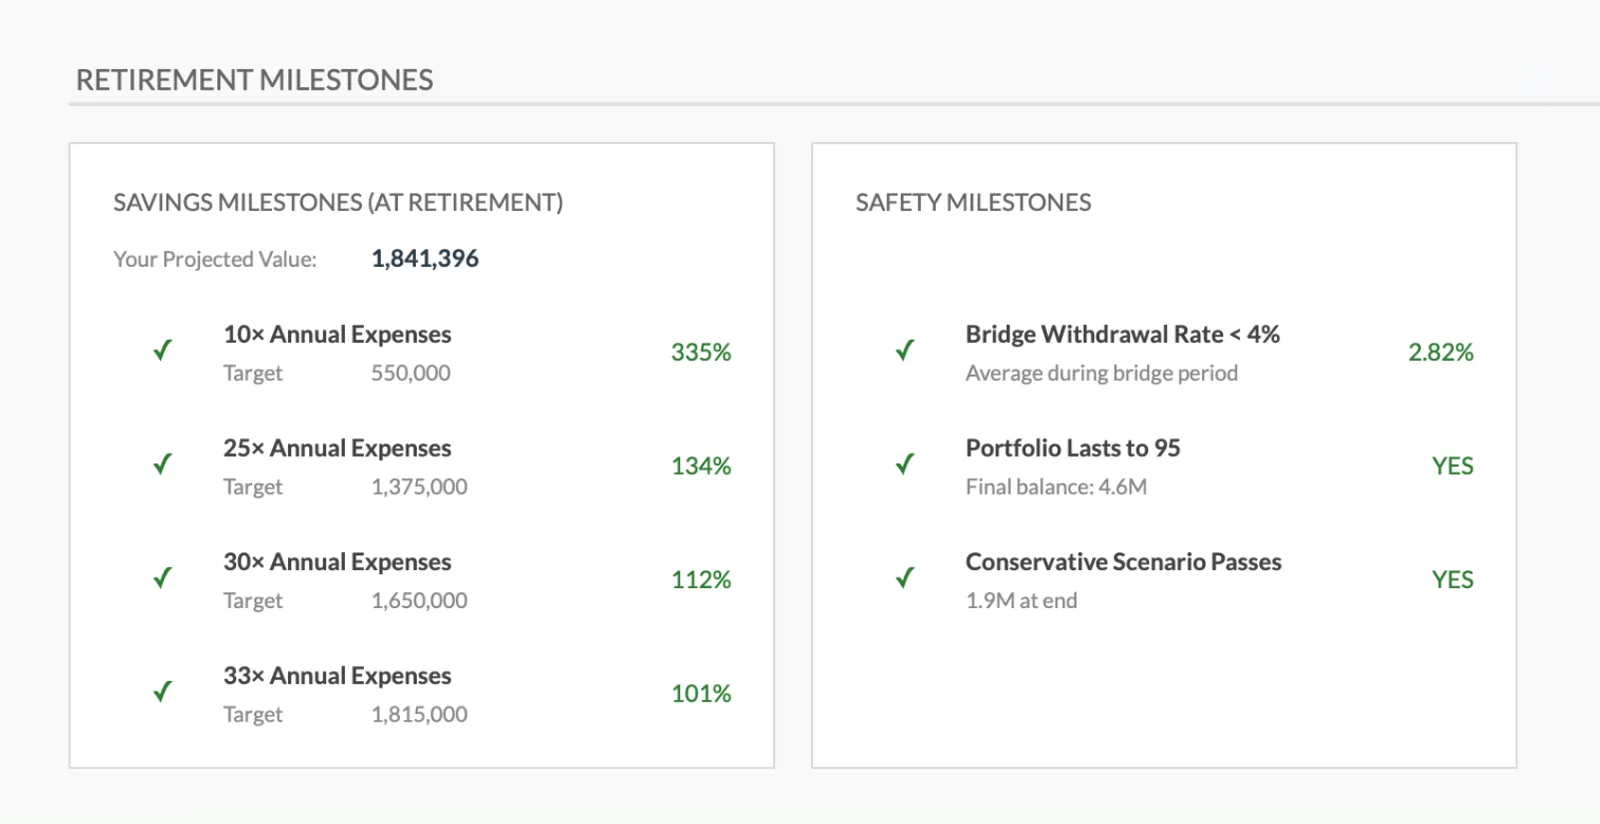
Retirement planning involves projecting 20, 30, or 40 years into the future - a timeframe that feels abstract and difficult to act on. A spreadsheet that breaks this long horizon into annual increments makes the abstract concrete. Instead of "I need $1.2 million by age 65," the view becomes "at my current savings rate, I reach $200,000 by age 40, $500,000 by age 50, and $1.1 million by age 65." This year-by-year progression transforms a distant goal into a series of nearer milestones.
Scenario modeling is where retirement spreadsheets provide their most practical value. The ability to ask and answer "what if" questions - what if contributions increase by $200/month, what if returns average 5% instead of 7%, what if retirement starts at 62 instead of 65 - turns retirement planning from a static calculation into a dynamic exploration. Each variable change reveals how sensitive the outcome is to that particular factor, which helps prioritize which levers to pull.
The connection between current budget and retirement projections deserves more attention than it typically receives. Current monthly expenses are the basis for estimating retirement income needs. Current savings contributions are the inputs driving portfolio growth projections. Any change to the monthly budget - reducing expenses, increasing savings - immediately affects the retirement projection. A system that tracks both the current budget and long-term projections makes this connection visible and actionable.
Overview
What a Retirement Planning Spreadsheet Does
A retirement planning spreadsheet models the accumulation phase (years of saving and investing) and the distribution phase (years of spending in retirement). It takes inputs like current savings, monthly contributions, expected returns, and desired retirement income, then projects whether the current plan is sufficient. The spreadsheet can model different scenarios - what if contributions increase, what if retirement is delayed by a few years, what if market returns are lower than expected.
How It Works
How to Use a Retirement Spreadsheet
Enter current retirement savings and contributions
Start with the current balance of all retirement accounts (401k, IRA, Roth, etc.) and the monthly contribution amount including any employer match. These are the inputs that drive the growth projections.
Set retirement assumptions
Choose a target retirement age, expected annual investment return (7-10% before inflation or 4-7% after inflation are common assumptions), and estimated annual expenses in retirement. These assumptions significantly affect the projections, so running multiple scenarios is valuable.
Review the projections and gap analysis
The spreadsheet calculates whether current contributions will produce enough savings to fund retirement at the desired level. If there is a gap, it shows how much additional savings is needed or how many additional years of work would close it.
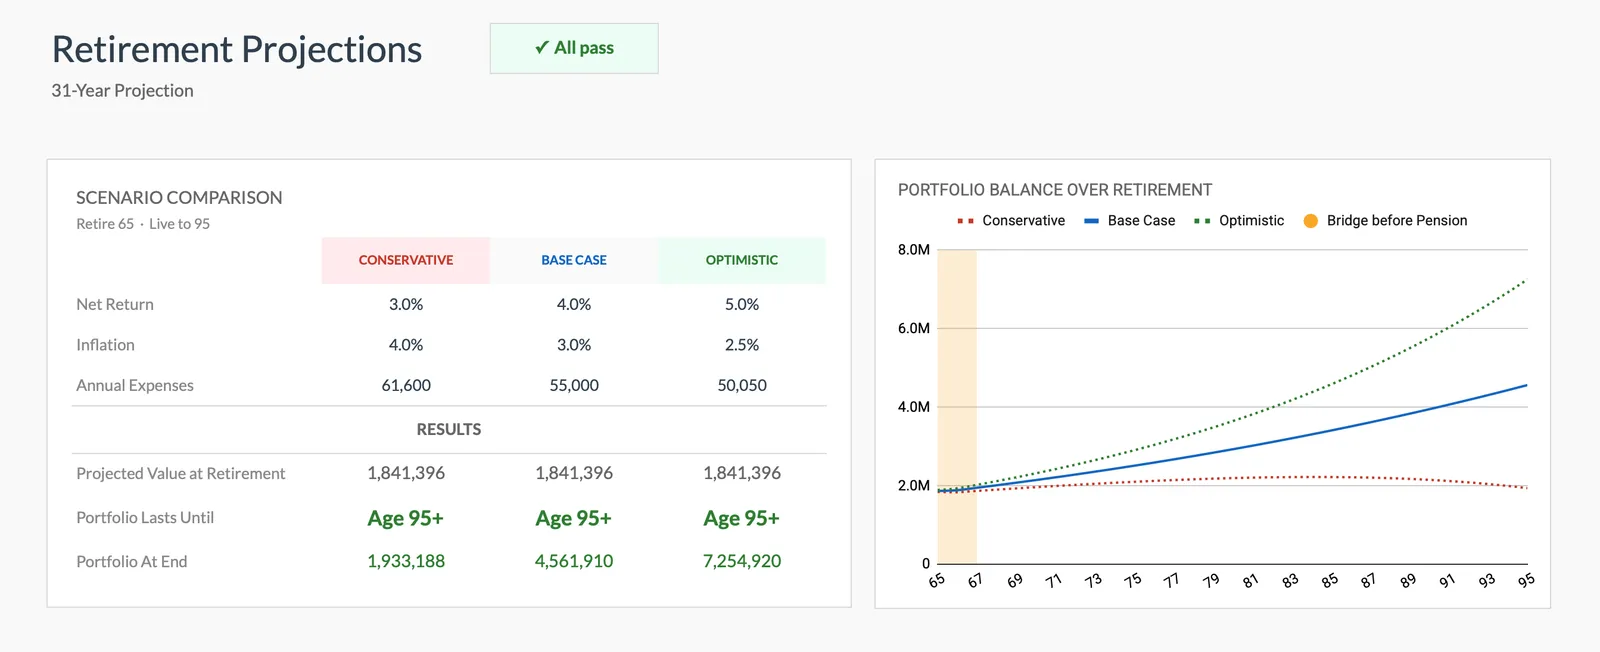
Model different scenarios
Run scenarios: What if contributions increase by $200/month? What if returns average 5% instead of 7%? What if retirement starts at 67 instead of 65? Seeing how each variable affects the outcome helps prioritize which levers to pull.
See The Template
A ready-made retirement planning tool
Instead of building from scratch, start with a template that has the structure, formulas, and visuals already in place.
- Pre-built formulas and calculations
- Visual charts and dashboards
- No setup required
- Works in Google Sheets and Excel
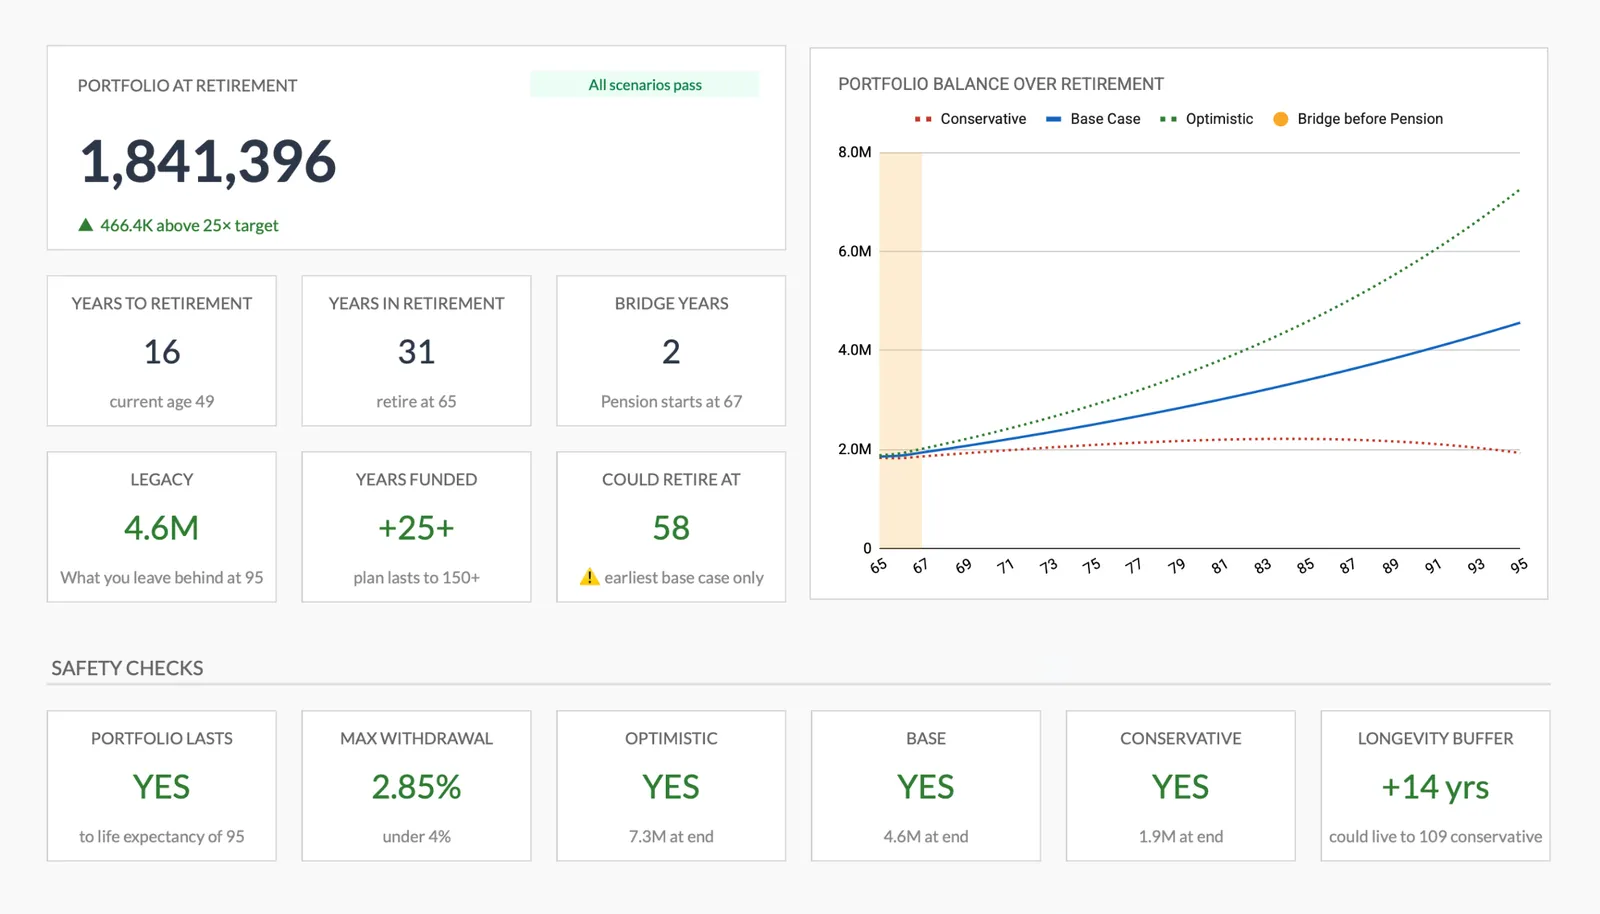
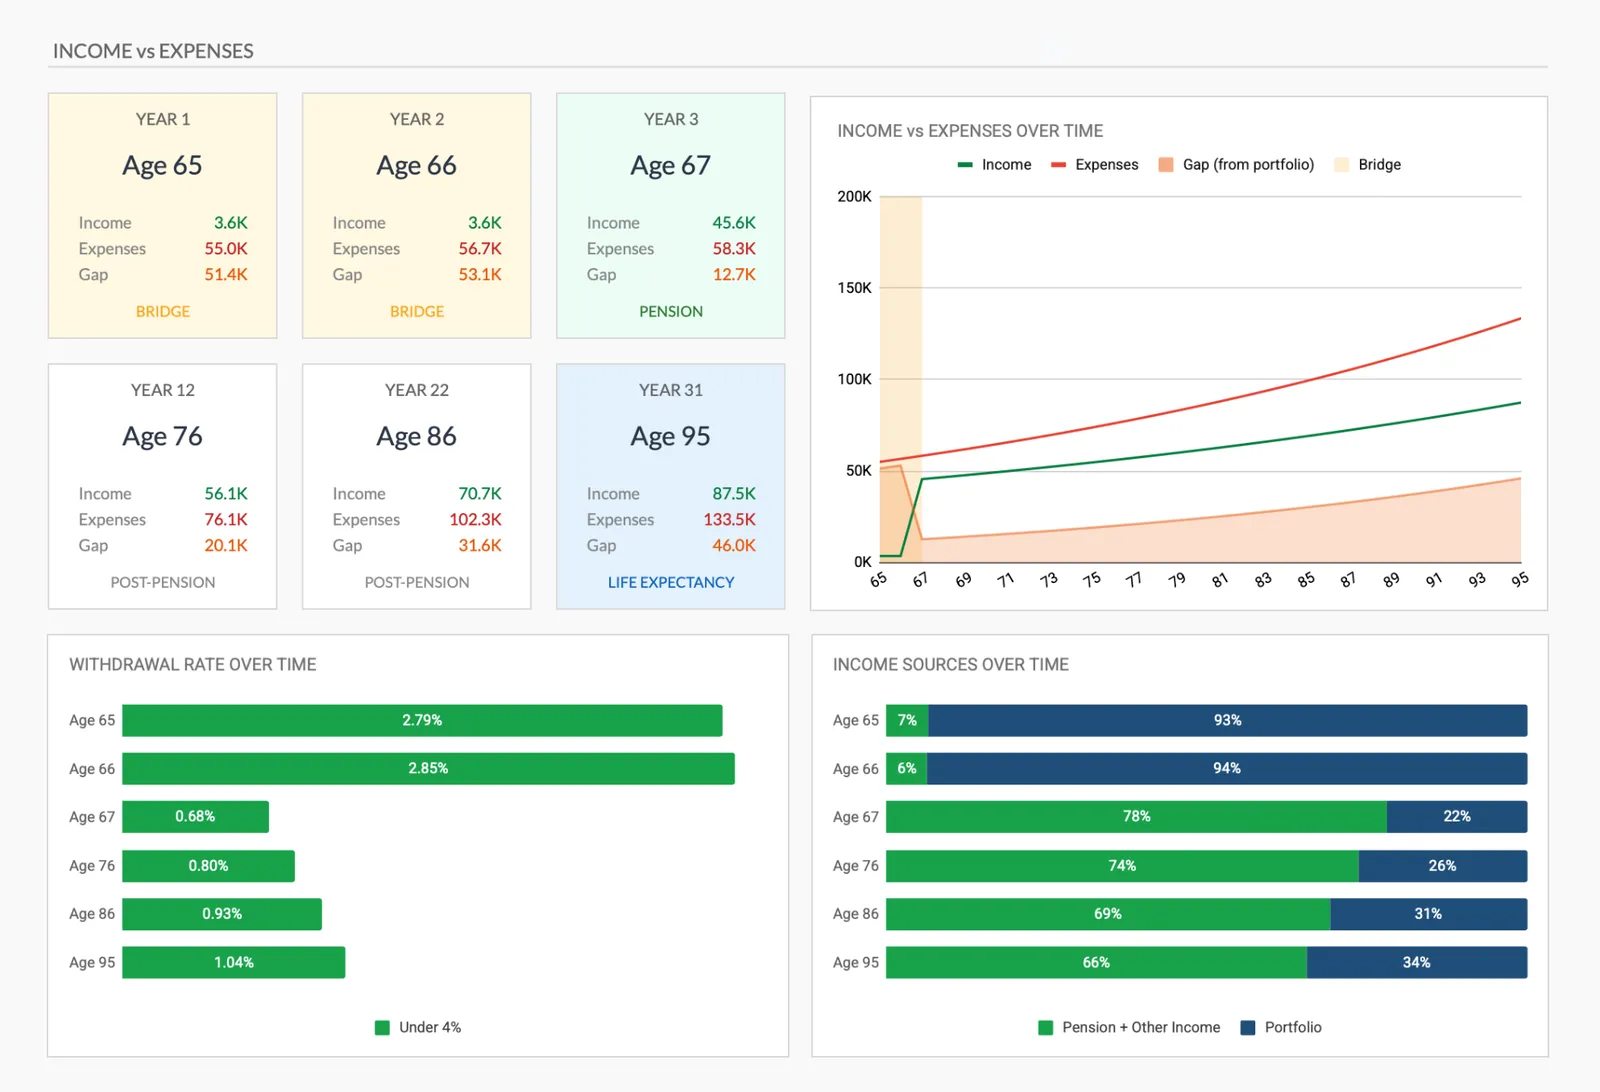
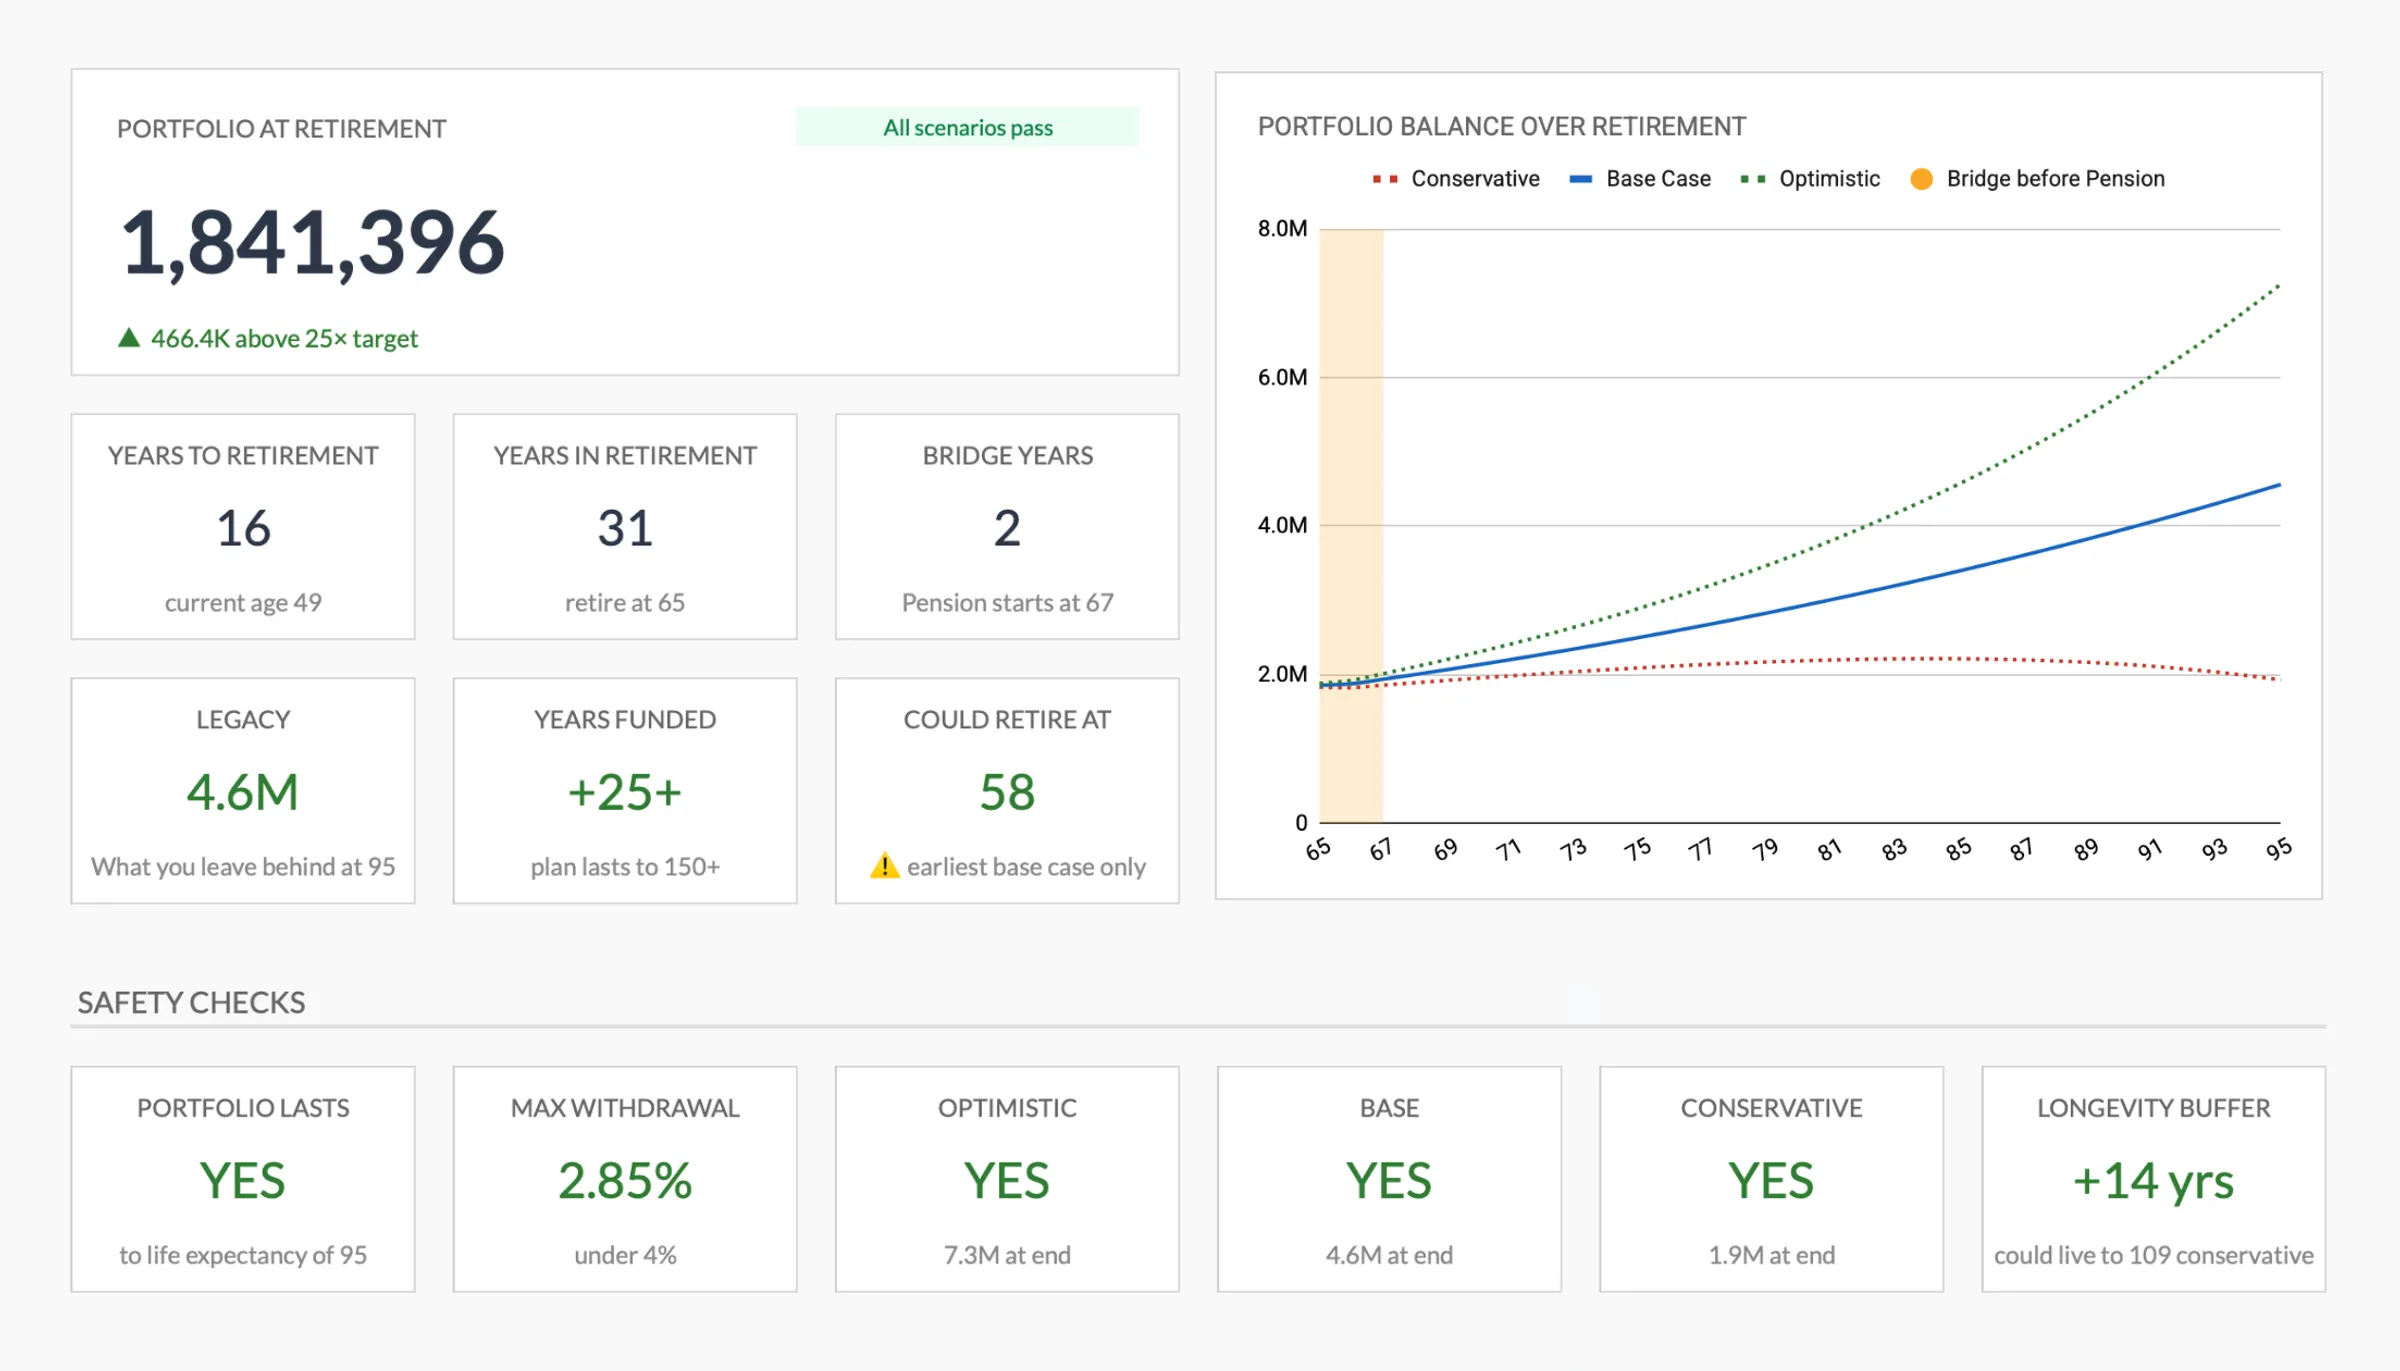
Complete retirement overview with projections
Project your retirement savings growth
Track progress toward retirement goals
Plan your retirement income against expenses
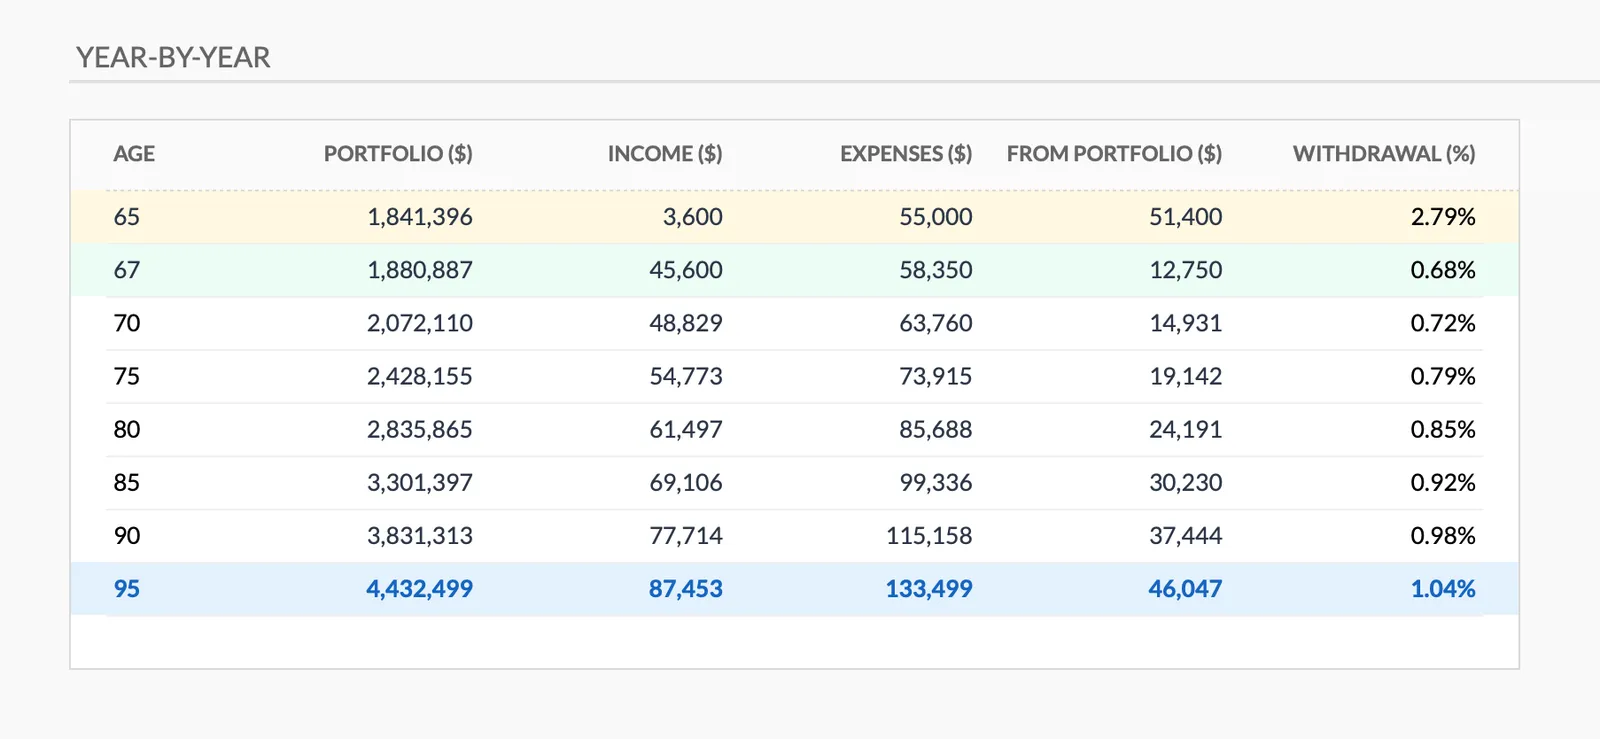
Detailed year-by-year retirement projection
Get Started
Template for This Use Case
Built specifically for retirement planning with year-by-year projections, milestone tracking, income vs. expense modeling, and scenario planning. See exactly where you stand relative to your retirement goals.
View template Save $44Get retirement projections plus monthly budgeting and a travel planner. Plan the retirement you are working toward while managing the budget that makes it possible.
Includes 3 templates
View bundleCommon Questions
Retirement Planning Spreadsheet FAQ
What assumptions should a retirement spreadsheet use?
Common assumptions: 7% pre-inflation or 4-5% post-inflation annual returns, 3% inflation rate, 80% of pre-retirement income needed in retirement, and Social Security benefits starting at 67. Conservative assumptions (lower returns, higher expenses) produce a safer plan than optimistic ones.
How accurate are retirement projections?
No projection will be exactly right over a 20-40 year period. The value is in understanding the general trajectory and the impact of different variables. Regular updates (annually) with actual data keep projections more realistic over time. The projections get more accurate as retirement approaches.
Should Social Security be included in retirement planning?
Including Social Security provides a more complete picture, but using conservative estimates is prudent given the political uncertainty around future benefits. The SSA.gov website provides personalized benefit estimates. Some planners suggest using 75-80% of the estimated benefit to build in a safety margin.
How much should be saved for retirement each year?
A common guideline is 10-20% of gross income including employer matching. The right amount depends on starting age, current savings, and retirement goals. Someone starting at 25 with a 10% savings rate is in a very different position than someone starting at 45 - the later start requires a higher rate.
When should the retirement plan be reviewed?
Annual reviews are the minimum. Major life changes (job change, marriage, home purchase, inheritance) warrant an immediate review. As retirement approaches (within 10 years), more frequent reviews and detailed planning become increasingly valuable.
Can't find the answer you're looking for? Contact our team
Get a ready-made retirement planning spreadsheet
Skip the setup and start with a professionally designed spreadsheet template. All formulas, charts, and tracking built in.
Ready to get started?
Download instantly and start managing your finances, or contact us to design a custom template package for your needs.