
Five retirement strategies dominate financial planning conversations: the 4% rule, the bucket strategy, Social Security timing, target date funds, and FIRE. Each solves a different problem, from steady withdrawals to volatility protection to early exit. This guide works the actual math on all five so you can see which one, or which combination, fits your situation.
Five retirement strategies come up again and again in financial planning conversations. Each one works differently, suits different situations, and relies on different math. Here’s how they work - with numbers.
These strategies aren’t mutually exclusive. Many people combine two or three of them. The goal here is to understand the mechanics of each one so you can evaluate which combination fits your situation.
1. The 4% Rule
The simplest withdrawal strategy. Take out 4% of your savings in year one, then adjust for inflation each year after. The idea: your money lasts roughly 30 years.
Originally developed by financial planner William Bengen in 1994, the rule is based on historical U.S. stock and bond market returns going back to 1926. It’s designed for a portfolio split roughly 50/50 between stocks and bonds.
Who it suits: People who want a straightforward, predictable withdrawal plan without complex calculations.
Worked example
Starting balance: $1,000,000
| Year | Withdrawal | Notes |
|---|---|---|
| 1 | $40,000 | 4% of $1,000,000 |
| 2 | $40,800 | Adjusted for 2% inflation |
| 3 | $41,616 | Adjusted for 2% inflation |
Worth knowing: the 4% rule was developed using historical U.S. market data. It assumes a mixed stock/bond portfolio and doesn’t account for major market downturns early in retirement.
That last point has a name: sequence-of-returns risk. Withdrawing a fixed amount while your balance is depressed forces you to sell more shares at low prices, which can permanently shrink the portfolio even when the 30-year average return looks fine. A crash in the first few years of retirement does far more damage than the same crash later on, once the portfolio has had time to grow. It is the main reason a rigid 4% withdrawal can still fail in a bad decade, and the main reason the bucket strategy below exists. The Retirement Calculator projects a balance year by year up to your retirement age and compares it against the target a 4% withdrawal implies, and the 4 percent rule spreadsheet walkthrough covers how the drawdown side of the math gets built in a spreadsheet.
2. The Bucket Strategy
Split your savings into three buckets based on when you need the money. Short-term spending stays safe in cash. Long-term money stays invested for growth.
Who it suits: People who worry about market dips wiping out near-term spending money.
Worked example
Annual expenses: $50,000
| Bucket | Timeframe | Amount | Invested in |
|---|---|---|---|
| 1 | Years 1-5 | $250,000 | Cash, short-term bonds |
| 2 | Years 5-10 | $250,000 | Moderate-risk bonds |
| 3 | Years 10+ | $500,000 | Growth stocks |
As Bucket 1 runs down, it gets replenished from Bucket 2. Bucket 3 has the longest runway to recover from market drops.
The bucket strategy doesn’t change total returns. Its value is psychological - knowing your next 5 years of spending are safe in cash makes it easier to ride out stock market downturns without panic selling.
3. Social Security Optimization
Delay claiming Social Security to increase your monthly payout. Claiming at 62 reduces the benefit by 30% for anyone with a full retirement age of 67, while waiting all the way to 70 adds 24% through delayed retirement credits.
Who it suits: People in good health who have other income sources to bridge the gap before claiming.
Worked example
Full retirement age benefit: $2,000/month
| Claim age | Monthly benefit | Change |
|---|---|---|
| 62 | $1,400 | -30% |
| 67 | $2,000 | Full benefit |
| 70 | $2,480 | +24% |
The difference between claiming at 62 vs. 70 is $1,080/month - or $12,960/year. Over 20 years, that adds up to $259,200 in additional income.
The break-even age, the point where the higher payments from delaying overtake the head start of claiming early, is typically around 80 to 82. People who live past that come out ahead by waiting, while those with shorter life expectancies or immediate income needs may find earlier claiming more practical. The Social Security Calculator takes a full retirement age benefit and a life expectancy, then shows the monthly amount, lifetime total and break-even age for claiming at 62, 67 and 70. How the benefit formula works walks through the 35-year earnings math behind that number.
4. Target Date Funds
A single fund that automatically shifts from aggressive to conservative as your retirement date approaches. No rebalancing required.
Who it suits: People who want a hands-off approach. One fund, one decision.
Worked example
A 2040 target date fund might start with:
- Now: 80% stocks / 20% bonds (growth phase)
- 2035: 60% stocks / 40% bonds (transition)
- 2040: 30% stocks / 70% bonds (preservation)
The fund manager handles the shift automatically. The trade-off: less control over specific investments, and expense ratios vary by provider.
Target date funds are available in most employer 401(k) plans. Expense ratios range from 0.10% (index-based) to 0.75% (actively managed). That difference compounds significantly over decades - worth checking.
5. FIRE (Financial Independence, Retire Early)
Save aggressively, often 50% or more of income, to build enough wealth to retire decades early. FIRE uses the 4% rule in reverse to calculate the target number: this is the same idea covered in what financial freedom really means.
Who it suits: High earners willing to live well below their means for 10-20 years in exchange for early financial independence.
Worked example
Desired annual spending: $40,000
- Target savings: $40,000 / 0.04 = $1,000,000
- At a 50% savings rate on $80,000 income, that’s $40,000/year invested
- With 7% average returns, the target is reachable in roughly 15 years
Change any of those inputs and the timeline moves. To test your own income, annual spending, expected return, and withdrawal rate, run them through the FIRE calculator below.
FIRE requires significant lifestyle trade-offs during the accumulation phase. Some people pursue “Lean FIRE” (minimal spending) or “Fat FIRE” (higher target, more comfortable lifestyle).
FIRE variations
| Type | Annual spending target | Savings needed (4% rule) | Lifestyle |
|---|---|---|---|
| Lean FIRE | $20,000-$30,000 | $500,000-$750,000 | Minimal, often geographic arbitrage |
| Regular FIRE | $40,000-$60,000 | $1,000,000-$1,500,000 | Comfortable but modest |
| Fat FIRE | $80,000-$120,000 | $2,000,000-$3,000,000 | No significant lifestyle compromises |
Quick comparison
| Strategy | Complexity | Best for | Key risk |
|---|---|---|---|
| 4% Rule | Low | Simple withdrawal planning | Doesn’t adapt to market conditions |
| Bucket Strategy | Medium | Managing market volatility | Requires periodic rebalancing |
| Social Security Optimization | Low | Maximizing guaranteed income | Depends on longevity |
| Target Date Funds | Low | Hands-off investors | Less control, varies by provider |
| FIRE | High | Early retirement seekers | Requires extreme savings discipline |
Combining strategies
These strategies work together more often than people realize:
- 4% Rule + Bucket Strategy: Use the bucket system for asset allocation while using the 4% rule to determine annual withdrawal amounts.
- Social Security Optimization + Bucket Strategy: Use Bucket 1 to cover expenses during the delay period, then switch to Social Security as the primary income source.
- FIRE + Social Security: Retire early using the 4% rule, then reduce withdrawals when Social Security kicks in - extending the portfolio’s lifespan.
The math behind each strategy changes significantly based on personal variables like savings rate, expected returns, and retirement age. The Retirement Financial Planning & Projections Spreadsheet works the drawdown side with personal numbers. You enter your ages, annual expenses, one combined savings balance, one annual savings figure, and pension income with a start age, and it projects portfolio, income, expenses, and the resulting withdrawal rate at each age through to life expectancy, with a check on whether that rate stays under 4%. The same inputs also run as conservative, base case and optimistic scenarios, and 12 what-if cards cover changes such as a one-year delay, retiring now, no pension, and a 20% market crash.
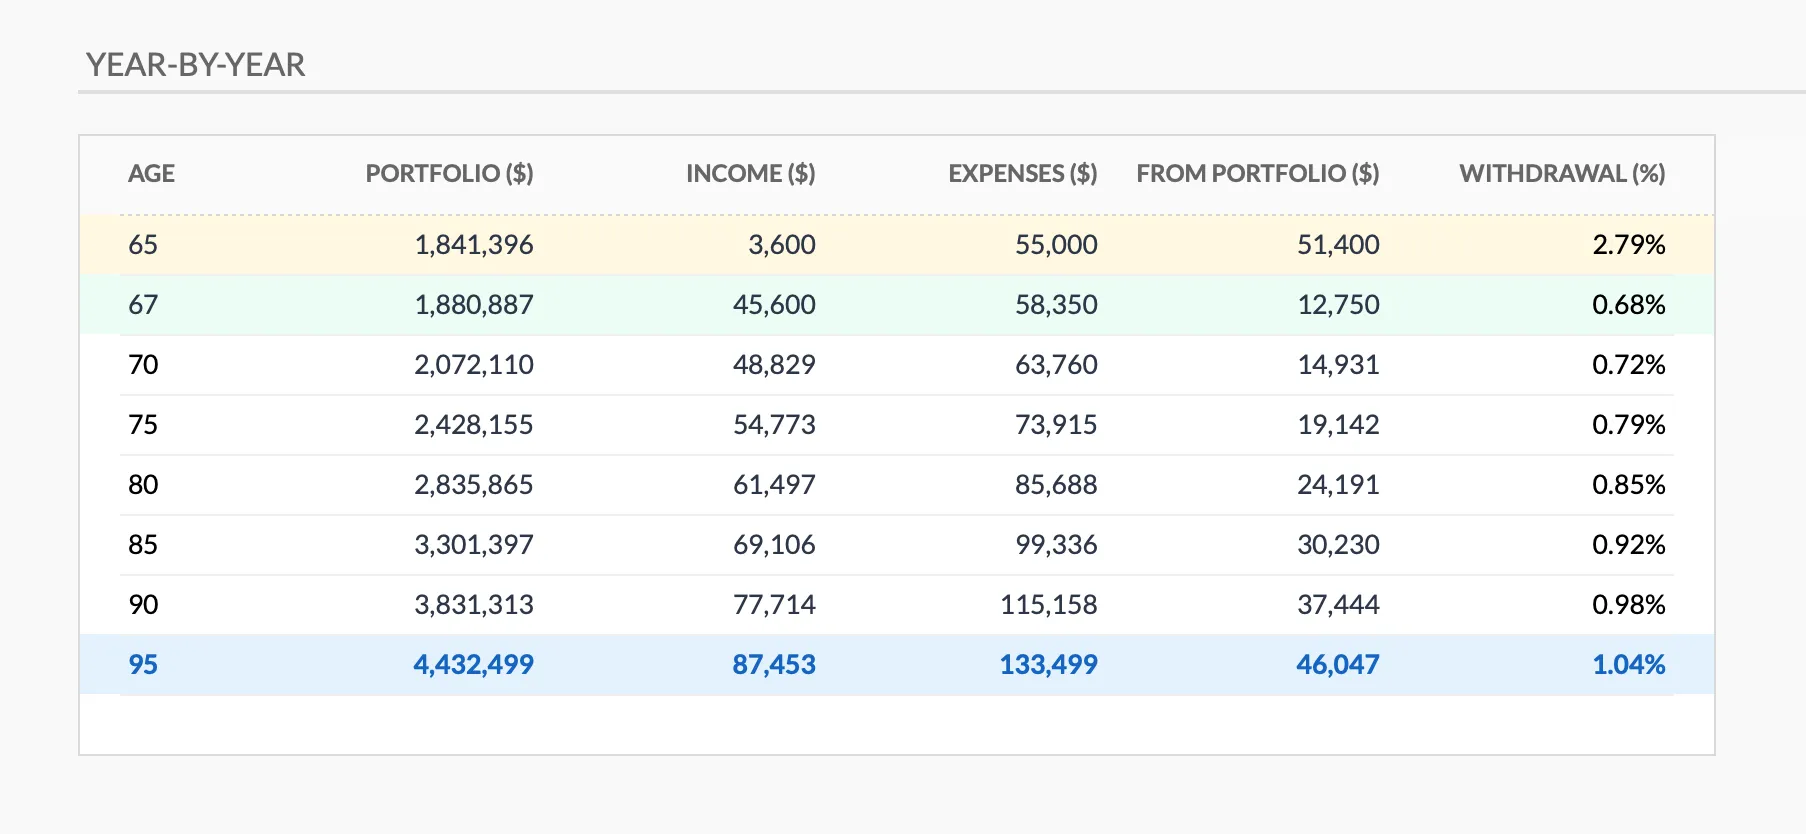
The Retirement Financial Planning & Projections template (Premium) shows how a portfolio, its income, and its withdrawal rate move at key ages through retirement.
Related
- Retirement Financial Planning & Projections Spreadsheet - project the drawdown, withdrawal rate, and three scenarios with your own numbers
- Retirement Calculator - free projection of savings at retirement and the annual income gap
- FIRE Calculator - find your financial independence number and years to reach it
- Best retirement planning software and tools - how spreadsheets compare to the apps
- What financial freedom means and how to get there - the idea behind the FIRE math
- Prepare for Retirement: Your Guide to Financial Freedom - mapping expenses, income, and the gap between them
Frequently asked questions
Is the 4% rule still considered safe?
It remains a common starting point, but it is a historical rule of thumb, not a guarantee. It was built from past U.S. market data and assumes a roughly 50/50 stock and bond mix held for about 30 years. Some analysts argue a lower rate is safer given today's valuations and longer lifespans, while Bengen's own later work suggested the historical data could have supported a slightly higher rate. The honest answer is that the safe number depends on your portfolio, your time horizon, and the returns you actually get.
What is the difference between the 4% rule and FIRE's 25x rule?
They are the same math viewed from two directions. The 4% rule starts with a portfolio and takes 4% out each year. The 25x rule starts with annual spending and multiplies it by 25 to find the portfolio you need, because 1 divided by 0.04 equals 25. Spending $40,000 a year points to a $1,000,000 target either way.
Does the 4% rule account for taxes and investment fees?
No. The 4% figure is a gross withdrawal from the portfolio, not what lands in your bank account. Income tax on withdrawals, fund expense ratios, and advisor fees all come out of that amount, so the spendable total is lower. Where the money sits also matters, since a traditional 401(k), a Roth account, and a taxable brokerage are each taxed differently on withdrawal.
Do target date funds guarantee I will not lose money near retirement?
No. A target date fund shifts toward bonds as the date approaches, but it still holds stocks at and past the target date, so its value can fall. The glide path is designed to reduce volatility over time, not to remove it. Funds also differ in whether they keep adjusting the mix after the target year, which changes how much stock exposure remains.
Sources
- Retirement Age and Benefit Reduction - Social Security Administration
- Delayed Retirement Credits - Social Security Administration
About this article
Social Security claiming figures (a 30% reduction at 62 and a 24% credit at 70, based on a full retirement age of 67) are checked against the Social Security Administration's benefit-reduction and delayed-credit pages. The 4% rule figures reflect the parameters of William Bengen's 1994 study: a portfolio split roughly 50/50 between stocks and bonds over a 30-year horizon. Claims about the Retirement Financial Planning & Projections template were checked on 2026-09-10 against the shipped Google Sheet (Summary, Inputs, Projections, Helpers and Instructions tabs). Last reviewed September 2026.