Cash Flow Forecast
Cash Flow Forecast Template for Tutoring / Education
Forecast session-based revenue, manage instructor costs, track enrollment patterns, and plan for seasonal demand cycles - all in a Google Sheets template built for cash flow management.
In Depth
Academic Calendars and the Cash Flow of Education Businesses
Tutoring and education businesses operate on a financial calendar dictated by the academic year, standardized test schedules, and the rhythms of family life. September brings a surge of new enrollments as the school year begins and parents identify their children's academic needs. This enrollment peak gradually builds through fall, plateaus during winter, and begins declining in spring as the school year winds down. Summer - when many families pause or reduce tutoring - creates a predictable revenue dip that experienced operators learn to plan around.
The economics of group versus individual instruction shape how education businesses grow. A one-on-one tutoring session at $60/hour generates $60 in revenue from one instructor hour. A small group class with six students at $30 each generates $180 from the same instructor hour. The margin difference is substantial, which is why many tutoring businesses actively develop group programs. However, group classes require minimum enrollment to run profitably - a class designed for eight students that only attracts three may generate less net revenue than individual sessions.
Test preparation programs create sub-seasonal revenue peaks tied to specific exam dates. SAT, ACT, AP exam, and professional certification test dates are known years in advance, making these revenue periods highly forecastable. Students typically enroll in prep programs two to three months before their target test date, creating predictable enrollment waves. Some tutoring businesses find that test prep becomes their most profitable service line because it commands premium pricing and lends itself well to group instruction.
The prepaid session package model - common in tutoring - creates favorable cash flow timing but also introduces a liability. When a family pays $550 for a ten-session package, all the cash arrives upfront while the delivery obligation extends over several weeks. This means the business collects cash faster than it delivers services, creating a positive cash flow position. However, unused sessions represent a future service obligation, and a large balance of outstanding session credits is worth monitoring to understand the true financial picture.
The Challenge
Cash Flow Challenges for Tutoring and Education Businesses
Tutoring businesses face strong seasonal demand patterns tied to the academic calendar. Revenue peaks during the school year and drops sharply in summer, while the cost of maintaining qualified instructors is relatively constant.
Revenue follows the academic calendar with steep seasonal swings
Most tutoring businesses see peak demand from September through May, with significant drops during summer break, holiday weeks, and spring break. Test prep (SAT, ACT) creates sub-seasonal peaks in spring and fall. A tutoring center generating $20,000/month during the school year might drop to $8,000-$12,000 in summer. These predictable but significant swings require cash reserves or summer program alternatives.
Student retention and enrollment drive revenue stability
Tutoring revenue depends on active student count and sessions per student per week. Losing 5 students who each attend twice weekly at $60/session means losing $2,400/month. Students drop out for various reasons - perceived improvement, budget constraints, schedule conflicts, or dissatisfaction. Maintaining consistent enrollment requires ongoing marketing and quality delivery, both of which cost money.
Instructor availability and quality directly impact capacity and reputation
Good tutors are the product. Instructor wages typically represent 40-55% of session revenue. Tutors who build strong relationships with students create retention - but they also become a retention risk if they leave. Part-time tutors may have inconsistent availability, while full-time tutors require benefits and guaranteed hours. Balancing instructor capacity with student demand is a constant challenge.
Scaling requires space and staff investment before revenue follows
Growing from a home-based or online operation to a physical center means committing to rent ($2,000-$6,000/month), furniture, technology, and signage before enrollment justifies the cost. The ramp-up period for a new tutoring center is typically 6-12 months before reaching breakeven enrollment. Online-only models avoid facility costs but face different scaling challenges around instructor recruitment and technology platform costs.
Start forecasting your cash flow
Forecasting Guide
How to Forecast Cash Flow for Your Tutoring Business
Tutoring cash flow forecasting starts with active student count, sessions per week, and session pricing. Here is how to structure it using the Cash Flow Forecast template.
Revenue Categories
- Individual tutoring sessions
- Group class and small group revenue
- Test prep course packages
- Online tutoring sessions
- Summer enrichment programs
- Materials and workbook sales
Expense Categories
- Instructor compensation (hourly or per-session)
- Administrative staff wages
- Payroll taxes
- Facility rent and utilities
- Curriculum and materials
- Technology (online platforms, learning software)
- Marketing and student acquisition
- Insurance (general liability, professional)
- Background checks and training
- Office supplies and equipment
- Payment processing fees
Cash Flow Timing
Most tutoring businesses collect payment in advance (packages of sessions or monthly billing). This creates positive cash flow timing - you receive payment before delivering all sessions. However, unused session credits create a liability. The main timing challenge is seasonal: school year revenue must cover summer operating costs unless you develop summer programs. Map enrollment expectations by month and compare against fixed costs to identify deficit months.
See It In Action
What the template looks like
Browse through the template to see dashboards, forecasting, actuals tracking, and scenario planning.
- Visual cash flow dashboard
- Forecast vs actuals comparison
- Scenario planning tools
- Customizable categories

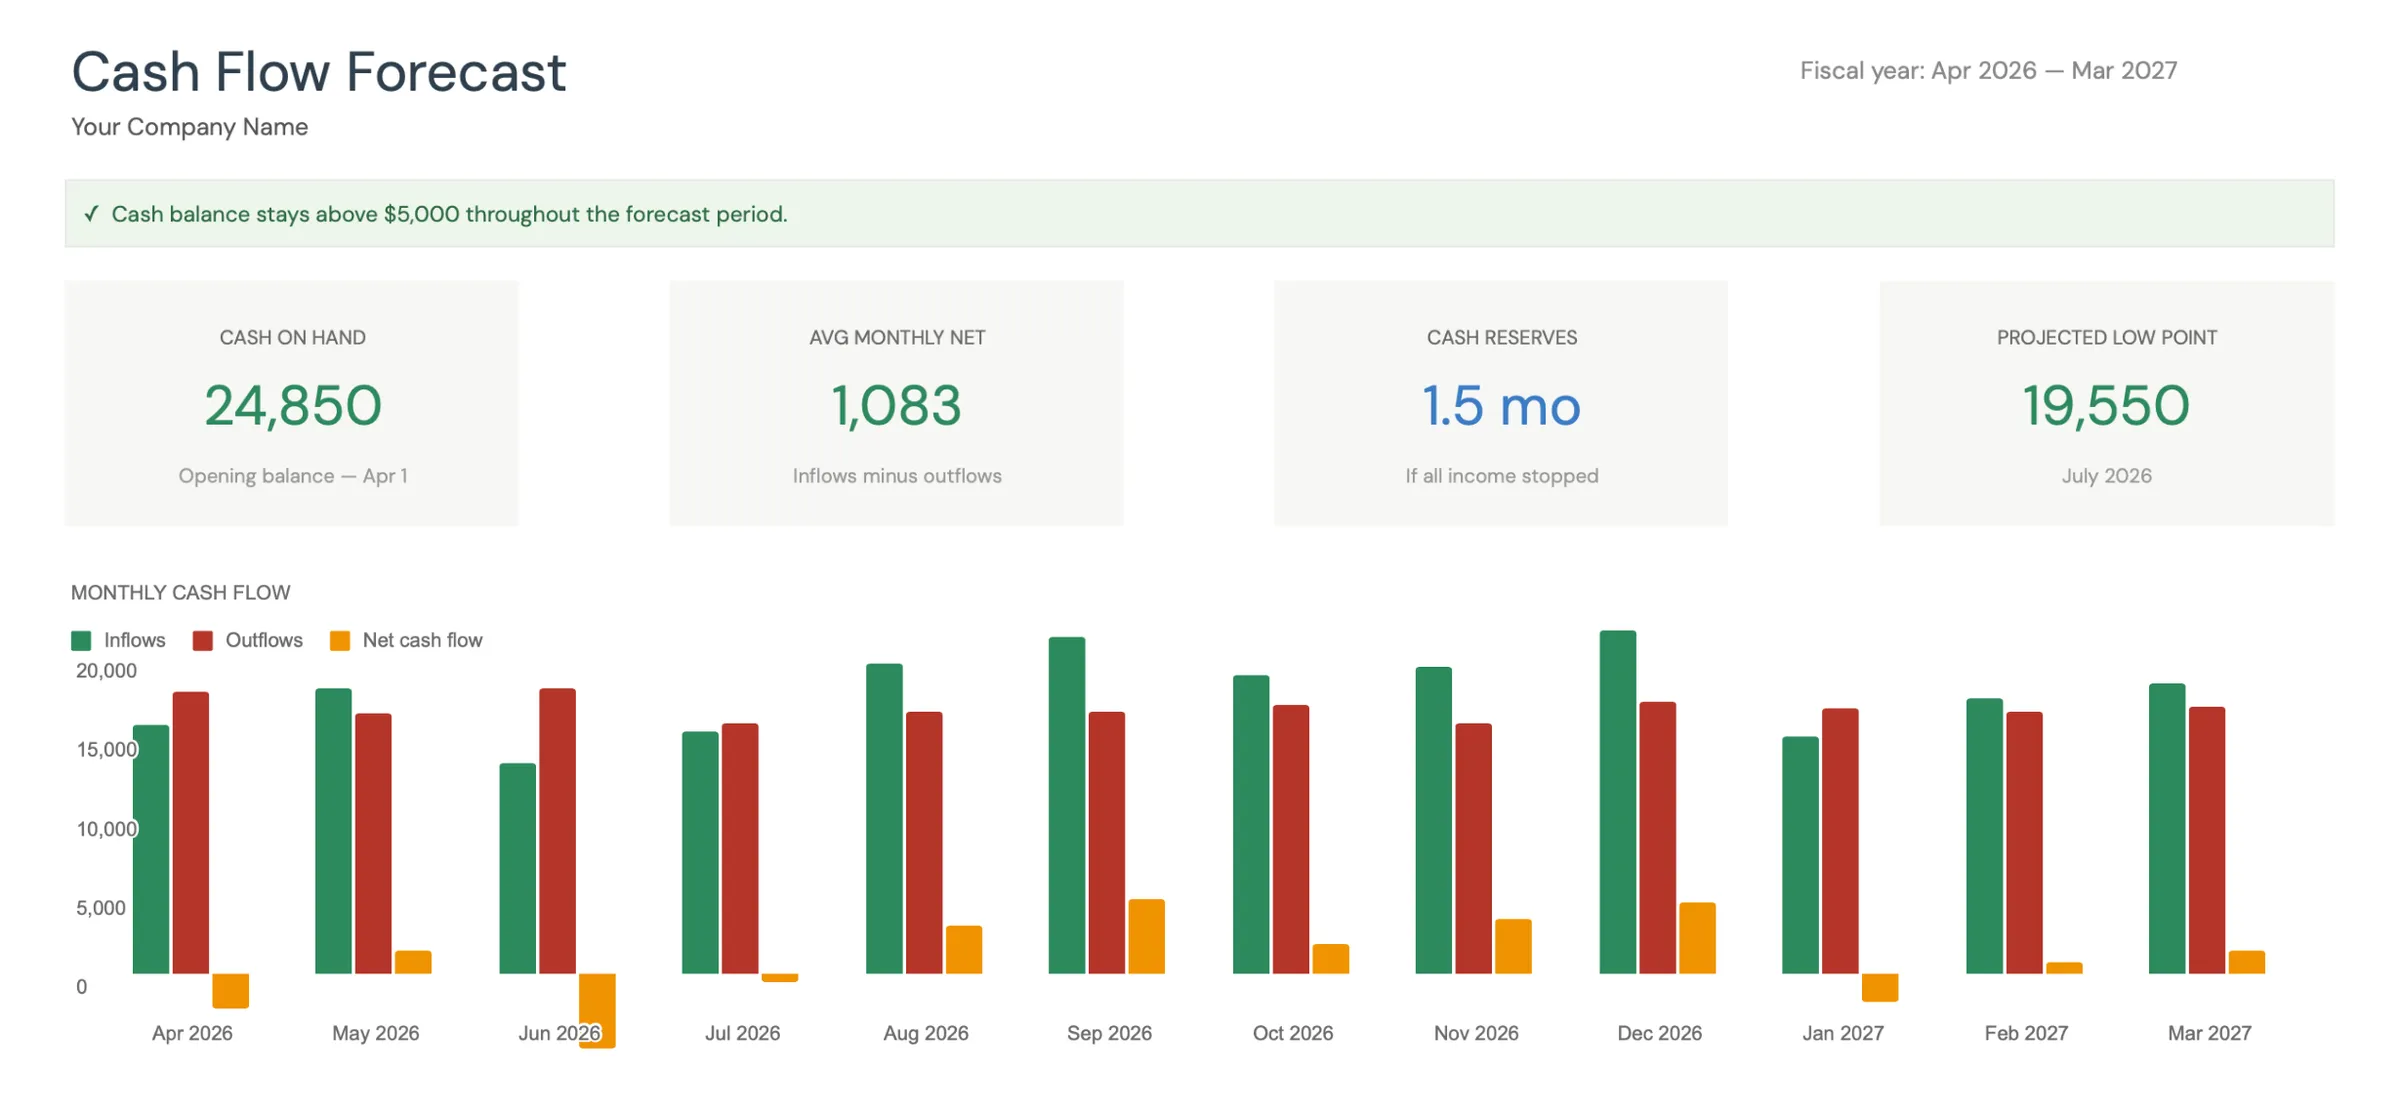
Monthly cash flow overview with KPIs and charts
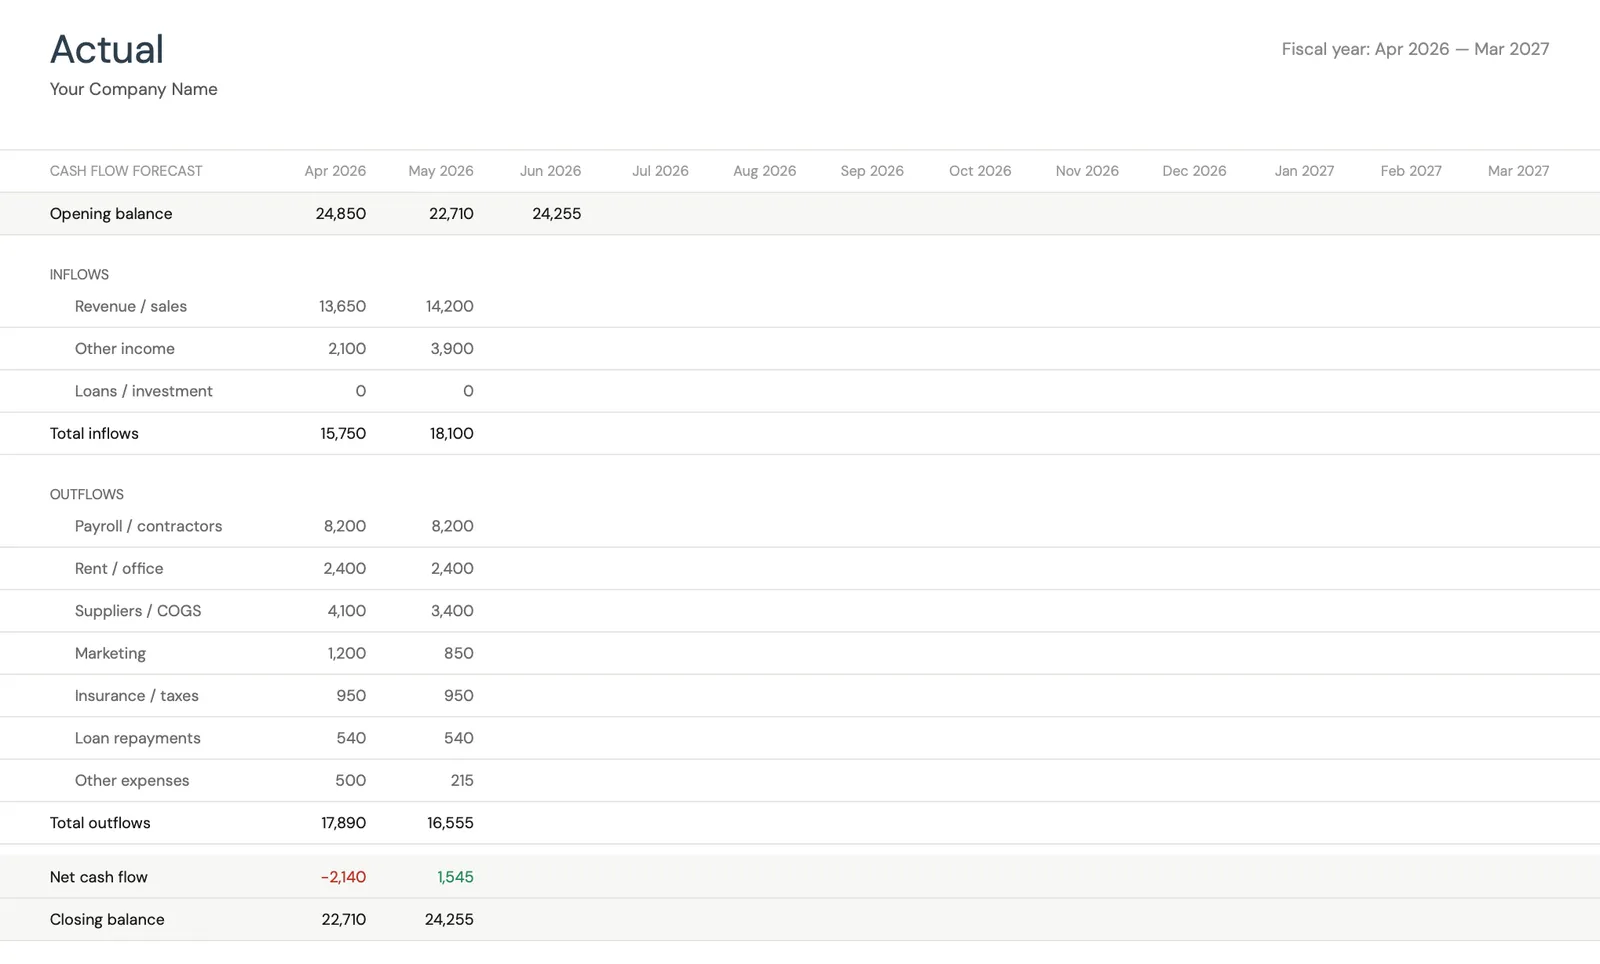
Track actual cash flow against your forecast
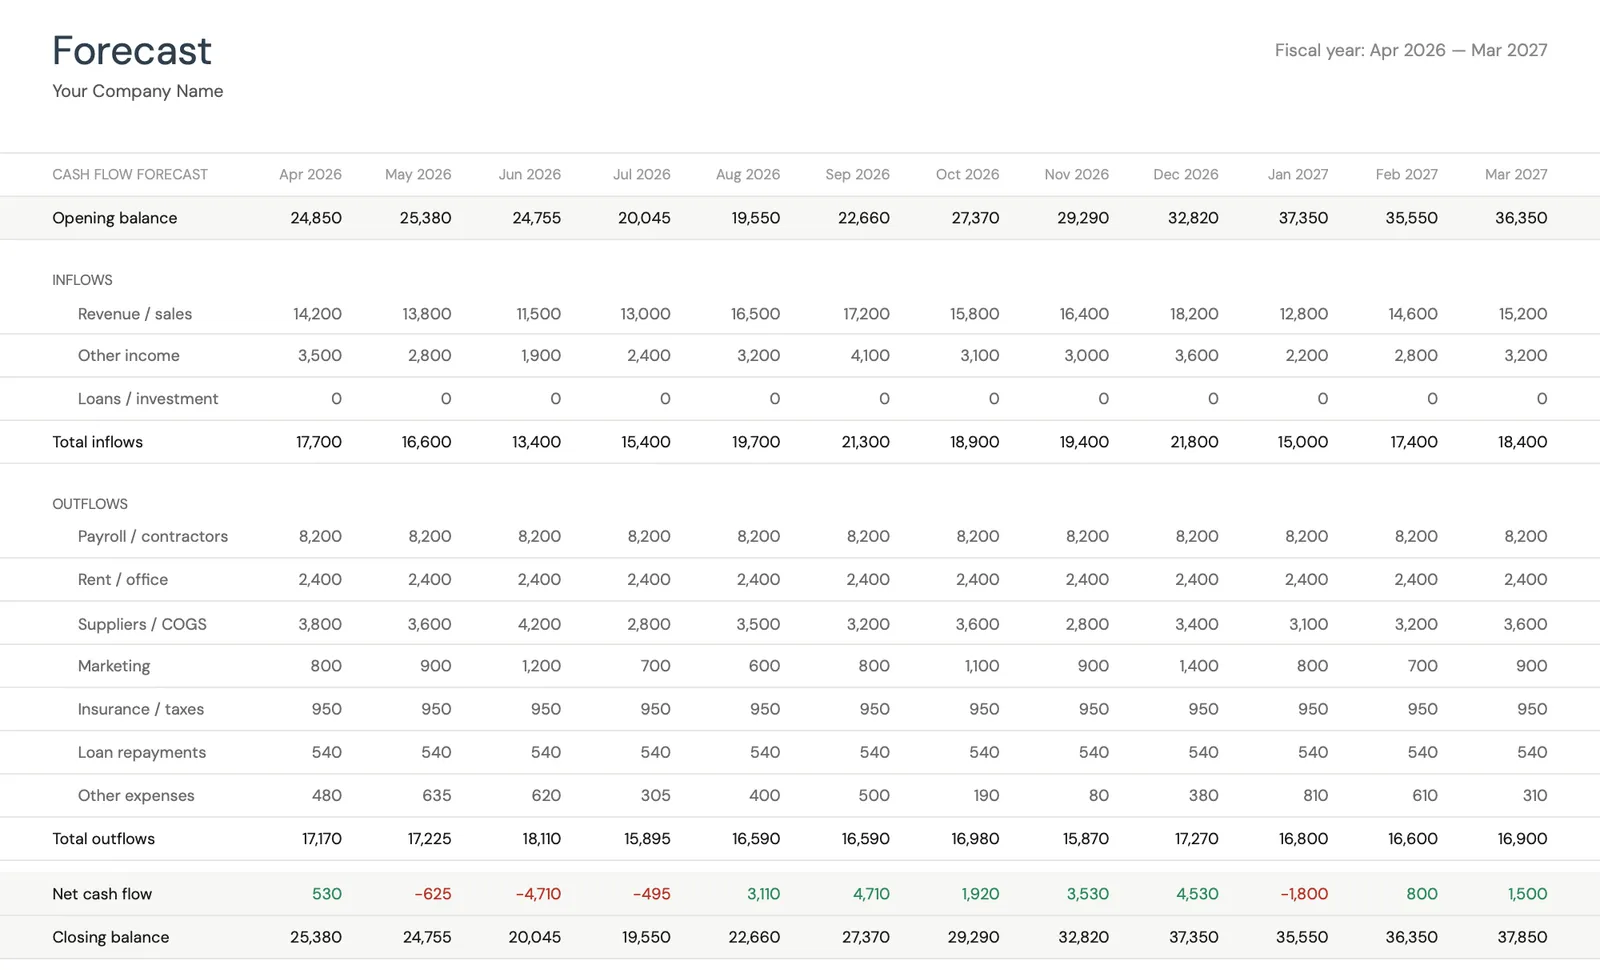
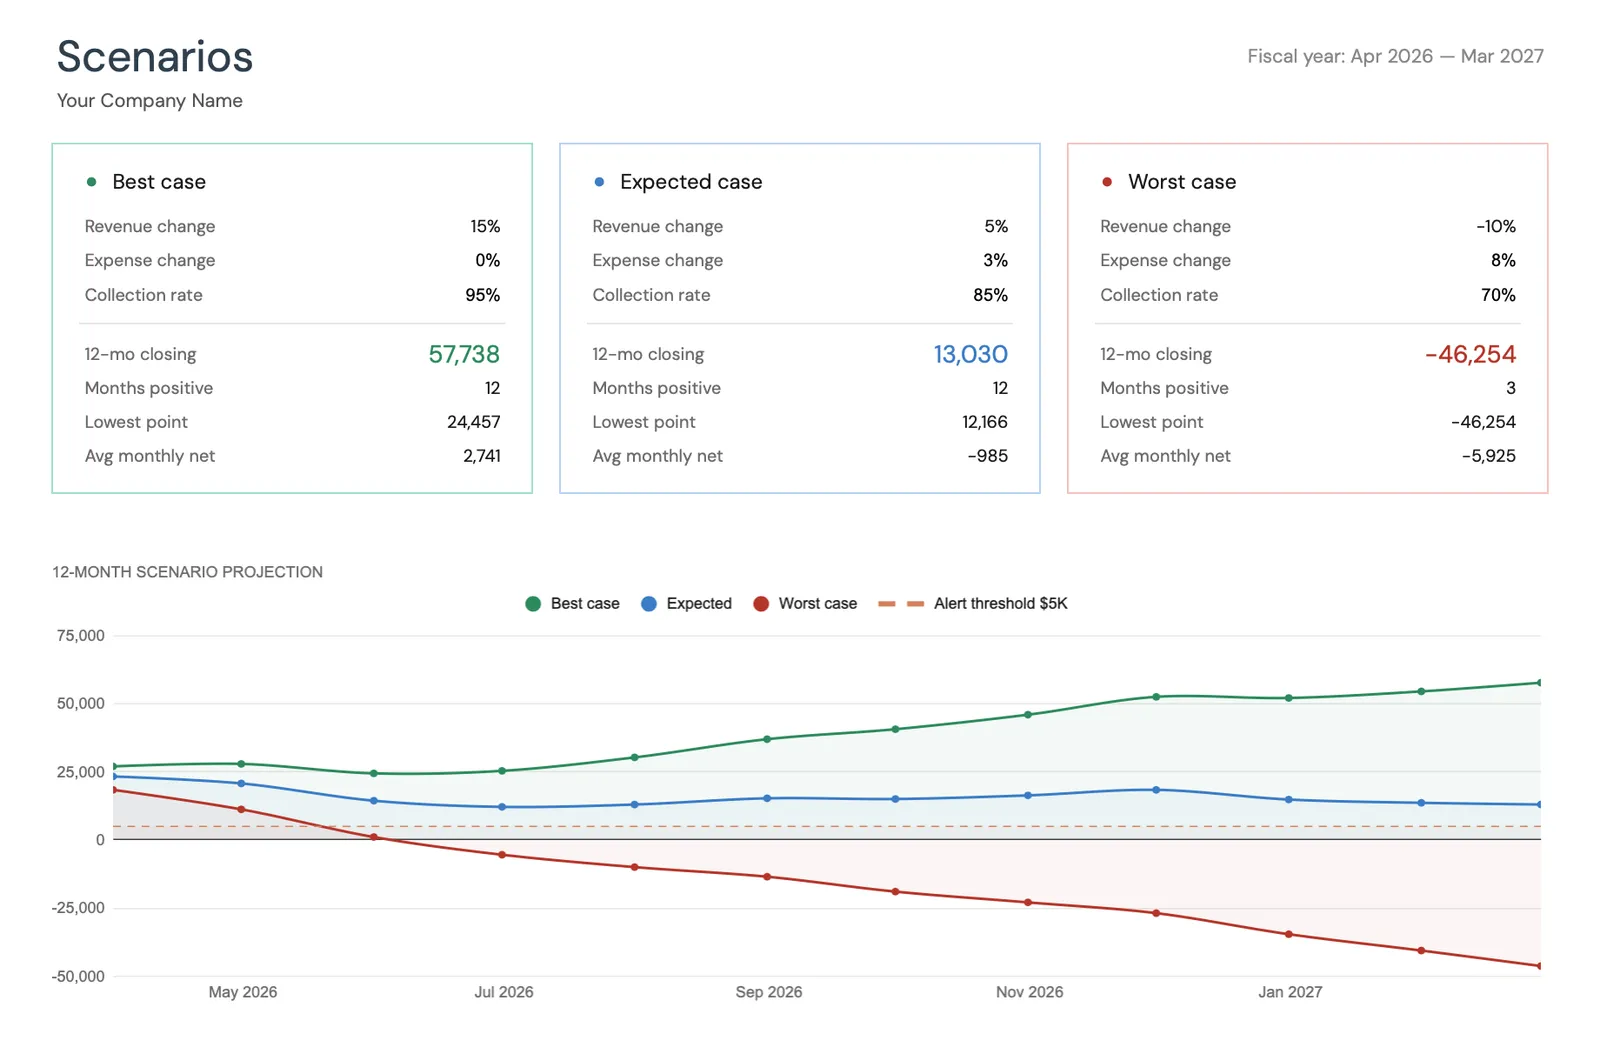
Project cash flow 12 months ahead
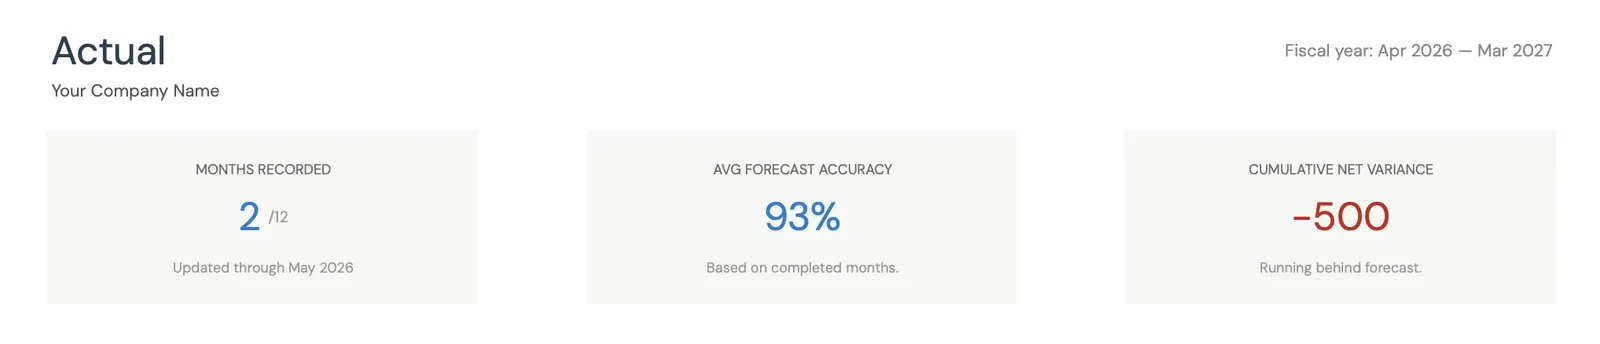
Key performance indicators for your cash flow
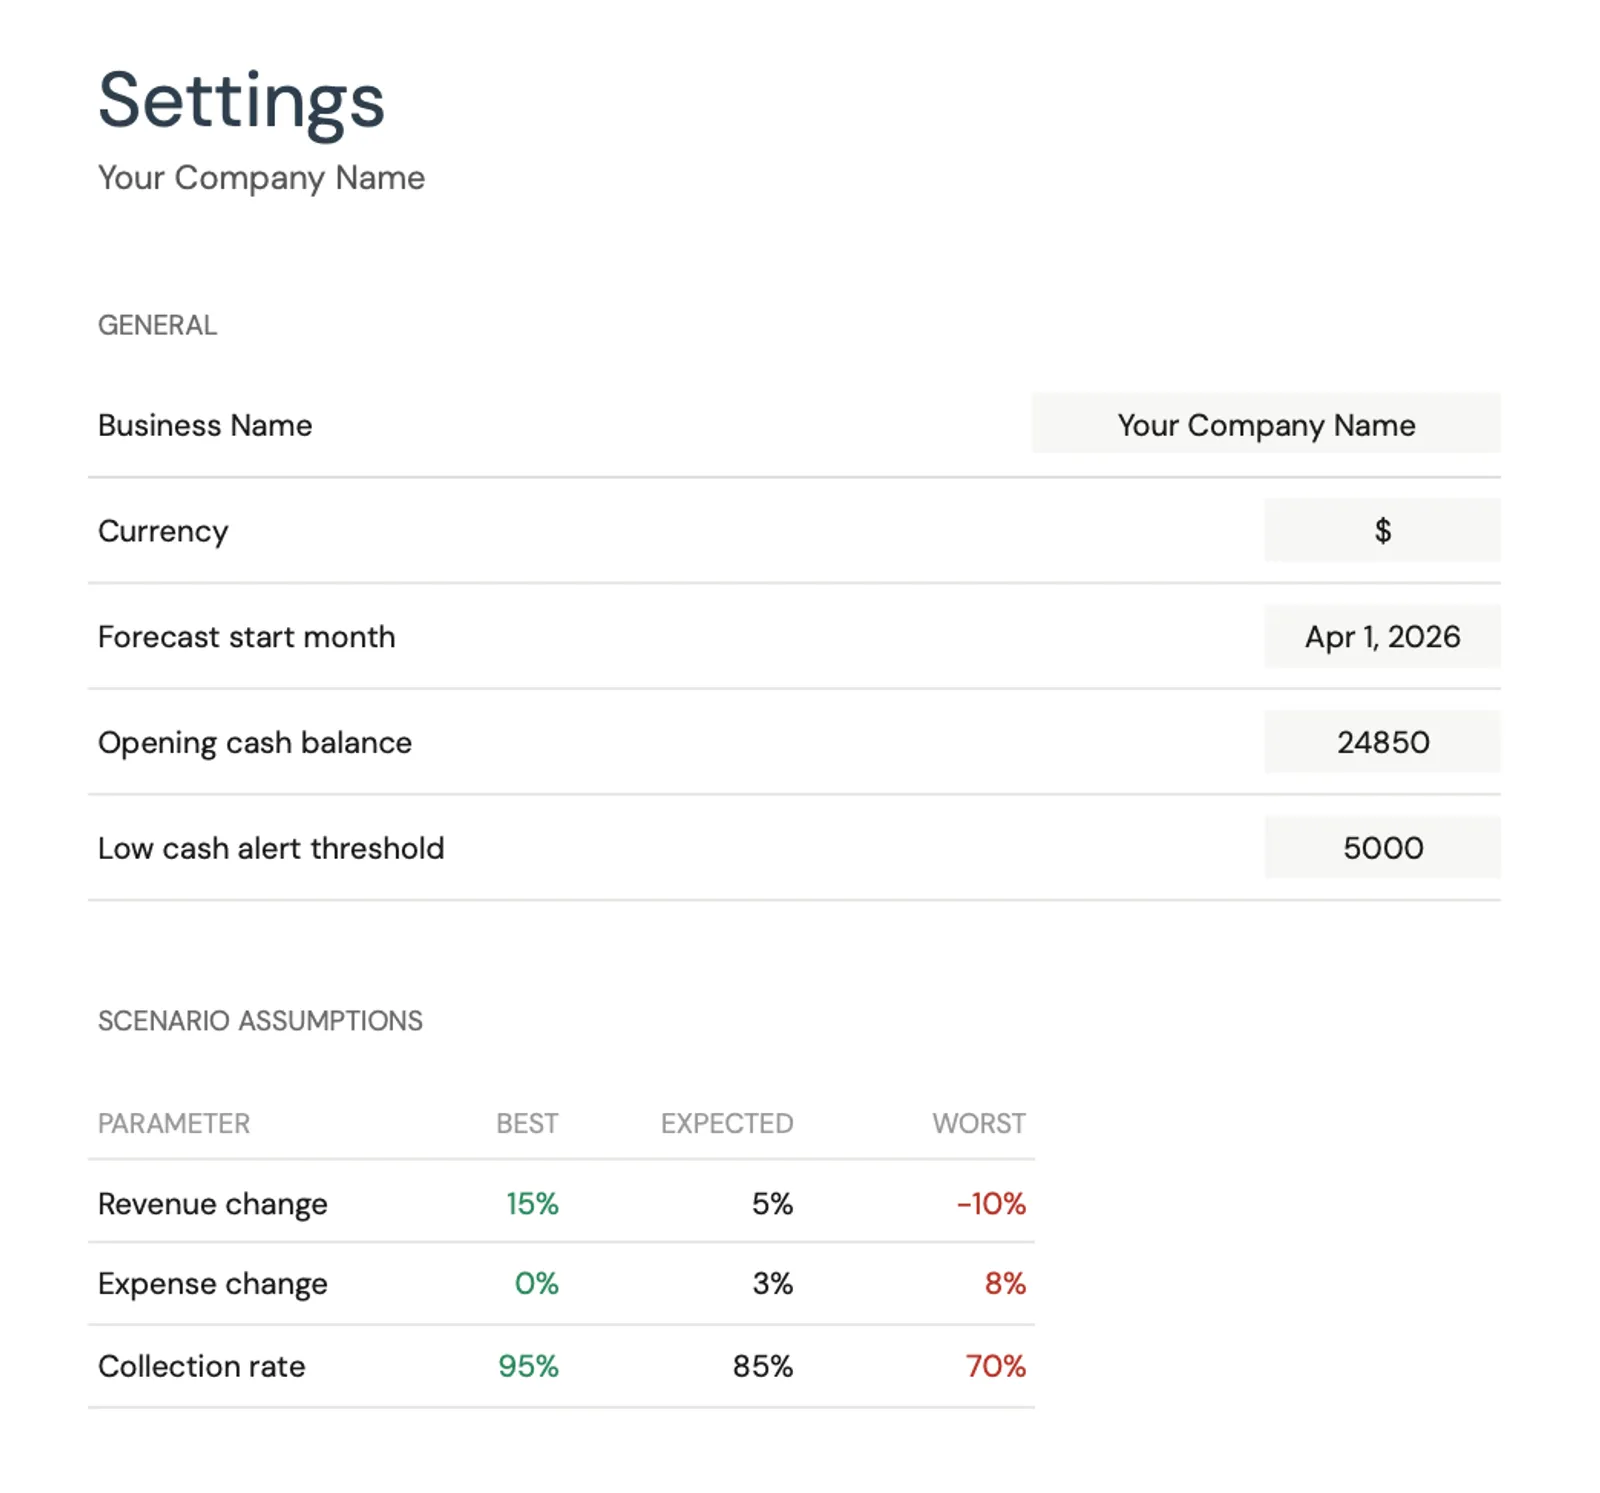
Model different scenarios for your business
Customize categories for your business type
What You Get
What Tutoring and Education Businesses Get With This Template
Enrollment and session tracking
Track active students, weekly session counts, and average revenue per session. These three numbers drive your revenue forecast. Monitoring enrollment trends weekly catches declines before they create significant cash flow problems.
Instructor cost management
Track instructor costs as a percentage of session revenue. If compensation exceeds 55% of revenue, margins may not support overhead costs. The template helps balance competitive instructor pay with sustainable business economics.
Student enrollment actuals vs forecast
Compare projected enrollment, session counts, and revenue against actuals. Tutoring businesses can forecast with reasonable accuracy once they understand their seasonal patterns and student retention rates.
Academic year cash flow projection
See your projected cash position through the full academic cycle. Plan summer programs, marketing campaigns, and expansion investments against your projected cash position.
Common Questions
Cash Flow for Tutoring / Education - FAQ
What profit margin is typical for tutoring businesses?
Net margins for tutoring businesses typically range from 15-30% for center-based operations and 30-50% for online-only or solo tutors. The primary cost driver is instructor compensation (40-55% of revenue). Higher margins come from group sessions (more students per instructor hour), package pricing, and keeping overhead low. Test prep programs often achieve higher margins due to premium pricing.
How do I handle the summer revenue drop?
Calculate the monthly cash flow gap between summer revenue and fixed costs. If school-year revenue is $20,000/month and summer revenue is $10,000/month with $15,000/month in costs, the summer gap is $5,000/month for 2-3 months ($10,000-$15,000 total). Build this reserve during the school year. Some businesses develop summer enrichment, camps, or intensive programs to partially fill the gap.
Should I sell session packages or charge per session?
Package sales (10, 20, or 50 sessions prepaid at a discount) improve cash flow by collecting revenue upfront. A 10-session package at $550 ($55/session vs $60 drop-in) brings $550 immediately rather than $60 per week over 10 weeks. The forecast helps model the cash flow difference between package and per-session billing. Packages also improve student retention through commitment.
When should I consider opening a physical location?
The forecast helps model this transition. If current monthly revenue is $12,000 and a center costs $4,000/month in rent plus $2,000 in additional overhead, you need to grow to at least $18,000/month to maintain current margins. Model the enrollment growth needed to justify the space and the timeline to reach breakeven. Most tutoring centers take 6-12 months to fill to profitable capacity.
How do I forecast test prep revenue?
Test prep follows specific calendars (SAT dates in March, May, August, October, December). Revenue peaks 2-3 months before major test dates as students sign up for prep courses. Use historical enrollment data and test date schedules to forecast course revenue. Group test prep courses often have higher margins (8-12 students per instructor) than individual tutoring.
Can't find the answer you're looking for? Contact our team
Forecast cash flow for your tutoring / education
One-time purchase. No subscription. Your financial data stays in your Google Drive.