Cash Flow Forecast
Cash Flow Forecast Template for Trucking / Logistics
Forecast load revenue, track fuel and maintenance costs, manage broker payment timing, and plan for equipment investments - all in a Google Sheets template built for cash flow management.
In Depth
Fuel, Freight, and the Cash Flow of Trucking
Trucking cash flow is defined by a fundamental timing mismatch - fuel costs hit immediately while load payments arrive 30 to 45 days later. An owner-operator hauling $4,000 loads and burning $1,500 in diesel per trip pays for fuel within days but waits weeks for the broker or shipper to pay. Over the course of a month, this creates a rolling gap where $6,000-$10,000 or more in earned revenue sits in receivables while fuel costs continue accumulating with every mile driven.
Freight rate volatility adds a layer of unpredictability that few other industries experience. Spot market rates can swing 30-40% over the course of a year, driven by seasonal demand, fuel prices, and economic conditions. A lane that pays $3.00 per mile in October might drop to $2.00 per mile in January. For owner-operators and small carriers whose cost per mile stays relatively fixed, these rate swings translate directly into cash flow swings. Contract freight provides more rate stability but typically at lower average rates than the spot market peak.
Maintenance expenses in trucking have a pattern that defies budgeting - long stretches of routine costs followed by sudden, large repairs. Tires, oil changes, and brake adjustments are predictable. But a turbo failure, a DPF issue, or a transmission problem can cost $3,000-$20,000 with little warning. Every day the truck is in the shop means zero revenue with ongoing insurance and payment costs. This combination of unpredictable timing and high stakes makes a maintenance reserve fund one of the more important financial tools a trucking operation can maintain.
Factoring - selling receivables to a third party for immediate payment at a 2-5% discount - is common in trucking precisely because of the cash timing problem. Whether factoring makes financial sense depends on the math of the specific operation. If the alternative to factoring is missing a fuel payment or turning down a profitable load because cash is tied up in receivables, the 3% factoring fee might be a reasonable cost. Many carriers factor selectively, using it during tight periods and collecting directly when cash reserves are healthy.
The Challenge
Cash Flow Challenges for Trucking and Logistics Companies
Trucking is a cash-intensive business where fuel and maintenance costs hit immediately while payment for loads can take weeks. The gap between spending and collecting is the industry's defining cash flow challenge.
Broker and shipper payments lag by 30-45+ days
Most freight brokers pay on net-30 to net-45 terms. You haul a load on Monday, submit paperwork by Wednesday, and wait 4-6 weeks for payment. For an owner-operator running $15,000-$25,000/week in revenue, that means $60,000-$100,000+ is constantly tied up in receivables. Factoring companies offer faster payment (1-3 days) but charge 2-5% of the load value - directly cutting into already-thin margins.
Fuel costs are large, volatile, and immediate
Fuel typically represents 25-35% of trucking revenue. A truck burning 6 MPG averaging 2,500 miles per week at $4.00/gallon spends $1,600-$1,700 weekly on diesel alone. Fuel prices can swing 20-30% in a few months, making cost forecasting difficult. Unlike payment for loads, fuel costs hit immediately - credit cards and fuel cards are due weekly or biweekly. This timing mismatch between fuel payments and load collections is the primary cash flow squeeze.
Truck maintenance and repairs are unpredictable and expensive
A blown tire costs $500. A DPF regeneration issue runs $2,000-$5,000. An engine overhaul can exceed $20,000. These costs are not "if" but "when" - commercial trucks require constant maintenance. Annual maintenance costs typically run $15,000-$25,000 per truck, but the spending is lumpy. A single breakdown can wipe out a month of profit and sideline the truck for days, creating lost revenue on top of the repair cost.
Rate fluctuations affect revenue unpredictably
Freight rates fluctuate with economic conditions, seasonal demand, and market capacity. Spot market rates can swing 20-40% over the course of a year. A lane paying $3.50/mile in October might drop to $2.20/mile in February. Contracted rates provide more stability but are typically renegotiated annually. Forecasting revenue requires assumptions about rate trends and lane availability that can shift quickly.
Start forecasting your cash flow
Forecasting Guide
How to Forecast Cash Flow for Your Trucking Business
Trucking cash flow forecasting centers on the per-mile economics and the timing gap between expenses and collections. Here is how to structure it using the Cash Flow Forecast template.
Revenue Categories
- Load revenue (contract lanes)
- Spot market loads
- Fuel surcharge revenue
- Accessorial charges (detention, layover)
- Dedicated route contracts
Expense Categories
- Fuel (diesel)
- Truck payment or lease
- Insurance (liability, cargo, physical damage)
- Maintenance and repairs
- Tires
- Driver pay (if not owner-operator)
- ELD and telematics subscriptions
- Permits and licensing (IFTA, IRP, UCR)
- Factoring fees (if applicable)
- Tolls and scales
- Trailer lease or payment
- Accounting and compliance costs
Cash Flow Timing
Trucking cash flow timing is defined by the gap between paying for fuel (immediately) and collecting for loads (30-45 days). If you run $20,000/week in loads and pay $6,000/week in fuel, you need working capital to bridge a 4-6 week collection cycle. That is $24,000-$36,000 in fuel costs paid before the corresponding load revenue arrives. Factor in maintenance reserves and the working capital requirement grows further. Factoring can bridge this gap but reduces margins.
See It In Action
What the template looks like
Browse through the template to see dashboards, forecasting, actuals tracking, and scenario planning.
- Visual cash flow dashboard
- Forecast vs actuals comparison
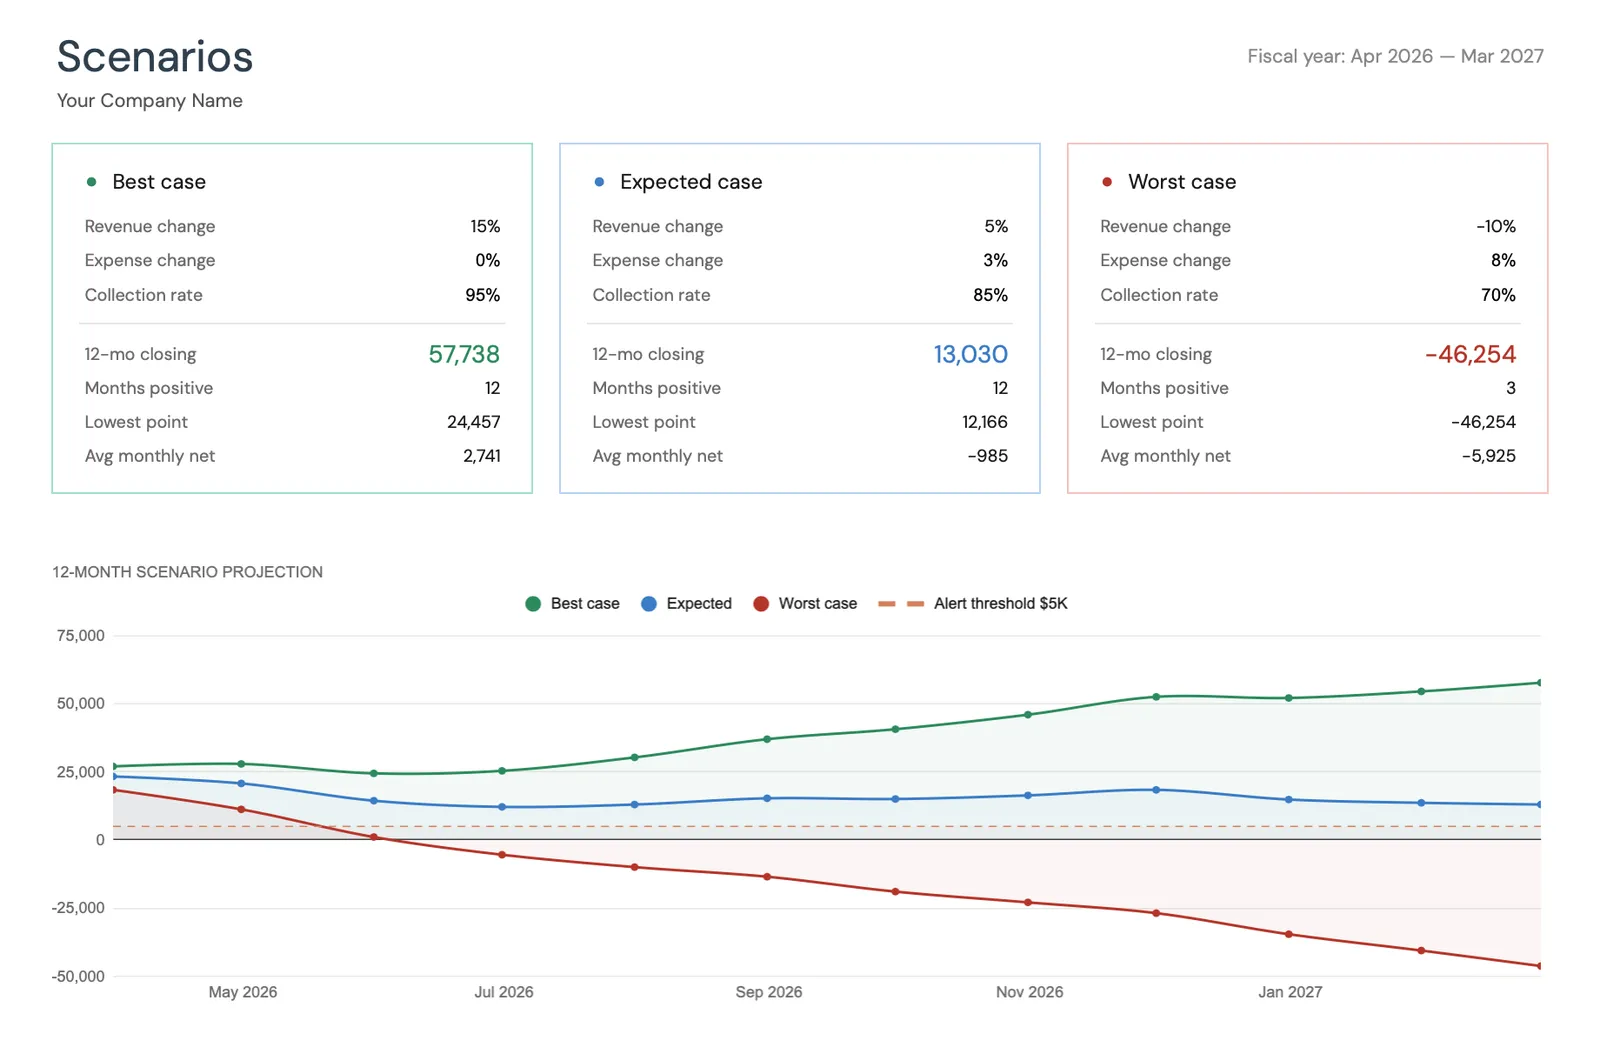
- Scenario planning tools
- Customizable categories

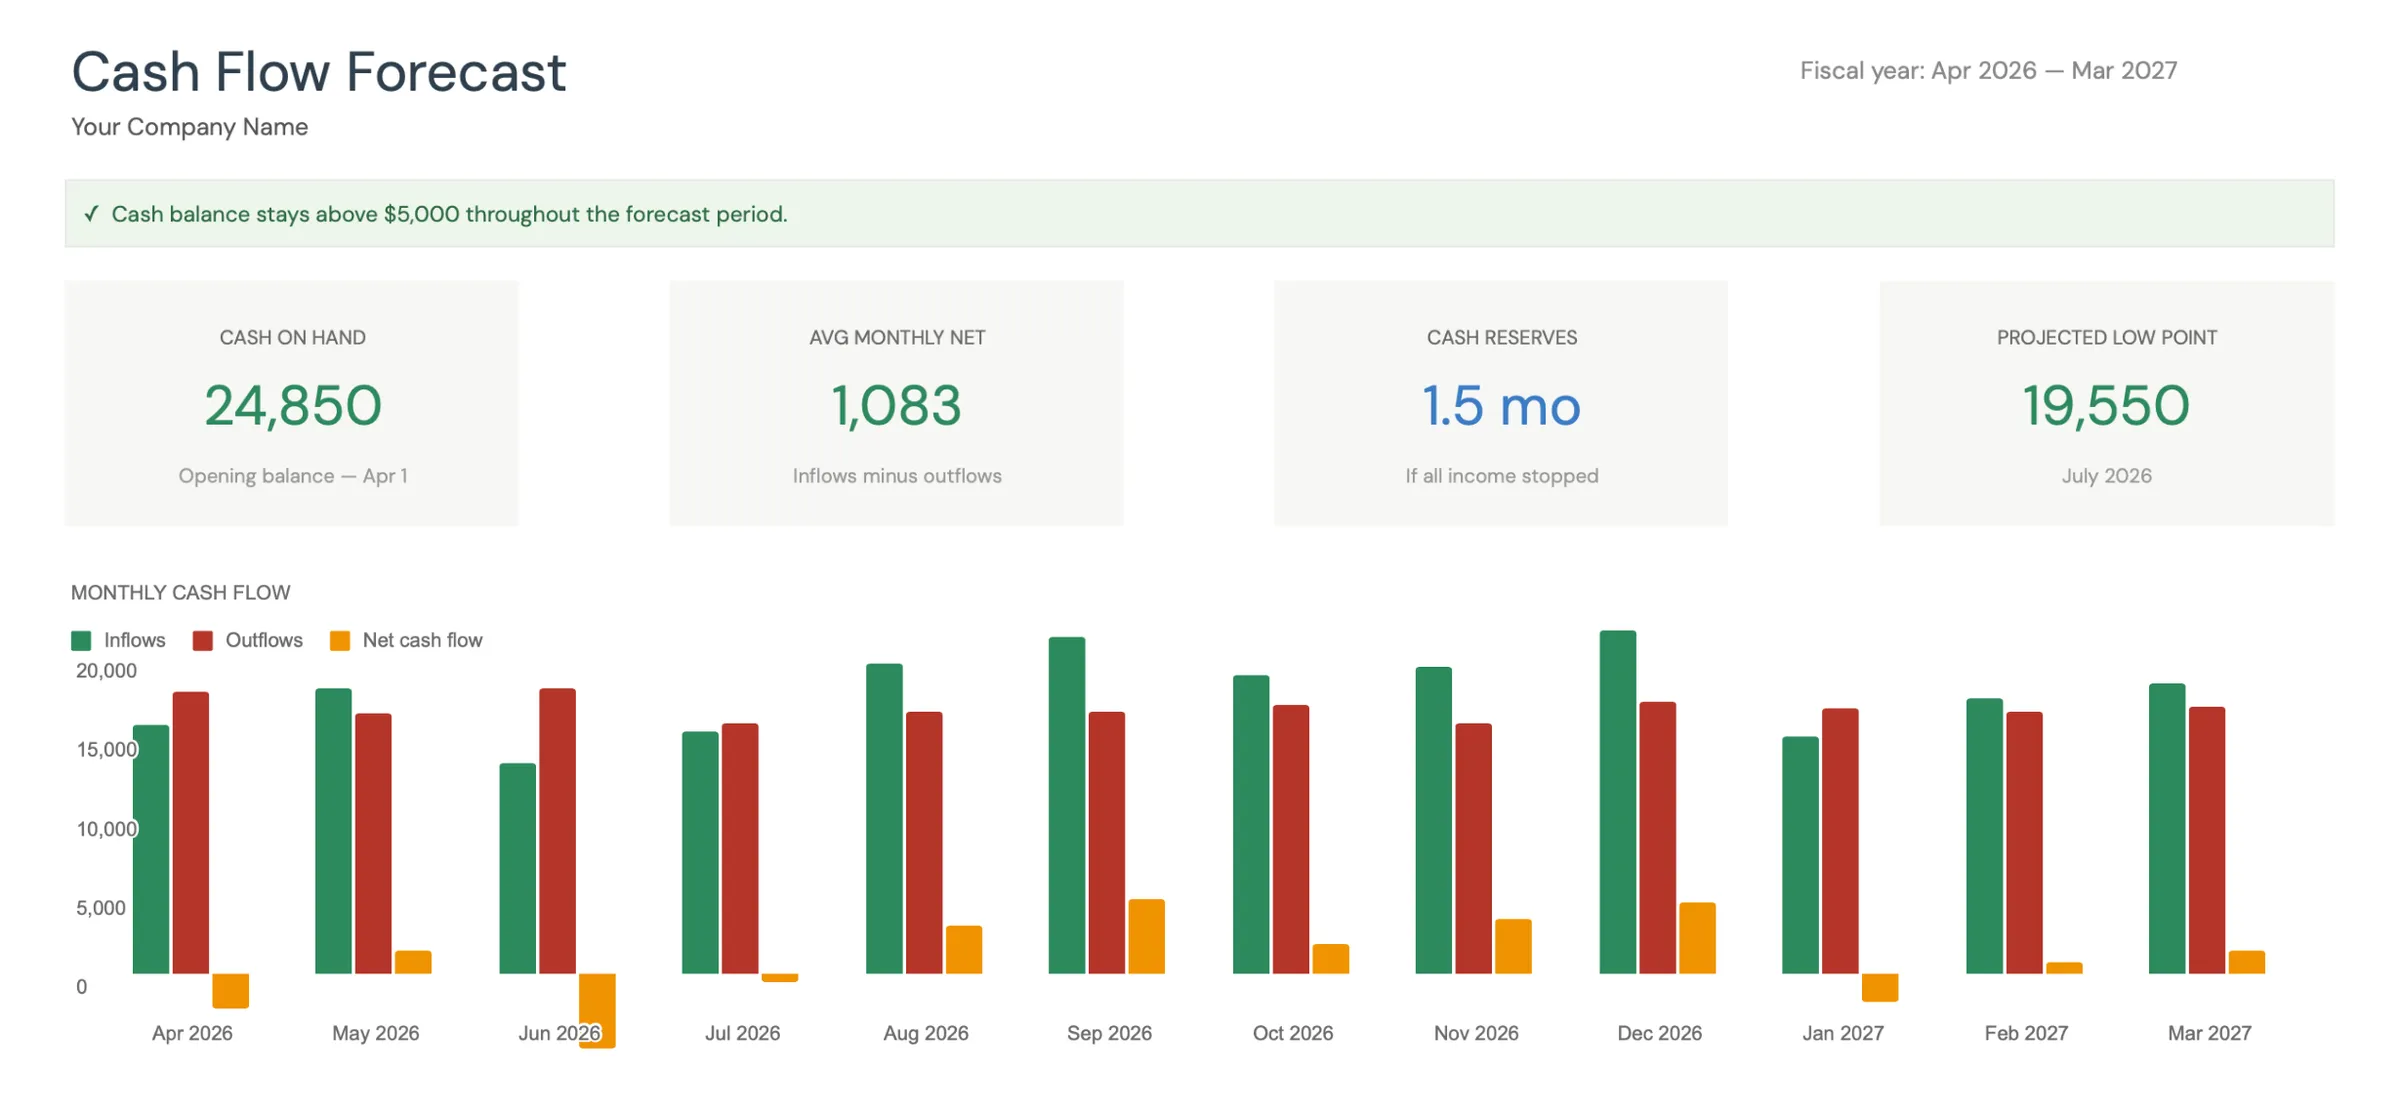
Monthly cash flow overview with KPIs and charts
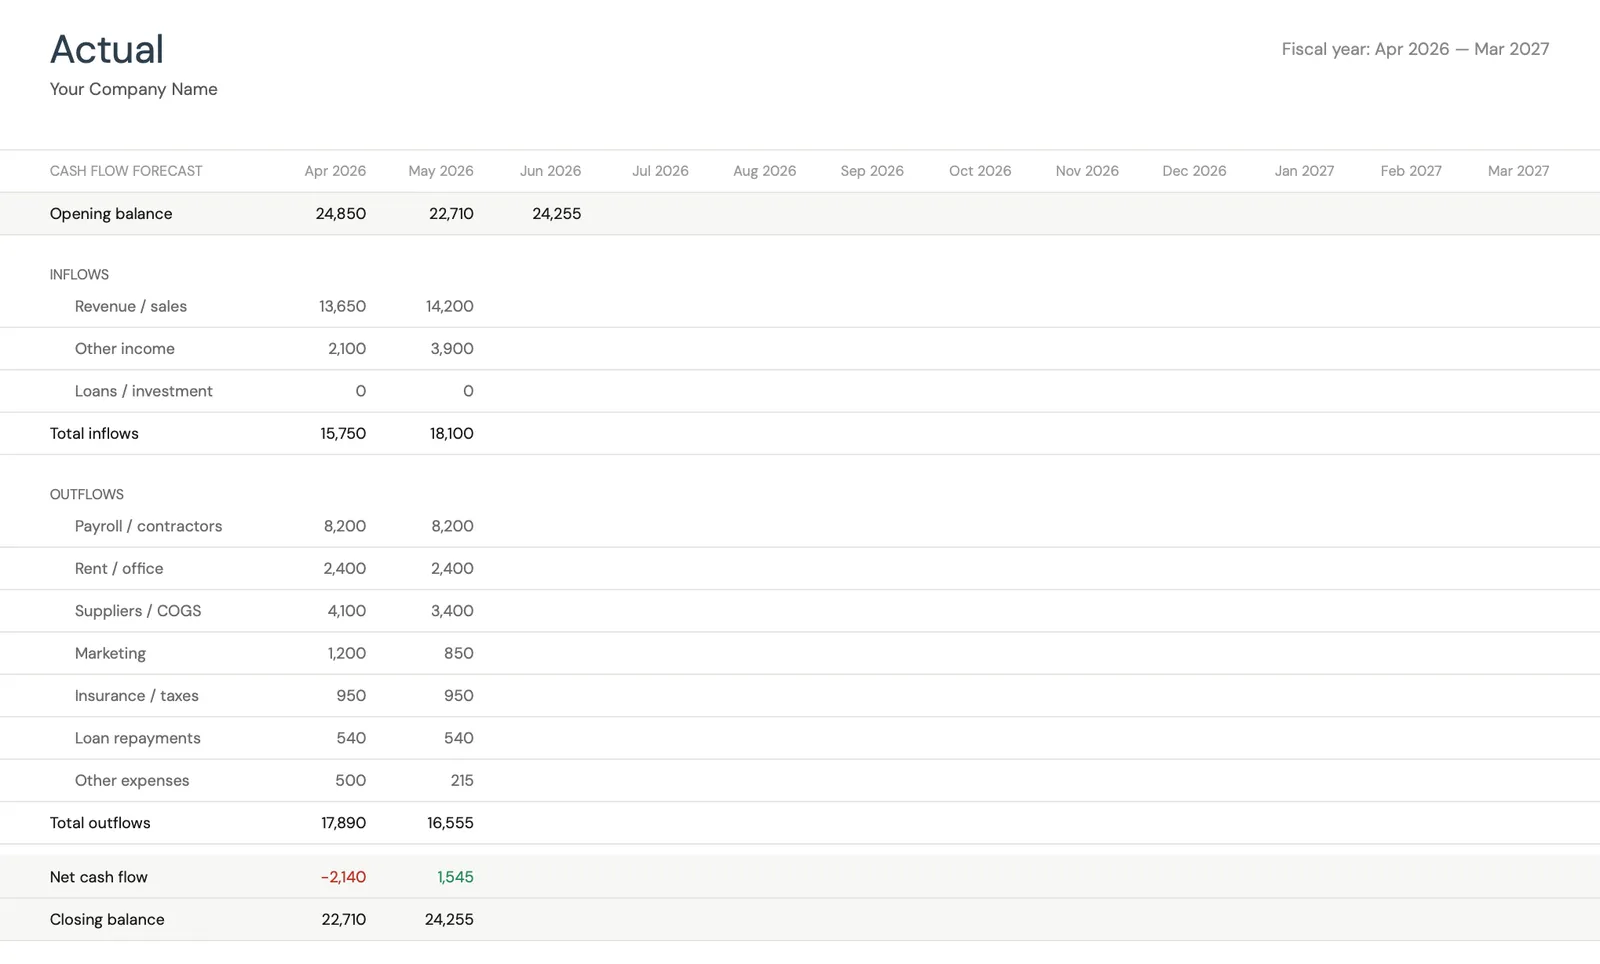
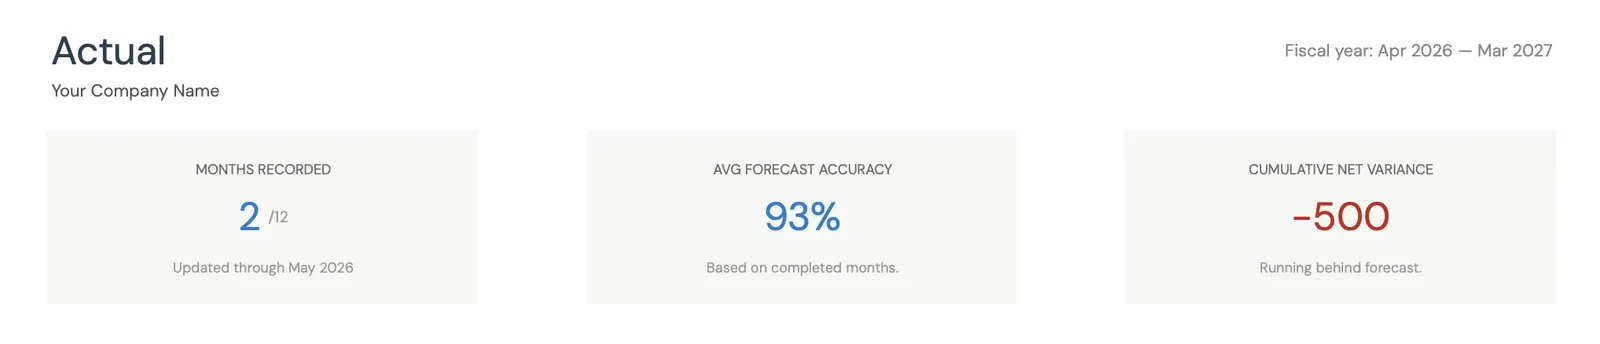
Track actual cash flow against your forecast
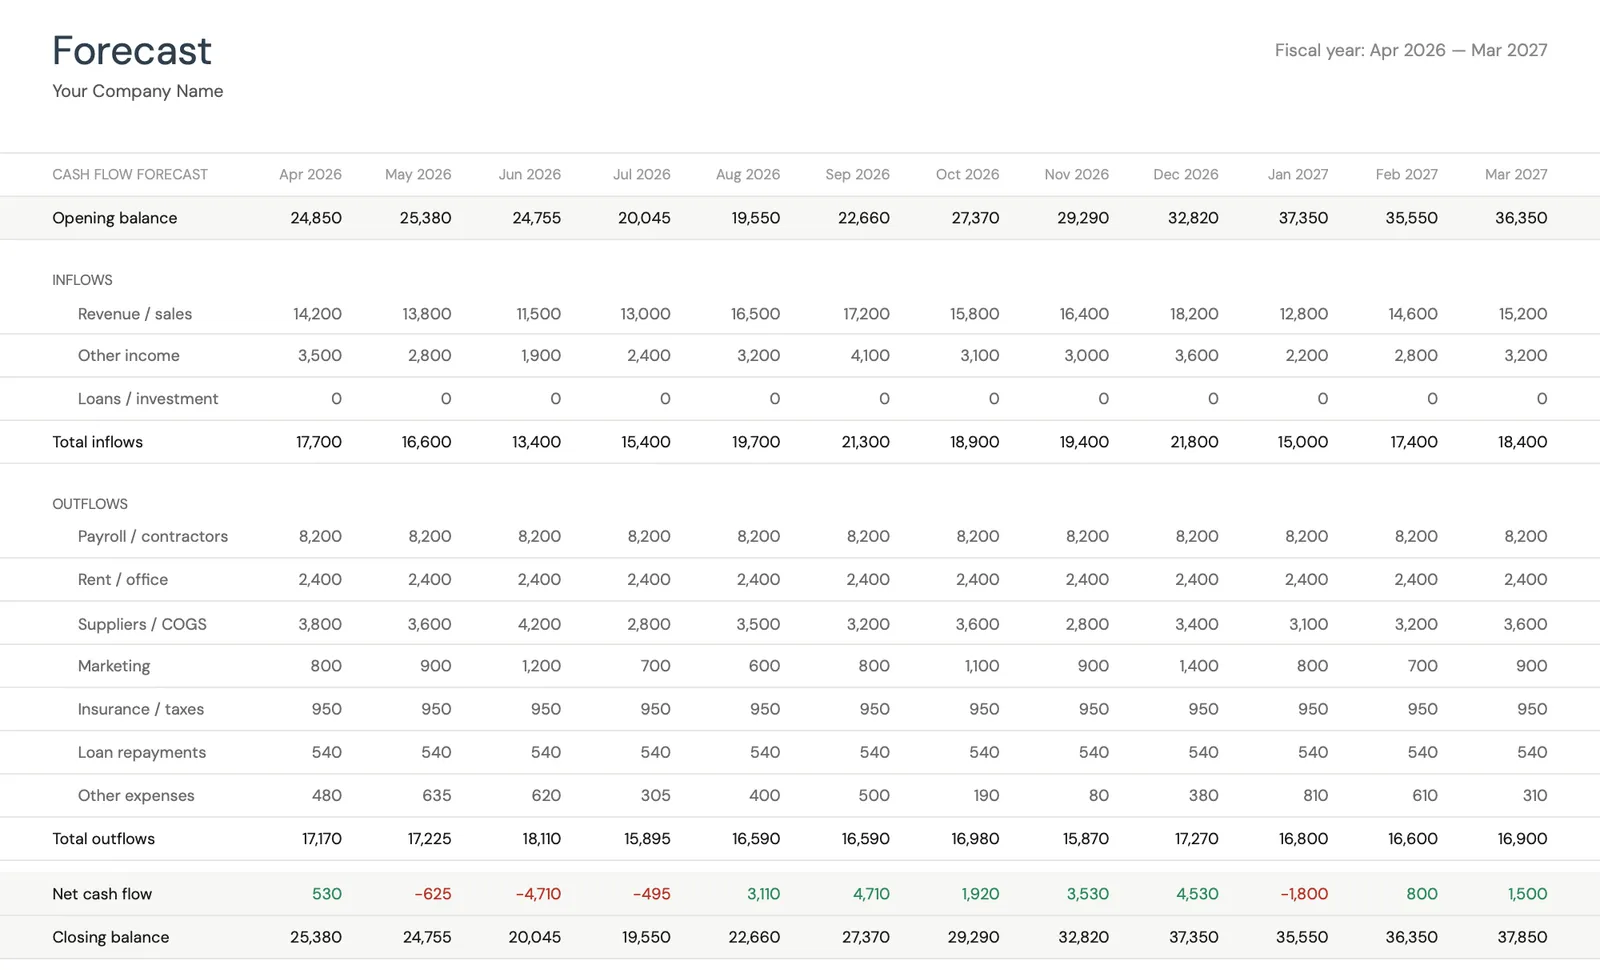
Project cash flow 12 months ahead
Key performance indicators for your cash flow
Model different scenarios for your business
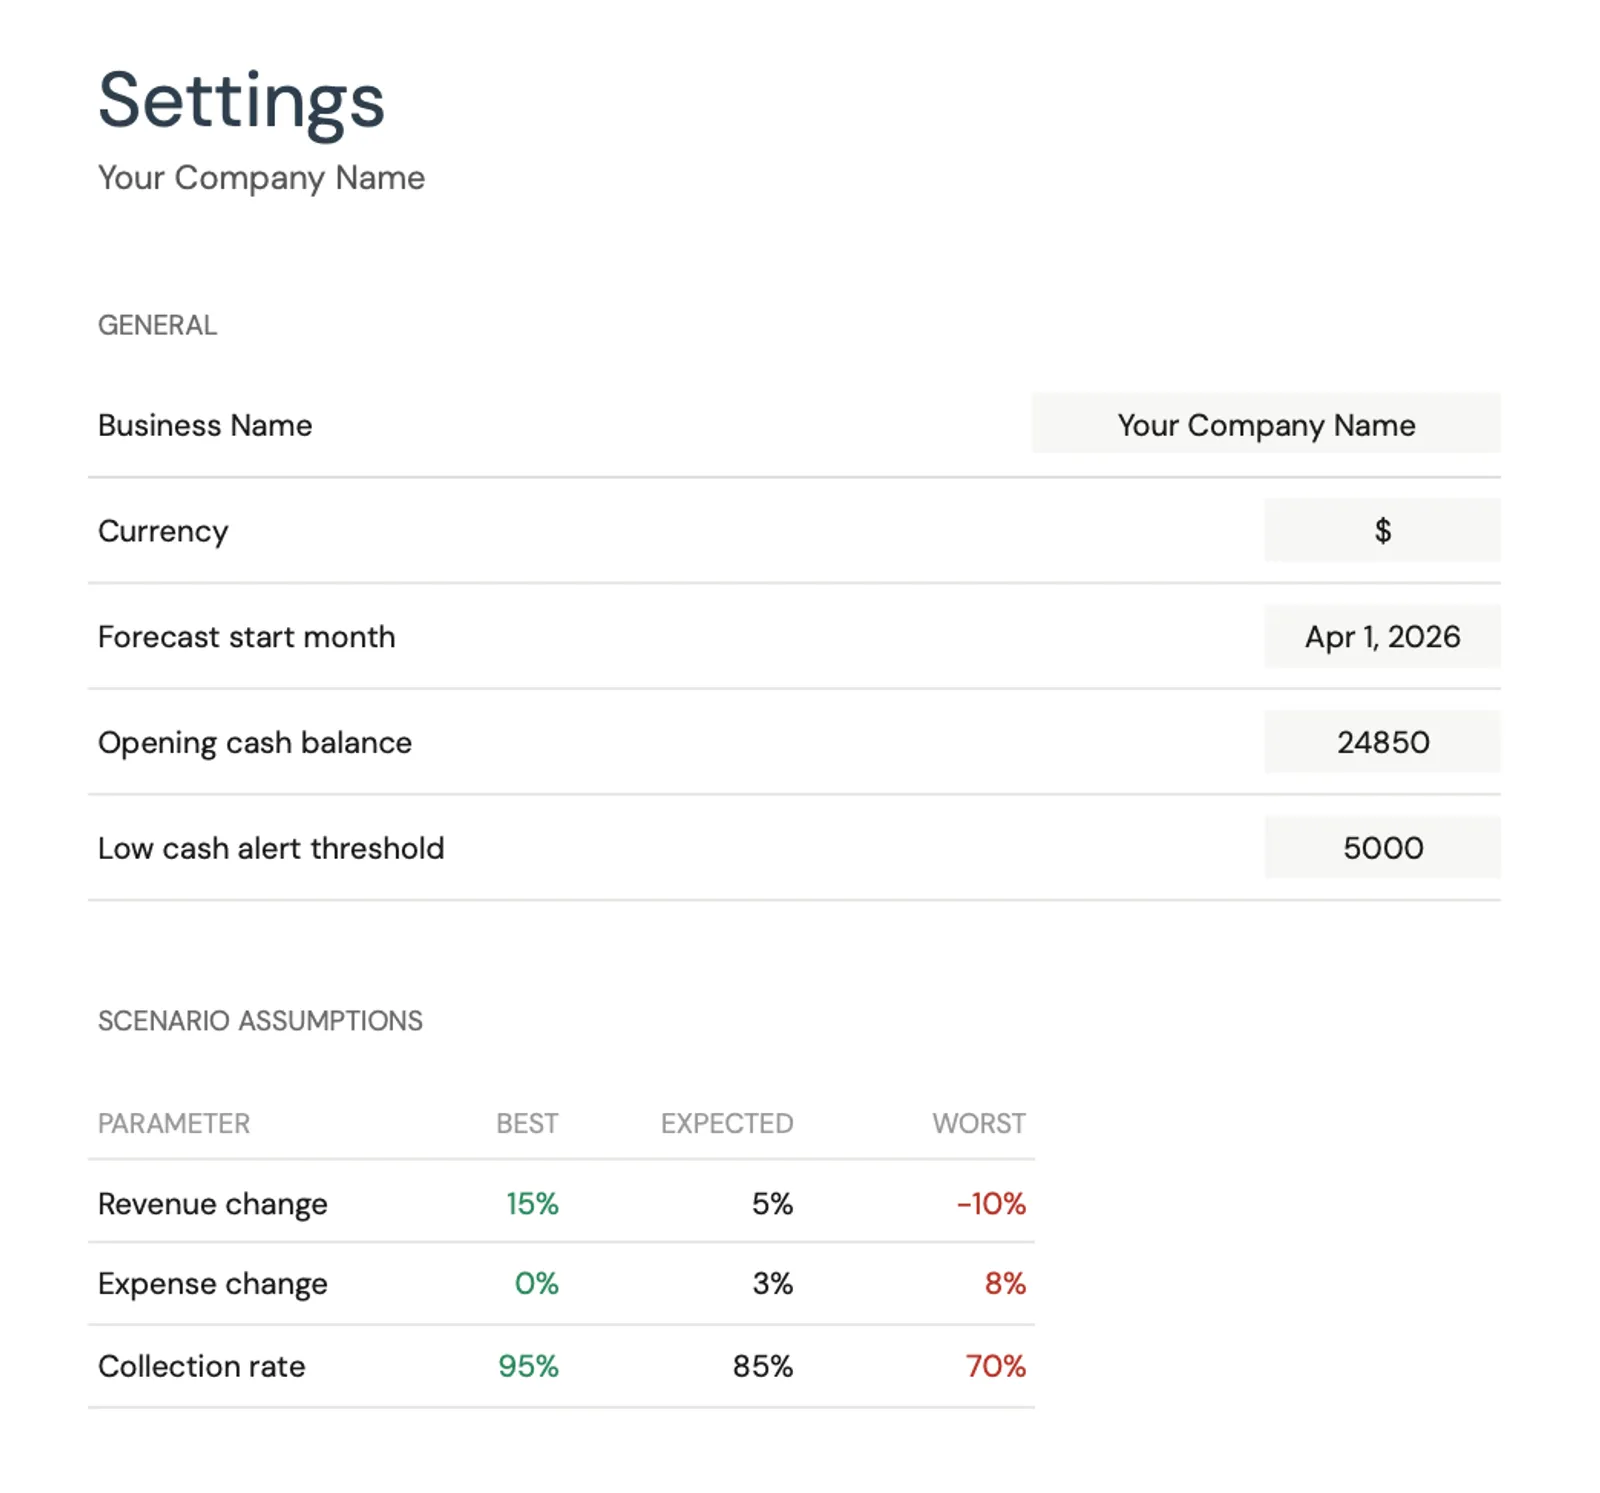
Customize categories for your business type
What You Get
Trucking and Logistics Tools Inside the Template
Load revenue and cost-per-mile tracking
Track revenue per load and calculate your all-in cost per mile (fuel + maintenance + insurance + truck payment). The difference between revenue per mile and cost per mile is your margin - and the forecast shows whether that margin generates enough cash to cover operating needs.
Fuel cost monitoring
Track fuel costs as a percentage of revenue and in absolute terms. When fuel prices spike, the forecast immediately shows the cash impact and helps determine whether fuel surcharges are keeping pace.
Per-mile actuals against your forecast
Compare projected load revenue, fuel costs, and maintenance against actuals. Trucking data is highly measurable - miles driven, fuel consumed, loads completed. Use this data to build increasingly accurate forecasts.
12-month freight cycle cash projection
See your projected cash position across seasonal freight cycles. Plan truck purchases, maintenance schedules, and cash reserves around projected strong and weak freight months.
Common Questions
Cash Flow for Trucking / Logistics - FAQ
What profit margin is typical for trucking companies?
Net margins for trucking companies typically range from 3-8% for asset-based carriers and 10-20% for owner-operators (before considering their own labor as a cost). The industry standard cost-per-mile metric helps track profitability: if your all-in cost is $1.85/mile and you average $2.30/mile in revenue, your margin is about 20% of revenue. Fuel price changes can quickly compress or expand these margins.
Should I use factoring for my receivables?
Factoring provides cash in 1-3 days versus 30-45 days but typically costs 2-5% of the invoice amount. On a $3,000 load, that is $60-$150. The cash flow forecast helps you calculate whether factoring makes sense: if the cost of factoring is less than the cost of borrowing working capital (or the cost of missing expenses due to cash gaps), it may be worthwhile. Many new carriers factor initially and transition to direct billing as cash reserves build.
How much should I reserve for truck maintenance?
A common guideline is $0.10-$0.15 per mile driven, deposited into a maintenance reserve fund. At 10,000 miles per month, that is $1,000-$1,500/month set aside. This builds a fund to cover both routine maintenance and unexpected major repairs without disrupting operating cash flow. The forecast should show this reserve as a regular monthly expense.
How do I handle seasonal freight rate changes?
Freight rates typically peak in late Q3 and early Q4 (produce season and holiday shipping) and dip in January-February. Model your revenue per mile using seasonal adjustments based on historical data or published rate indices. A conservative approach: forecast at current rates for the next quarter and use historical seasonal adjustment factors for quarters further out.
Can this template handle a multi-truck operation?
Yes. Track total fleet revenue and expenses for an overall cash flow view. For detailed analysis, set up per-truck revenue and cost tracking to identify which units are profitable and which are underperforming. The fleet-level view drives the cash flow forecast while per-truck data informs operational decisions.
Can't find the answer you're looking for? Contact our team
Forecast cash flow for your trucking / logistic
One-time purchase. No subscription. Your financial data stays in your Google Drive.