Cash Flow Forecast
Cash Flow Forecast Template for Restaurants
Forecast revenue, track food costs, manage staffing expenses, and plan for seasonal fluctuations - all in a Google Sheets template built for cash flow management.
In Depth
The Financial Rhythm of Running a Restaurant
Restaurants operate to a beat that few other businesses share. There is the daily rhythm of prep, service, and cleanup. There is the weekly rhythm of slow Tuesdays building to packed Fridays. And there is the annual rhythm of holiday rushes, summer surges, and the quiet stretches of January. Each of these cycles layers onto your cash flow in ways that monthly financial statements tend to flatten out.
Food cost percentage is one of those numbers that reveals more about a restaurant than almost any other metric. It captures purchasing discipline, menu design, waste management, and pricing strategy in a single figure. When that number creeps up - even by two or three points - it usually signals something worth investigating. Some operators track it weekly, which tends to surface problems before they compound into something larger.
The relationship between labor scheduling and revenue forecasting is where many restaurants find the most room for improvement. Overstaffing a slow night or understaffing a busy one both erode margins, just in different ways. One approach is building staffing templates around day-of-week revenue patterns rather than relying on gut feel. Over time, the data tends to tell a clearer story than memory does.
Cash flow in restaurants also has a texture that varies by concept. A quick-service operation collecting cash and cards daily looks very different from a fine-dining spot running event deposits and large-party billings. A restaurant with a strong catering side business might see lumpy mid-week revenue that smooths out what would otherwise be a slow period. Understanding which pattern your restaurant follows is the starting point for useful forecasting.
The Challenge
Cash Flow Challenges for Restaurants
Restaurants operate on thin margins with complex cash flow dynamics. Revenue is daily and variable, while many costs are fixed and due on specific dates. Understanding these patterns is the first step to managing them.
Revenue fluctuates daily and seasonally
A Friday dinner service might generate $4,500 while a Tuesday lunch brings in $800. Multiply that variance across weeks, seasons, and local events, and predicting revenue becomes genuinely difficult. Summer tourist areas peak from June through August. College-town restaurants empty out during breaks. Holiday periods can be feast or famine depending on your location and concept. Forecasting requires looking at historical patterns - not just monthly averages, but day-of-week and seasonal trends.
Food costs are volatile and unforgiving
Food cost typically runs 28-35% of revenue for a well-managed restaurant. But ingredient prices fluctuate with supply chains, seasons, and market conditions. A tomato shortage can spike your costs overnight. Protein prices shift with commodity markets. And food waste directly erodes margins - every plate thrown out is pure loss. Tracking actual food cost percentage weekly (not monthly) catches problems before they compound.
Labor is your largest controllable expense
Staff costs (including payroll taxes, benefits, and workers' comp) typically consume 25-35% of revenue. The challenge: you schedule staff days before you know actual revenue. Overstaffing on a slow night burns cash. Understaffing on a busy night loses revenue and damages service quality. Accurate cash flow forecasting depends on aligning labor costs with projected revenue - which means your forecast needs to be granular enough to inform scheduling decisions.
Cash timing creates crunch points
Vendors often require payment within 7-14 days. Rent is due on the first. Payroll happens weekly or biweekly. But a significant portion of revenue arrives via credit cards, which take 2-3 business days to settle. During the gap between paying suppliers and receiving card settlements, cash can get tight - especially around the first of the month when rent hits. A cash flow forecast that tracks weekly (not just monthly) reveals these crunch points before they become crises.
Start forecasting your cash flow
Forecasting Guide
How to Forecast Cash Flow for Your Restaurant
Effective restaurant cash flow forecasting combines historical data with forward-looking assumptions. Here's how to structure it using the Cash Flow Forecast template.
Revenue Categories
- Dine-in revenue (weekday vs weekend, lunch vs dinner)
- Takeout and delivery revenue
- Catering and private events
- Bar and beverage sales
- Gift card sales and redemptions
- Third-party delivery platform revenue (after commissions)
Expense Categories
- Food and beverage costs (Cost of Goods Sold)
- Labor - hourly staff (BOH and FOH)
- Labor - salaried management
- Payroll taxes and benefits
- Rent and CAM charges
- Utilities (gas, electric, water - restaurant utility costs are 3-5x residential)
- Equipment leases and maintenance
- Smallwares and supplies (disposables, cleaning, paper goods)
- Technology (POS system, online ordering, reservation platform)
- Marketing and promotions
- Insurance (general liability, liquor liability, workers' comp)
- Licenses and permits (liquor, health, business)
- Pest control and waste removal
- Loan payments (equipment, buildout, SBA)
Cash Flow Timing
Restaurant cash flow is best forecast weekly, not monthly. The difference between "first week of the month" (rent due, slow post-holiday period) and "last week of the month" (payday spending boost, no rent payment) can be the difference between positive and negative cash flow. Map your major expense due dates onto a weekly calendar and compare against projected weekly revenue.
See It In Action
What the template looks like
Browse through the template to see dashboards, forecasting, actuals tracking, and scenario planning.
- Visual cash flow dashboard
- Forecast vs actuals comparison
- Scenario planning tools
- Customizable categories

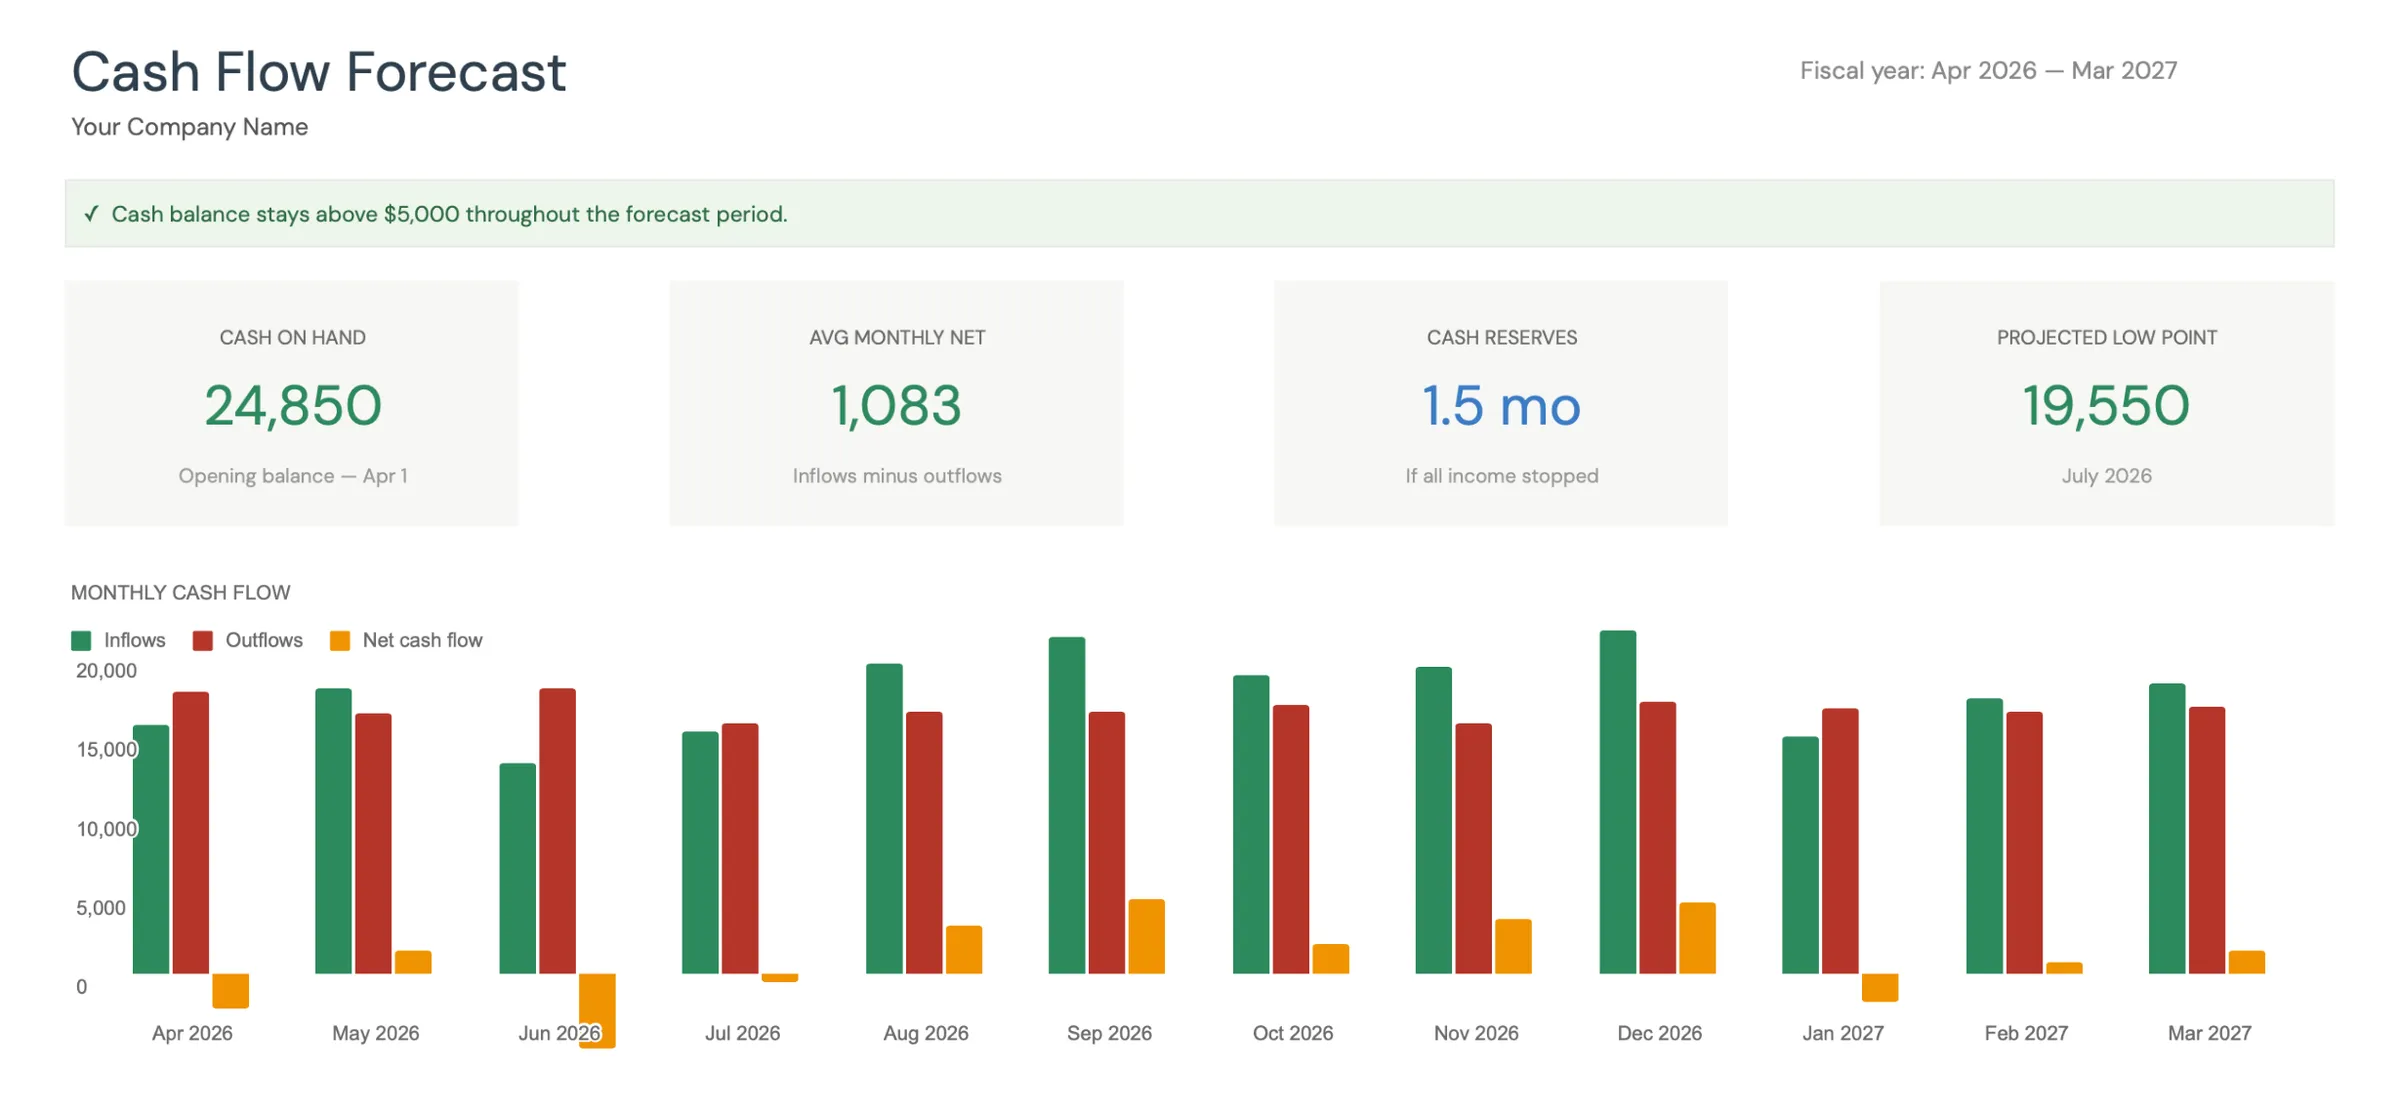
Monthly cash flow overview with KPIs and charts
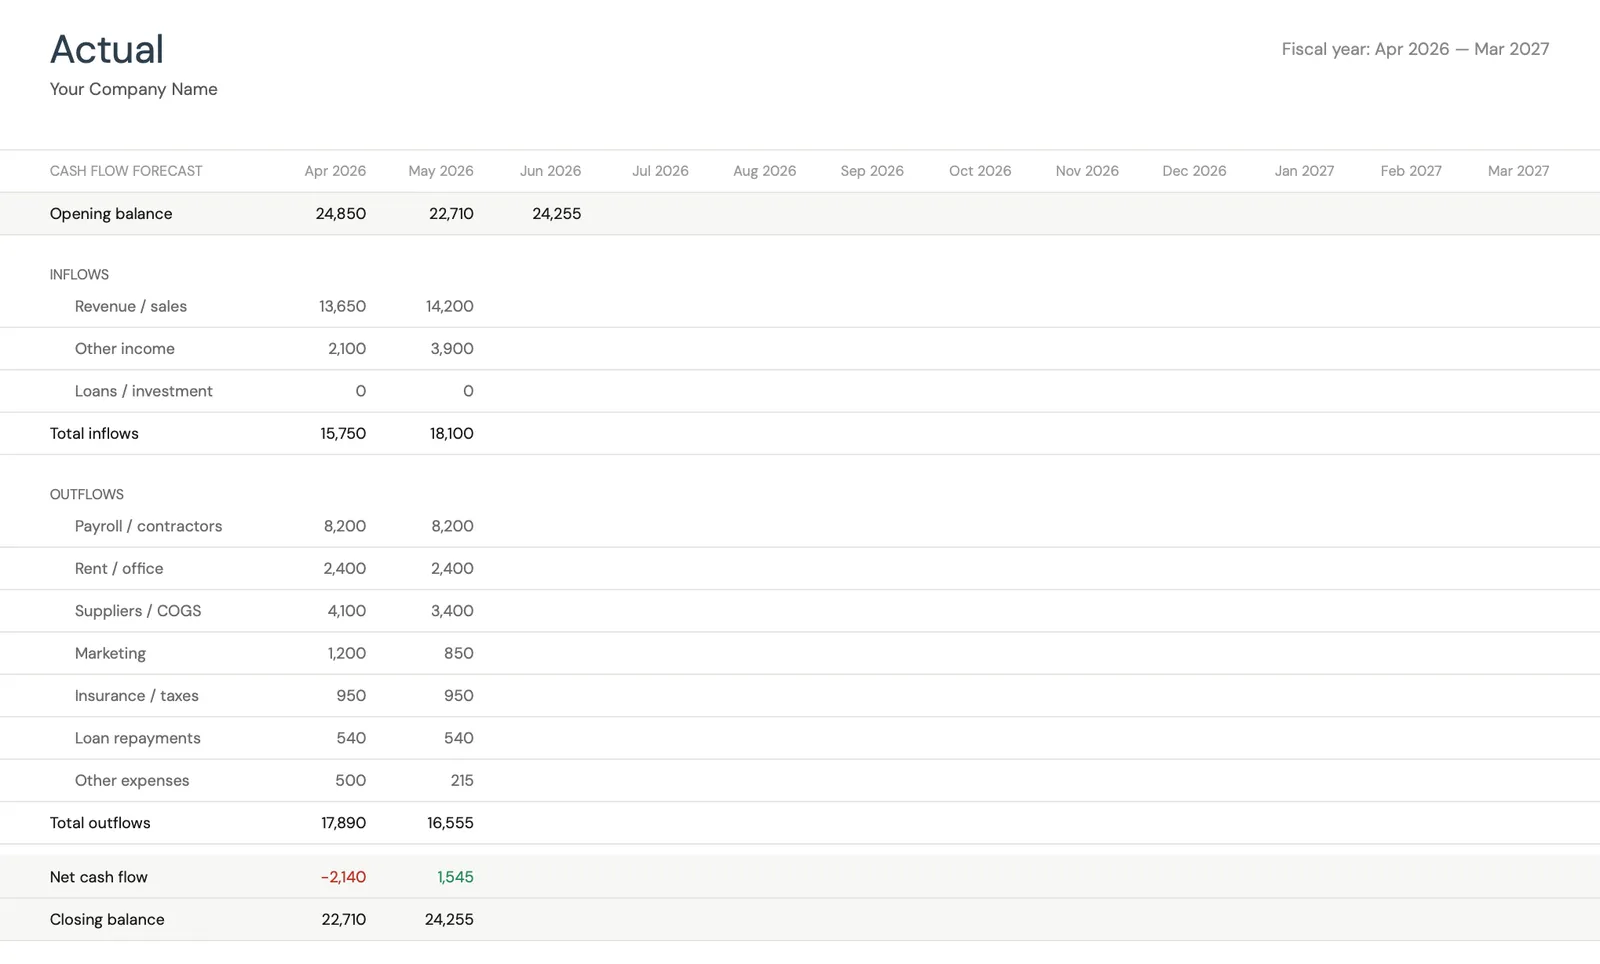
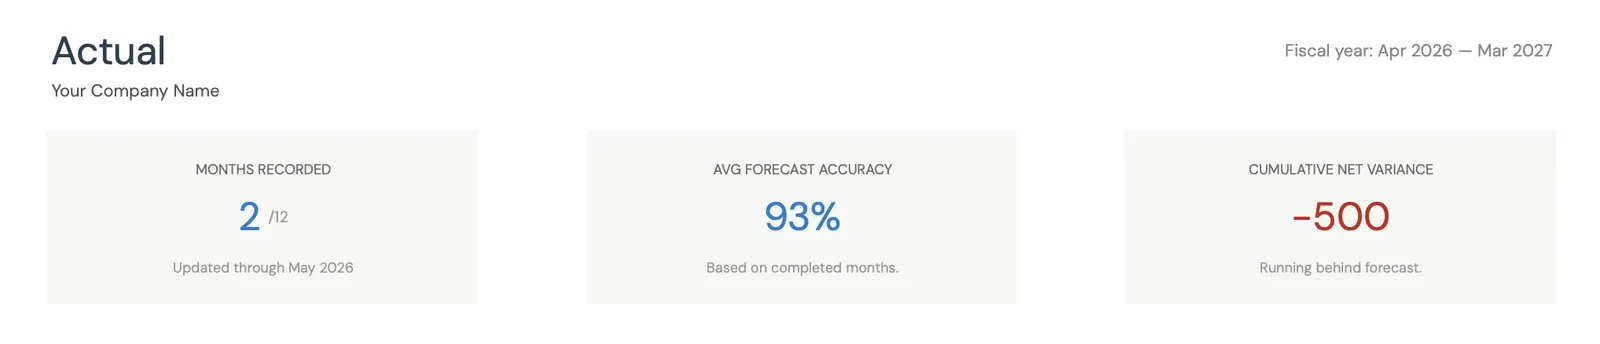
Track actual cash flow against your forecast
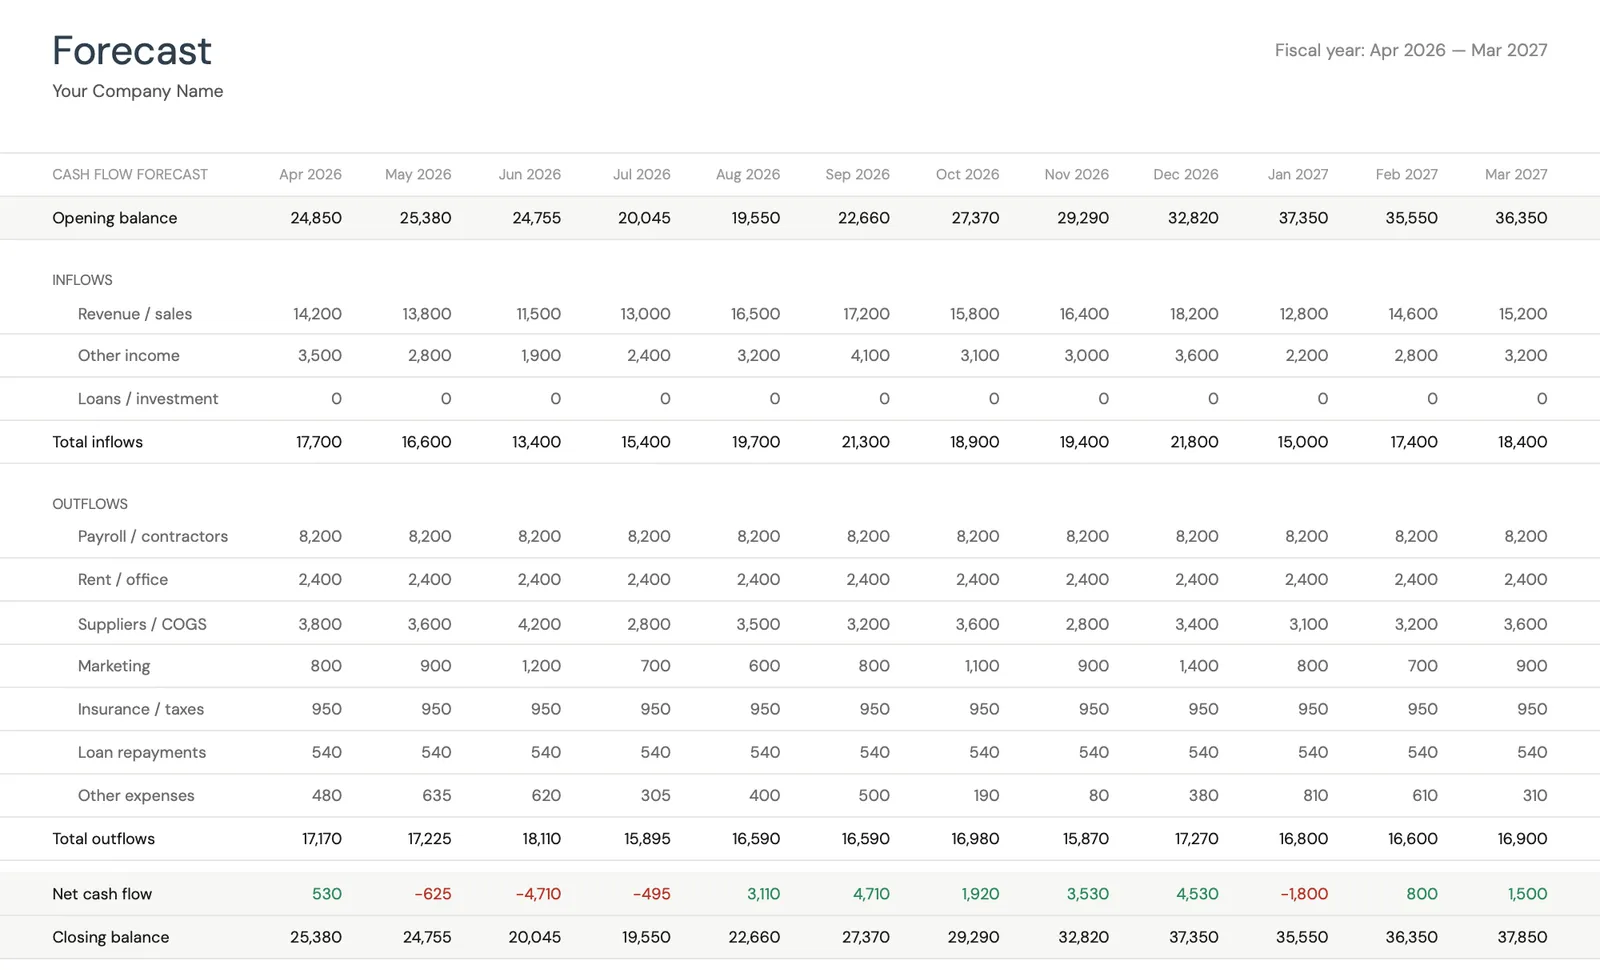
Project cash flow 12 months ahead
Key performance indicators for your cash flow
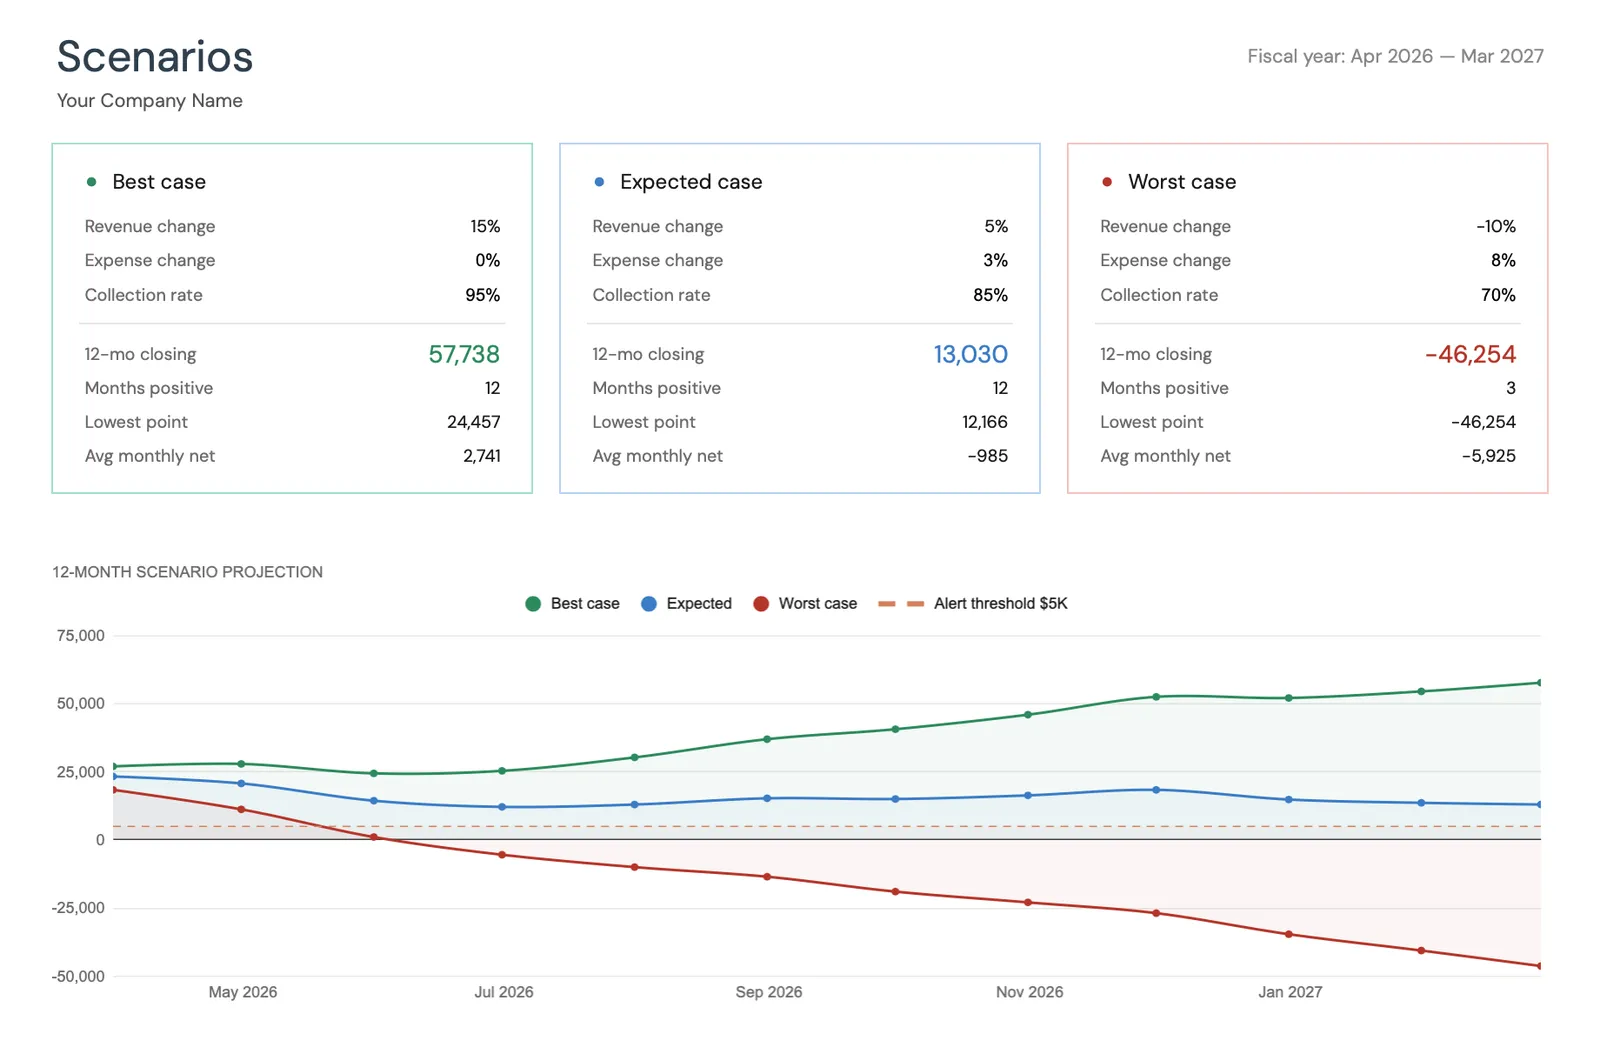
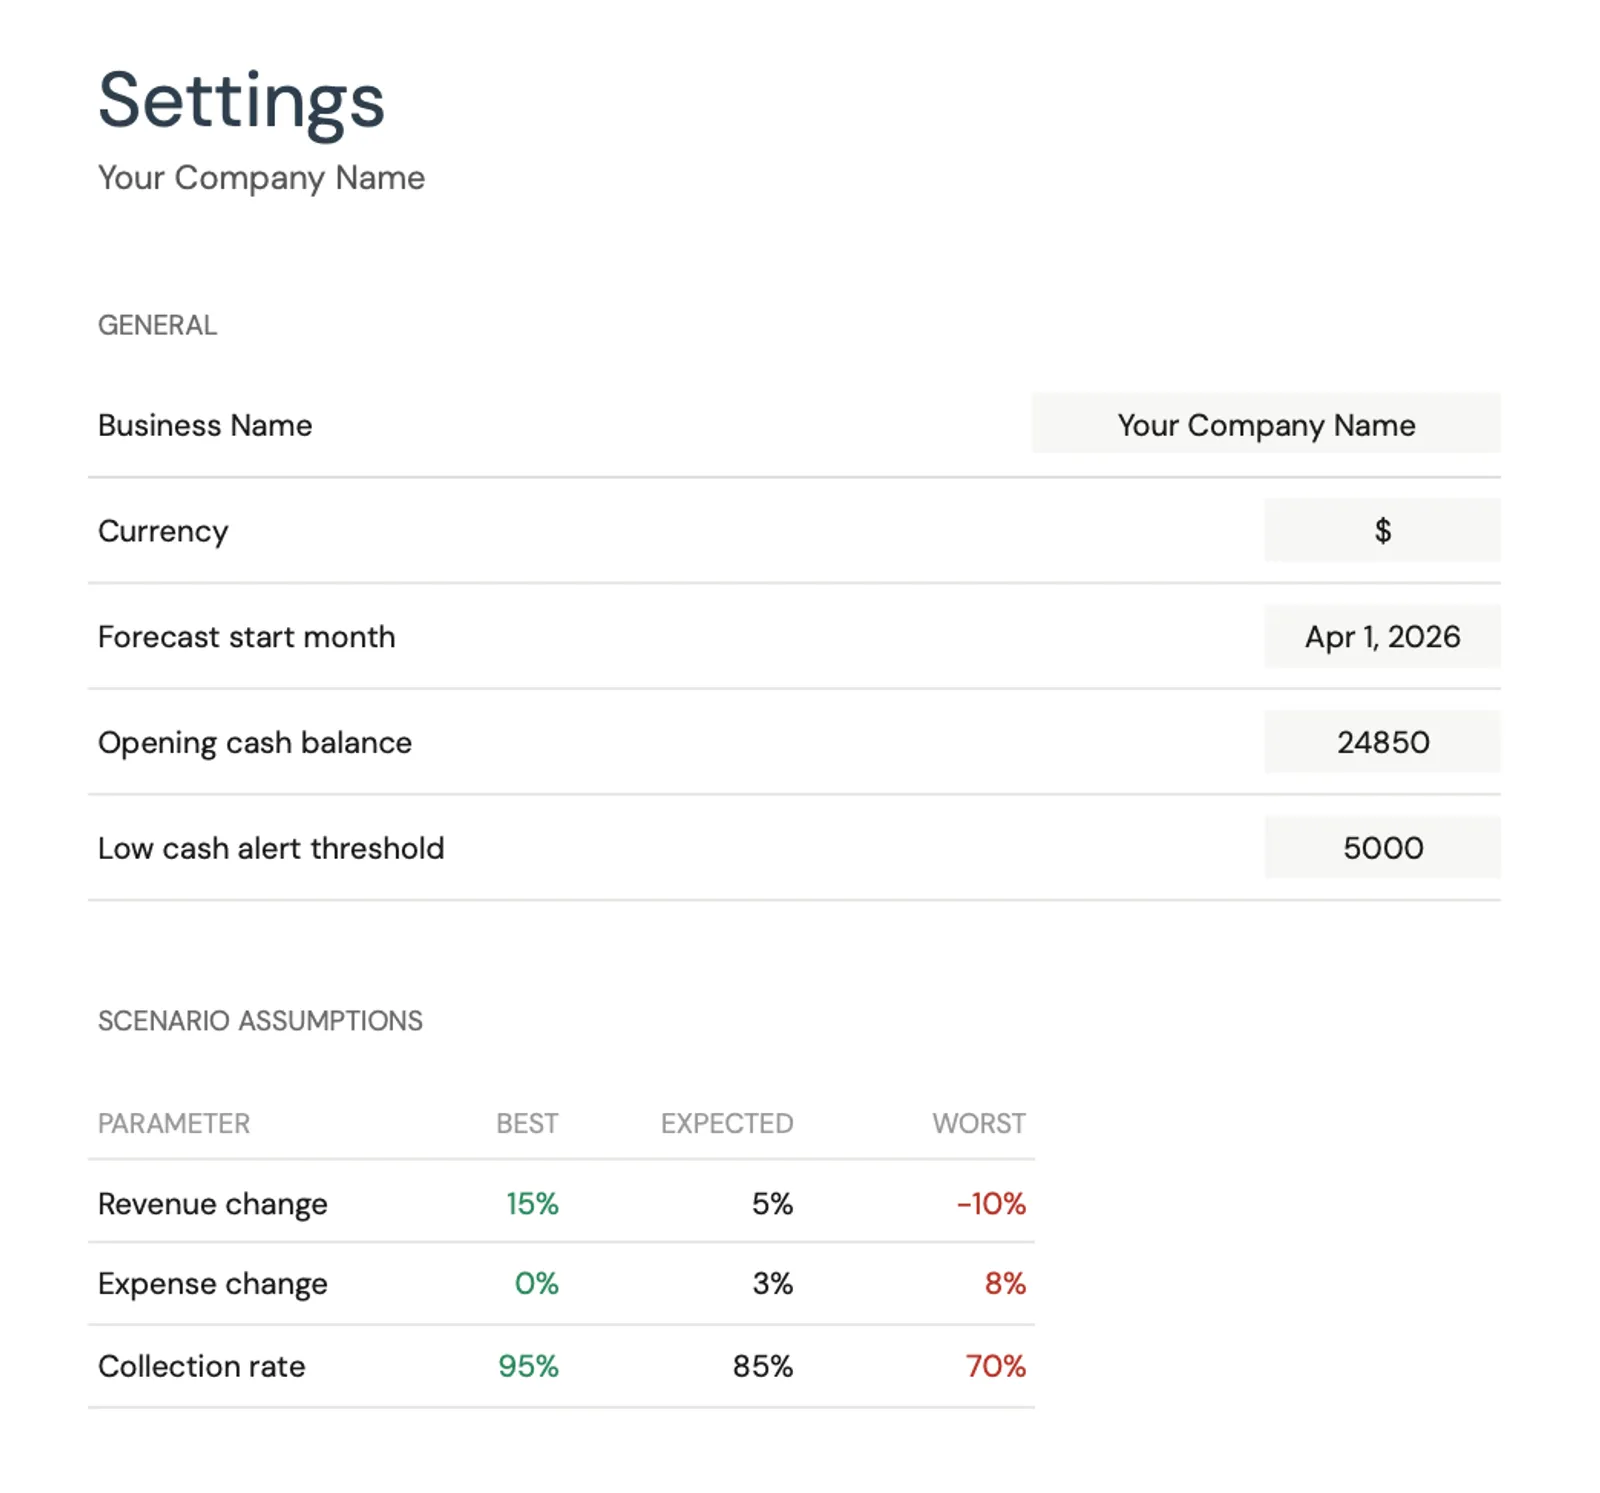
Model different scenarios for your business
Customize categories for your business type
What You Get
What This Cash Flow Template Offers Restaurants
Monthly and weekly cash flow views
The template supports both monthly overview and more detailed breakdowns. For restaurants, the weekly view is where the real insight lives - it reveals the cash timing issues that monthly views hide.
Revenue and expense categorization
Customize categories to match restaurant-specific line items. Separate food costs from labor from overhead to see each major cost center clearly. Track revenue by source (dine-in, delivery, catering) to understand which channels drive profitability.
Track what happened vs what you planned
Enter your forecast at the start of each period, then update with actual numbers. The variance shows where your assumptions were wrong - which is how forecasts improve over time. If you consistently overestimate Tuesday revenue, adjust the model.
12-month revenue projection for restaurants
See your projected cash position 12 months out. For restaurants, this is essential for planning seasonal staffing changes, equipment purchases, menu overhauls, and identifying months where you'll need a cash reserve.
Common Questions
Cash Flow for Restaurants - FAQ
What profit margin should a restaurant target?
Net profit margins for full-service restaurants typically range from 3-9%, with 5-6% being common for well-run operations. Fast-casual and counter-service models often achieve 6-9% due to lower labor costs. These are industry-wide figures - individual results vary significantly based on concept, location, and management. The cash flow template helps you track whether you're hitting your target.
How often should I update my cash flow forecast?
Weekly is ideal for restaurants due to the high variance in daily revenue. At minimum, update monthly with actual numbers and re-forecast quarterly. During your first year of operation or during seasonal transitions, weekly updates help you learn your business's cash flow patterns.
Can this template handle multiple locations?
The template is designed for a single business unit. For multiple locations, you can create a copy for each location and a consolidated summary sheet. This approach actually provides better visibility than a combined template because each location's cash flow dynamics are different.
How do I account for seasonal fluctuations?
Use historical data from previous years to identify seasonal patterns. The 12-month forecast view lets you project lower revenue months and plan accordingly - building cash reserves during peak months to cover slow periods. If you're a new restaurant without historical data, research seasonal patterns for your market and cuisine type.
Does this template work for food trucks or ghost kitchens?
Yes. The template is customizable, so you can adjust categories for any food business model. Food trucks would add vehicle-related costs and event/location tracking. Ghost kitchens would emphasize delivery platform commissions and packaging costs while removing FOH labor and dine-in revenue categories.
Can't find the answer you're looking for? Contact our team
Forecast cash flow for your restaurant
One-time purchase. No subscription. Your financial data stays in your Google Drive.