Cash Flow Forecast
Cash Flow Forecast Template for Real Estate (Rental Properties)
Forecast rental income, plan for vacancy periods, track maintenance and repair costs, and manage mortgage payment schedules - all in a Google Sheets template built for cash flow management.
In Depth
Cash Flow Patterns in Rental Property Ownership
Rental property cash flow has a deceptive simplicity on the surface - rent comes in, mortgage and expenses go out, and the difference is your return. In practice, the "expense" side has a character all its own. Months of steady, predictable cash flow can be interrupted by a single phone call about a burst pipe or a failed furnace. The financial rhythm of rental property is long stretches of consistency punctuated by sharp, unplanned expenses.
Vacancy is the silent cost that many property owners underestimate in their initial projections. A unit sitting empty for one month does not just cost the lost rent - it also incurs turnover expenses like cleaning, minor repairs, new paint, and marketing to find the next tenant. In many markets, the true cost of a tenant turnover runs $3,000-$5,000 when all factors are included. Properties with longer average tenancy tend to perform meaningfully better on a cash flow basis than those with frequent turnover.
The mortgage payment creates a fixed obligation that does not care about your occupancy rate or maintenance surprises. For leveraged properties, the mortgage typically represents the single largest monthly expense, and it arrives on schedule regardless of whether rent was collected. This is where cash reserves become essential rather than optional. Some property owners maintain a dedicated reserve account for each property, treating the monthly contribution as a non-negotiable operating expense.
Multi-property portfolios introduce diversification that can smooth cash flow, but also add complexity. One property might be generating strong positive cash flow while another absorbs it through a renovation or extended vacancy. The portfolio-level view reveals whether the overall operation is sustainable, while the property-level view identifies which assets are contributing and which are drawing down the collective cash position.
The Challenge
Cash Flow Challenges for Rental Property Owners
Rental property generates relatively predictable income with a caveat: expenses are lumpy, unpredictable, and often urgent. A single major repair can erase months of positive cash flow. Understanding these patterns is essential for sustainable property management.
Vacancy periods eliminate income while costs continue
Every month a unit sits empty costs you the full rent amount plus continued mortgage, insurance, and tax payments. Vacancy rates vary by market and property type but typically average 5-10% annually. For a property renting at $2,000/month, even one month of vacancy represents $2,000 in lost income plus $1,500+ in carrying costs. Turnover costs (cleaning, repairs, marketing) add another $1,000-$3,000 per tenant change.
Maintenance costs are unpredictable and often large
A new roof costs $8,000-$15,000. A furnace replacement runs $3,000-$6,000. A water heater fails on a Saturday and the emergency plumber charges $800. These are not "if" expenses but "when" expenses. General guidance suggests budgeting 1-2% of property value annually for maintenance - a $300,000 property might need $3,000-$6,000 per year. But this spending is lumpy: nothing for six months, then $5,000 in a single week.
Mortgage payments are fixed regardless of occupancy
Your mortgage payment - often 40-60% of gross rent - is due every month whether the property is occupied or not. Property taxes and insurance are similarly fixed. These obligations create a high breakeven point. If your monthly costs are $1,800 and rent is $2,200, you need nearly full occupancy just to stay cash flow positive. Any significant unexpected expense pushes the month (or quarter) into negative territory.
Capital expenditures require large cash outlays
Beyond routine maintenance, properties periodically need major capital improvements - new roofing, HVAC systems, appliances, flooring. These five-figure expenses do not smooth out over time. A property might generate $4,800 in net cash flow for the year, then require a $12,000 capital expense that wipes out two and a half years of profits in a single month. The forecast must include a capital reserve plan.
Start forecasting your cash flow
Forecasting Guide
How to Forecast Cash Flow for Your Rental Properties
Rental property cash flow forecasting is about modeling both the predictable (rent, mortgage) and unpredictable (maintenance, vacancy). Here is how to structure it using the Cash Flow Forecast template.
Revenue Categories
- Monthly rent by unit or property
- Late fees and pet fees
- Laundry or parking income
- Application and lease renewal fees
- Utility reimbursements from tenants
Expense Categories
- Mortgage principal and interest
- Property taxes
- Insurance (landlord, umbrella)
- Property management fees (8-12% of rent)
- Routine maintenance and repairs
- Capital expenditure reserves
- Utilities (owner-paid portion)
- Landscaping and snow removal
- HOA fees (if applicable)
- Vacancy costs (marketing, turnover prep)
- Legal and eviction costs
- Accounting and bookkeeping
Cash Flow Timing
Rental income is typically collected on the 1st of each month while the mortgage and most expenses are also due early in the month. This front-loaded pattern means mid-month cash position is usually stable. The forecast should include a vacancy assumption (5-10% of gross rent annually) spread across expected turnover months, and a capital reserve contribution of 5-10% of gross rent monthly to prepare for major expenses.
See It In Action
What the template looks like
Browse through the template to see dashboards, forecasting, actuals tracking, and scenario planning.
- Visual cash flow dashboard
- Forecast vs actuals comparison
- Scenario planning tools
- Customizable categories

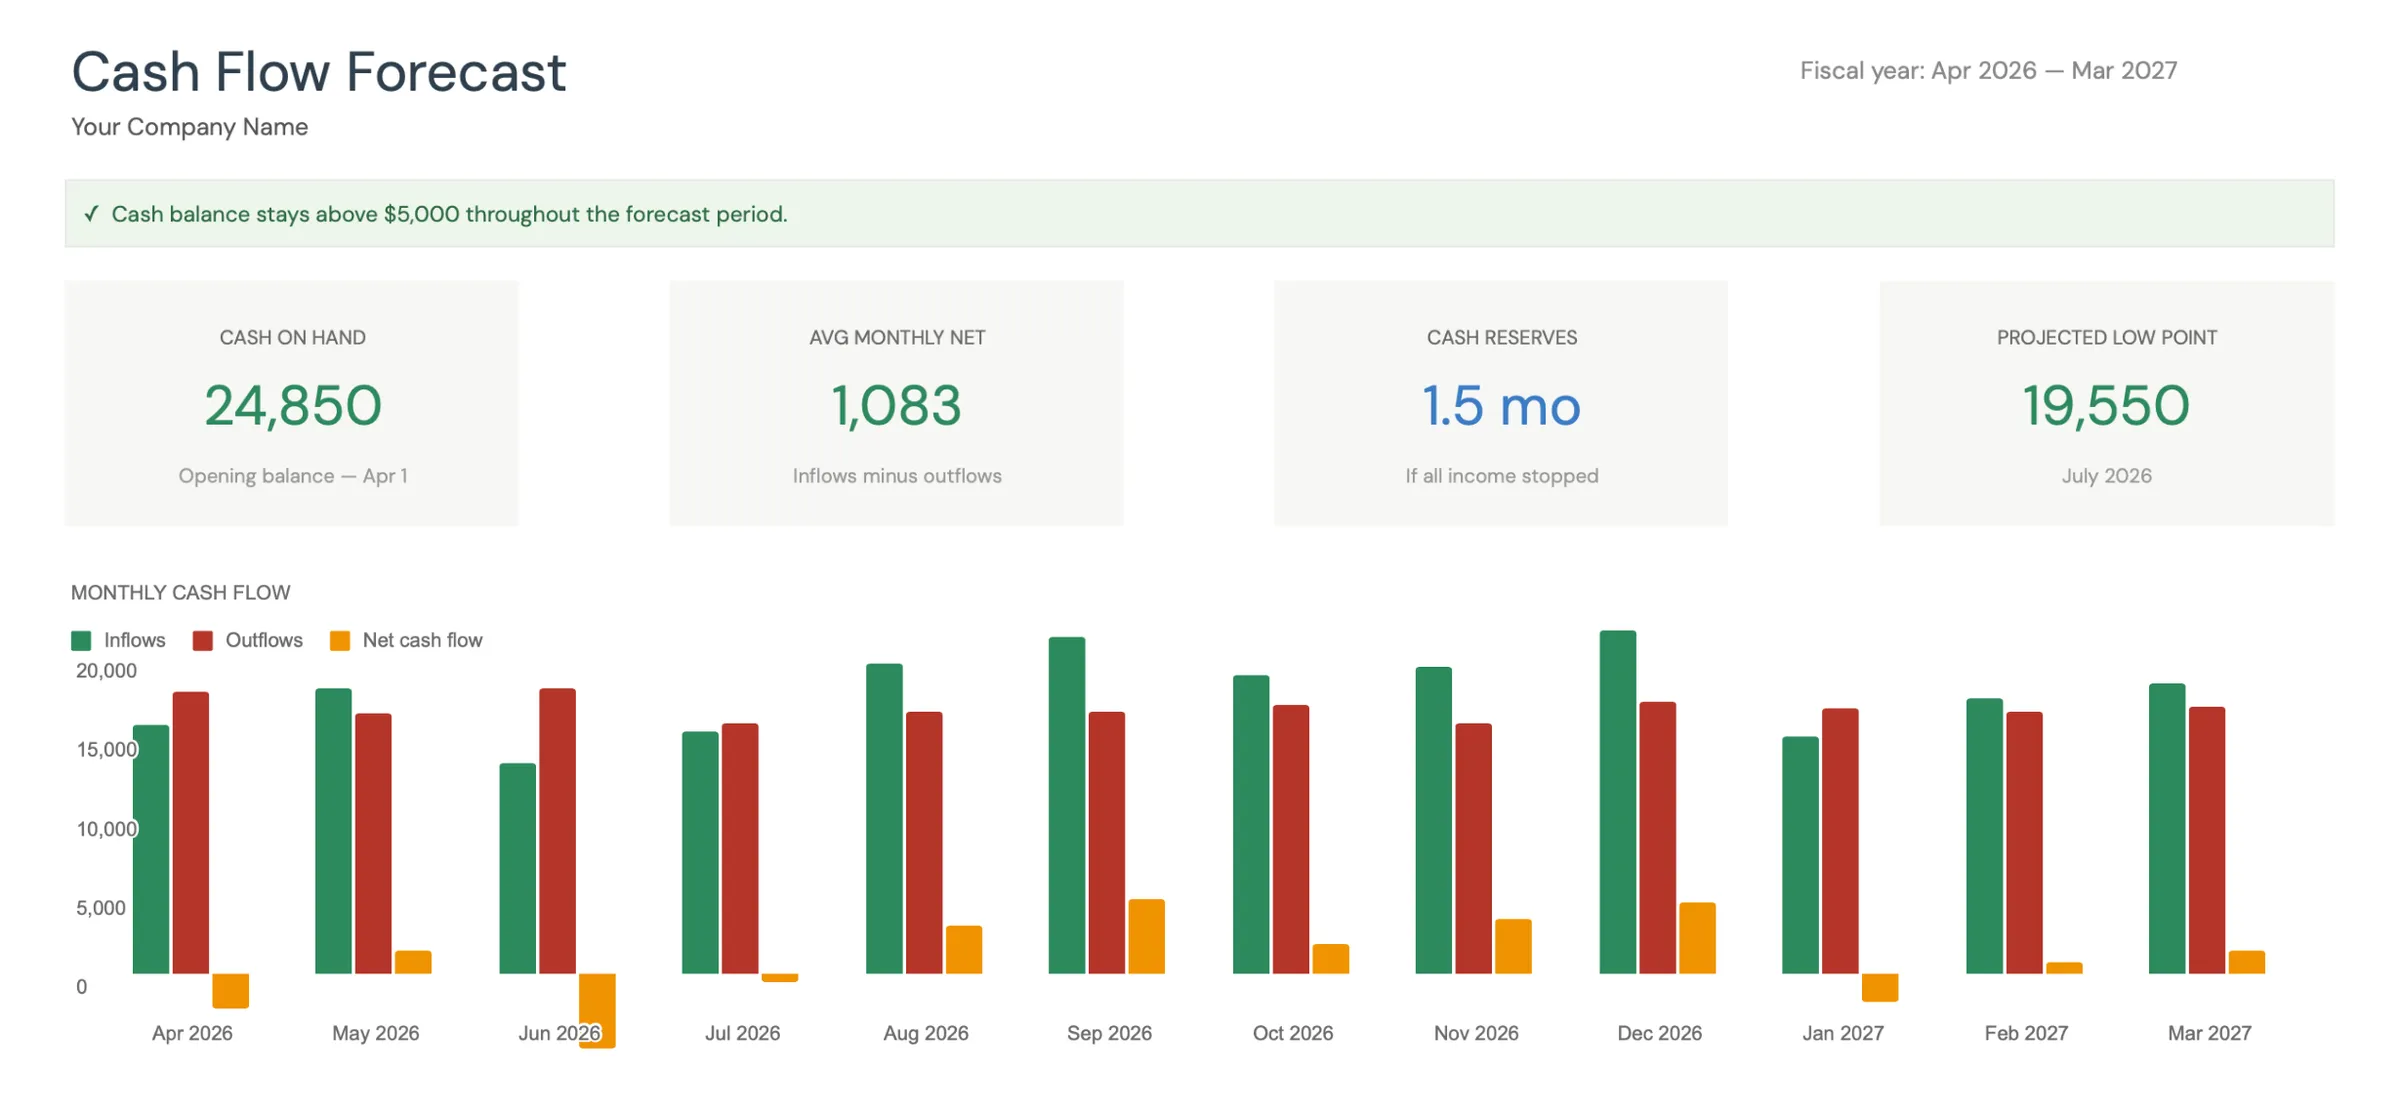
Monthly cash flow overview with KPIs and charts
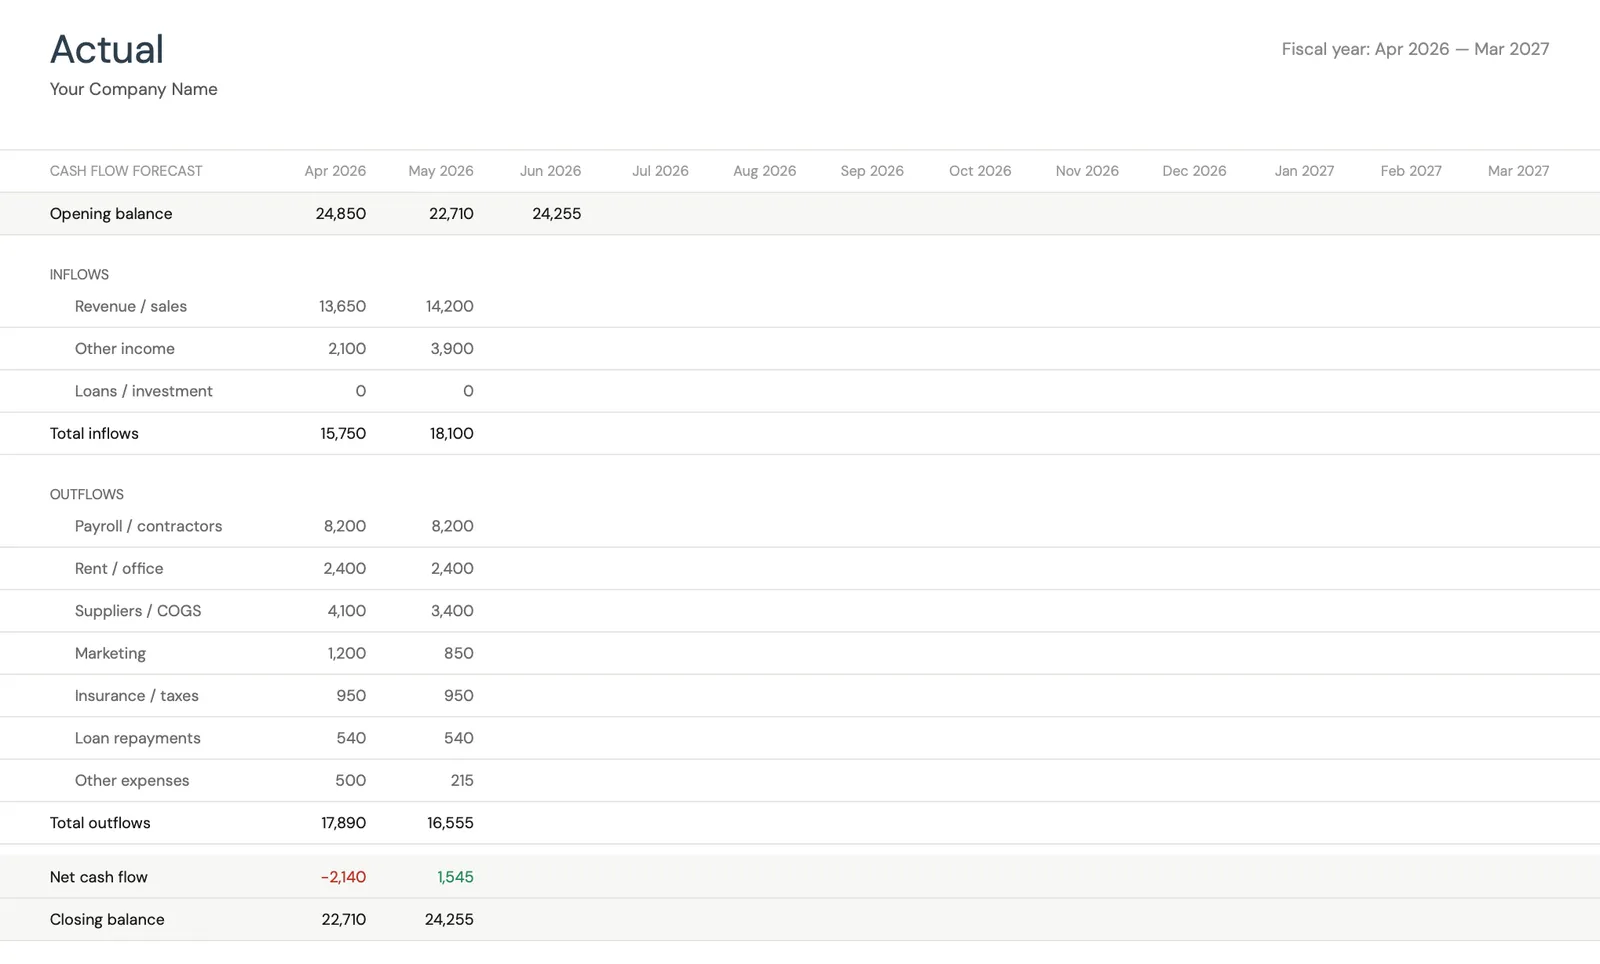
Track actual cash flow against your forecast
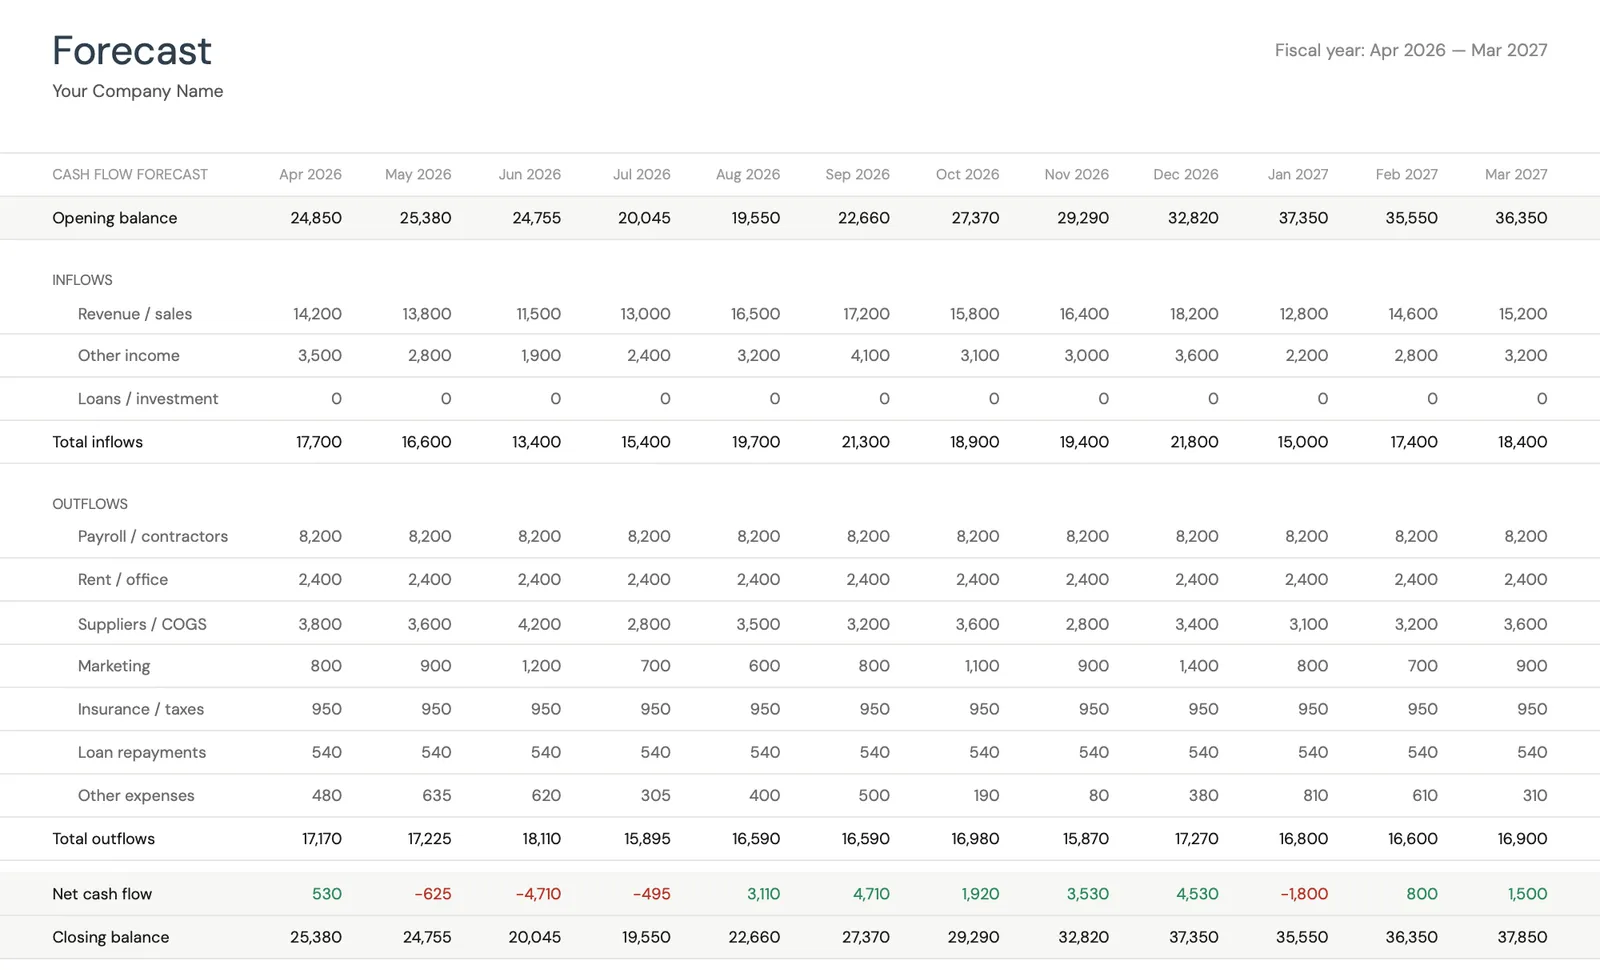
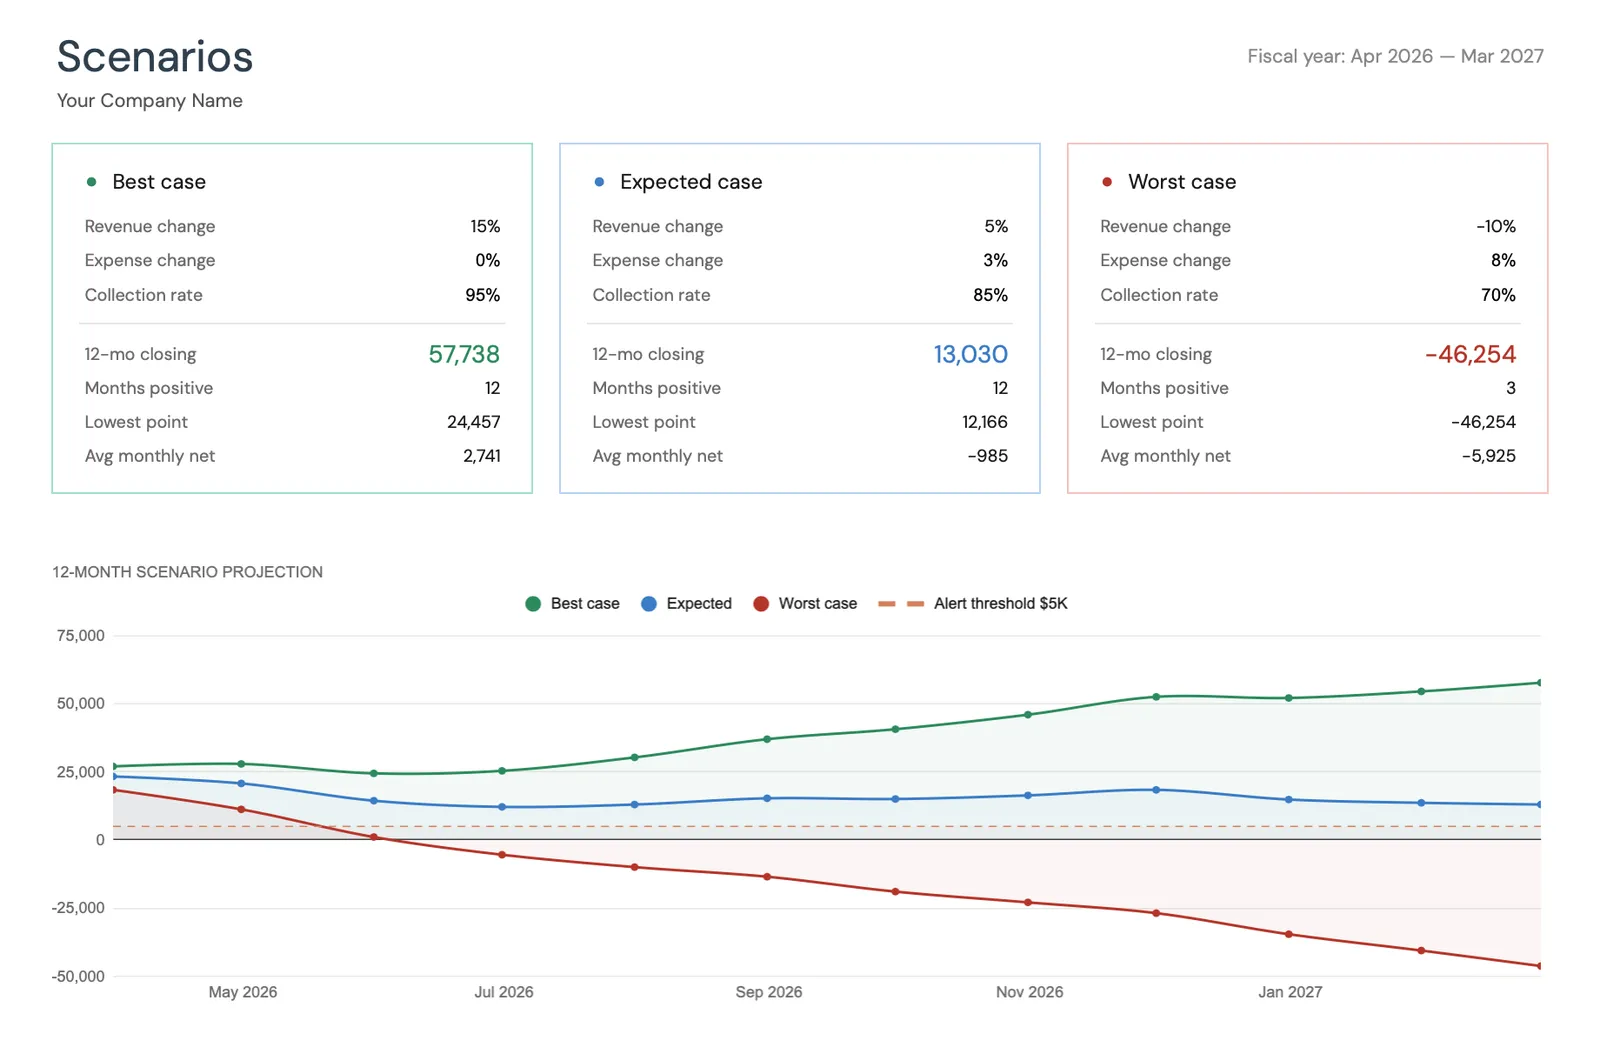
Project cash flow 12 months ahead
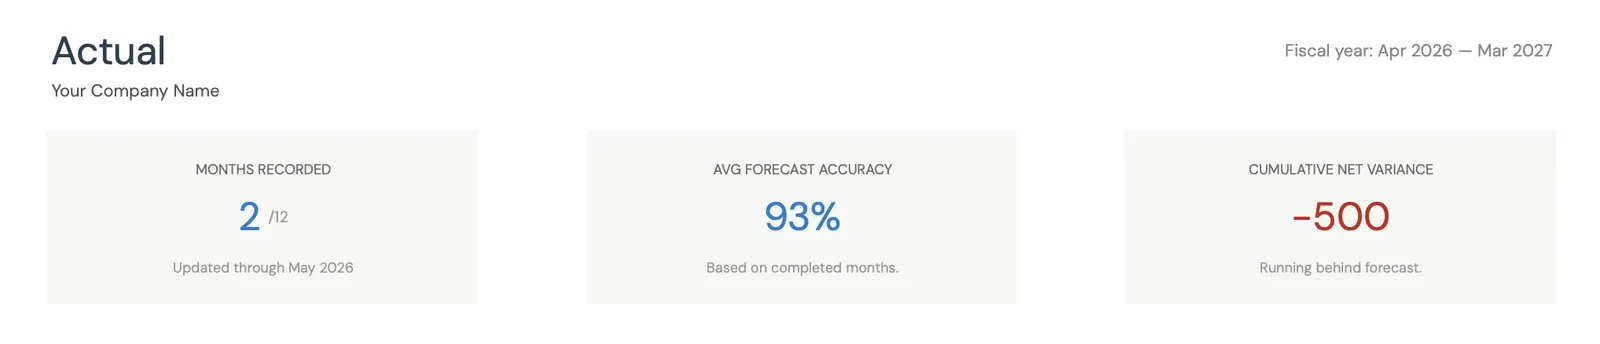
Key performance indicators for your cash flow
Model different scenarios for your business
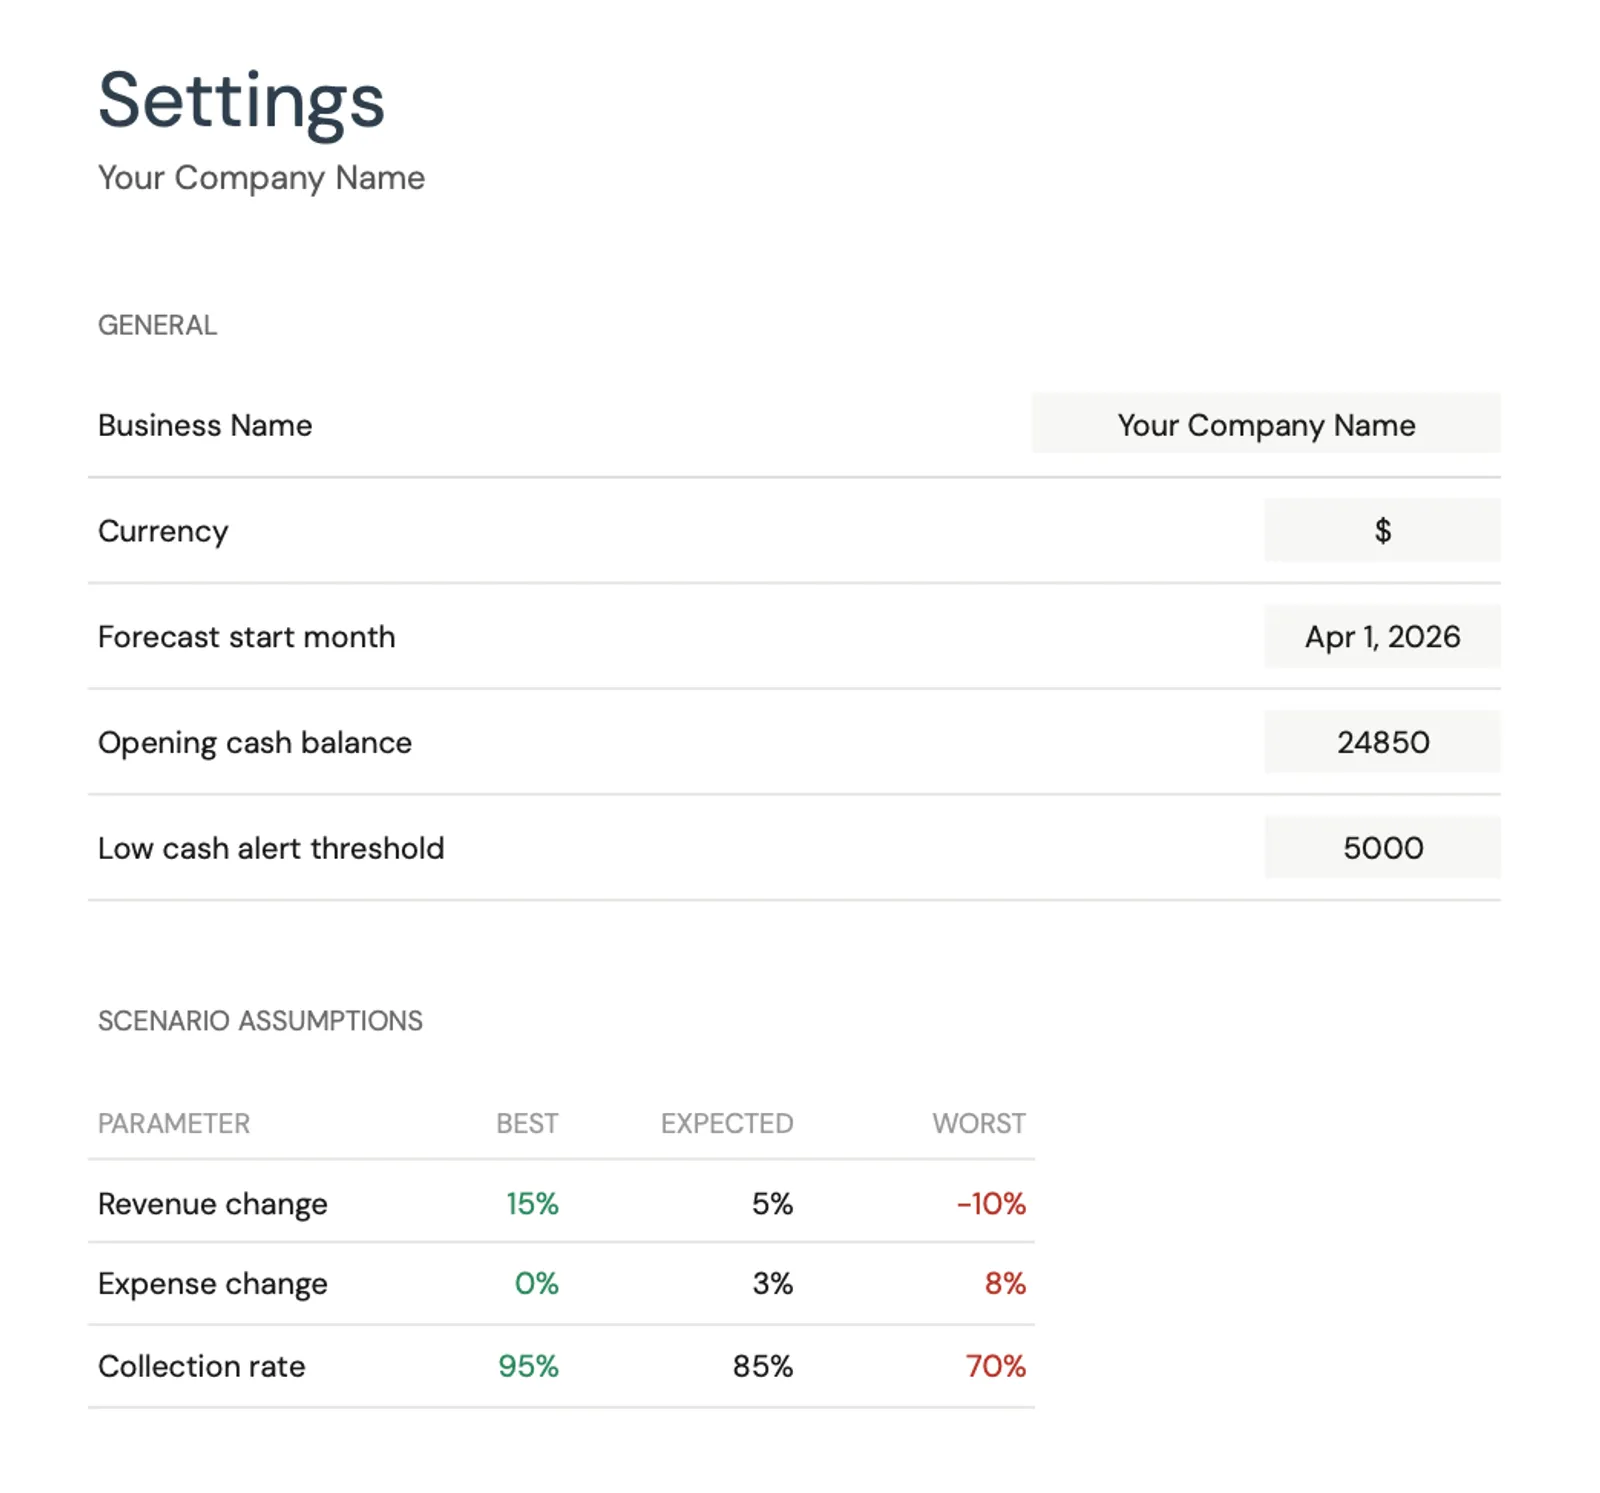
Customize categories for your business type
What You Get
What Rental Property Owners Get From This Template
Per-property income tracking
Track each property or unit separately to see which are performing well and which are dragging down cash flow. A portfolio view that masks individual property performance can hide problems.
Vacancy and turnover modeling
Build vacancy assumptions into the forecast by property and by month. If a lease expires in September, model the potential for one month of vacancy and turnover costs in your forecast.
Rent collected vs what you budgeted
Compare projected rent collection and expenses against actuals. Maintenance costs are the biggest variable - tracking actual spending against your budget reveals whether your reserve contributions are adequate.
12-month property portfolio cash view
See your projected cash position across all properties for the next year. Plan for known events like lease renewals, property tax payments, and insurance renewals. Identify months where capital reserves may need to cover maintenance spikes.
Common Questions
Cash Flow for Real Estate (Rental Properties) - FAQ
What is a good cash-on-cash return for rental property?
Cash-on-cash returns (annual pre-tax cash flow divided by total cash invested) typically range from 4-10% for residential rental properties. Returns above 8% are generally considered strong, though this varies significantly by market, property type, and leverage. The cash flow template helps you track actual returns versus your initial projections.
How much should I budget for maintenance and repairs?
A common guideline is 1-2% of property value annually, or 10-15% of gross rent. Older properties and those with aging systems trend toward the higher end. The important thing is setting aside reserves monthly - even when nothing breaks - so the cash is available when a $5,000 repair hits unexpectedly.
How do I handle properties with different lease end dates?
Map each unit's lease expiration into the forecast and model a vacancy scenario around each renewal date. If a lease ends in June, forecast potential vacancy for July and turnover costs of $1,500-$3,000. Having a staggered lease schedule across your portfolio prevents multiple vacancies from hitting simultaneously.
Can this template handle a multi-property portfolio?
Yes. Set up revenue and expense lines for each property or create separate tabs per property with a consolidated summary. The template works well for portfolios up to 10-15 units. Larger portfolios may benefit from property management software, but a spreadsheet forecast often provides better cash flow visibility than PM tools focused on operations.
How do I account for property tax and insurance increases?
Research your local property tax reassessment schedule and build in expected increases (typically 2-5% annually). Insurance premiums tend to rise 3-8% per year, more in areas prone to natural disasters. The 12-month forecast should use current known amounts and the next year's projection should include expected increases.
Can't find the answer you're looking for? Contact our team
Forecast cash flow for your real estate (rental properties)
One-time purchase. No subscription. Your financial data stays in your Google Drive.