Cash Flow Forecast
Cash Flow Forecast Template for Food Trucks
Forecast location-based revenue, track food costs and commissary fees, manage fuel and maintenance expenses, and plan for seasonal slowdowns - all in a Google Sheets template built for cash flow management.
In Depth
Life on Wheels - The Financial Reality of Food Trucks
Food trucks operate at the intersection of restaurant economics and mobile business logistics, and the cash flow reflects both worlds. Revenue depends not just on food quality and pricing but on securing the right spot on the right day in the right weather. A prime lunch location on a sunny Thursday might generate $1,500, while the same menu at a different spot on a rainy Monday brings in $200. This location-driven variability is something brick-and-mortar restaurants simply do not face.
Weather is the uncontrollable variable that shapes food truck finances more than almost any other factor. A week of rain during what should be a strong revenue period can turn a profitable month into a losing one. In northern climates, the operating season might compress into six or seven months, meaning the entire year of expenses needs to be covered by half a year of revenue. Some operators find that events and catering bookings provide a more weather-resilient revenue stream than daily street service.
The vehicle itself introduces a cost category that restaurant owners never think about. Fuel, insurance, commercial vehicle registration, generator maintenance, and the ever-present possibility of a mechanical breakdown all add up. A food truck that cannot drive to its location or power its equipment generates zero revenue that day, and emergency repairs rarely happen at convenient times. The financial difference between a well-maintained truck and a neglected one tends to show up dramatically over a twelve-month period.
Despite these challenges, food trucks have a structural advantage in their relatively low fixed costs compared to restaurants. No long-term commercial lease, smaller staff, and the ability to follow demand rather than waiting for it to arrive all contribute to a business model that can be cash-flow positive at lower revenue levels. Some food truck operators test menu concepts and build a customer base before transitioning to a permanent location - using the truck as a lower-risk proving ground.
The Challenge
Cash Flow Challenges for Food Trucks
Food trucks combine the challenges of a restaurant with the unpredictability of a mobile business. Revenue depends on location, weather, and events while costs include both food service and vehicle operations. Cash flow management keeps the wheels turning.
Revenue is highly variable by location and day
A food truck might generate $1,500 at a popular lunch spot on Thursday and $400 at the same location on Monday. Event days can bring $3,000-$5,000, while a rainy Tuesday might yield $200. This extreme daily variability makes weekly and monthly revenue hard to predict. Historical data by location and day of week is the most reliable forecasting input - but it takes months of operation to build that dataset.
Weather directly impacts revenue
Rain, extreme heat, or cold can cut food truck revenue by 50-80% on any given day. Unlike a restaurant, there is no indoor backup. A week of bad weather can turn a profitable month into a losing one. Seasonal patterns matter enormously - many food trucks in northern climates see revenue drop 60-70% from November through March. The forecast must account for weather-driven seasonality.
Vehicle costs add a layer of expenses restaurants avoid
Fuel costs ($300-$800/month), vehicle insurance ($200-$400/month), and maintenance create expenses that brick-and-mortar restaurants do not face. A major vehicle repair - engine, transmission, generator - can cost $2,000-$8,000 and sideline the truck for days or weeks. Every day the truck is not operating is a day of zero revenue with ongoing fixed costs.
Permit fees and commissary costs are ongoing
Most cities require food truck permits ($500-$5,000 annually), health permits, and commissary kitchen access ($500-$1,500/month). Event fees or location fees add $50-$500 per spot per day. These costs accumulate regardless of how much revenue each location generates. A food truck with $8,000 in monthly fixed costs needs to generate at least $400/day across 20 operating days just to break even on overhead.
Start forecasting your cash flow
Forecasting Guide
How to Forecast Cash Flow for Your Food Truck
Food truck cash flow forecasting starts with operating days and average daily revenue. Here is how to structure it using the Cash Flow Forecast template.
Revenue Categories
- Daily location sales (lunch, dinner)
- Event and festival revenue
- Catering and private event income
- Online pre-orders
- Merchandise and branded items
Expense Categories
- Food and ingredient costs (COGS, typically 28-35%)
- Commissary kitchen rental
- Fuel and propane
- Vehicle insurance and maintenance
- Permits and licenses
- Location and event fees
- Packaging and disposables
- Staff wages (if any)
- Payment processing fees
- Marketing and social media
- Equipment maintenance (generator, refrigeration)
- Loan payments (truck, equipment)
Cash Flow Timing
Food trucks operate on a cash-heavy basis with most revenue collected daily (cash and card). The key timing issue is the gap between slow-season revenue and year-round fixed costs. If winter months generate $4,000/month but fixed costs are $5,000/month, you need $1,000/month from reserves for 4-5 months. Build reserves during peak season - typically May through October - to fund the slow months.
See It In Action
What the template looks like
Browse through the template to see dashboards, forecasting, actuals tracking, and scenario planning.
- Visual cash flow dashboard
- Forecast vs actuals comparison
- Scenario planning tools
- Customizable categories

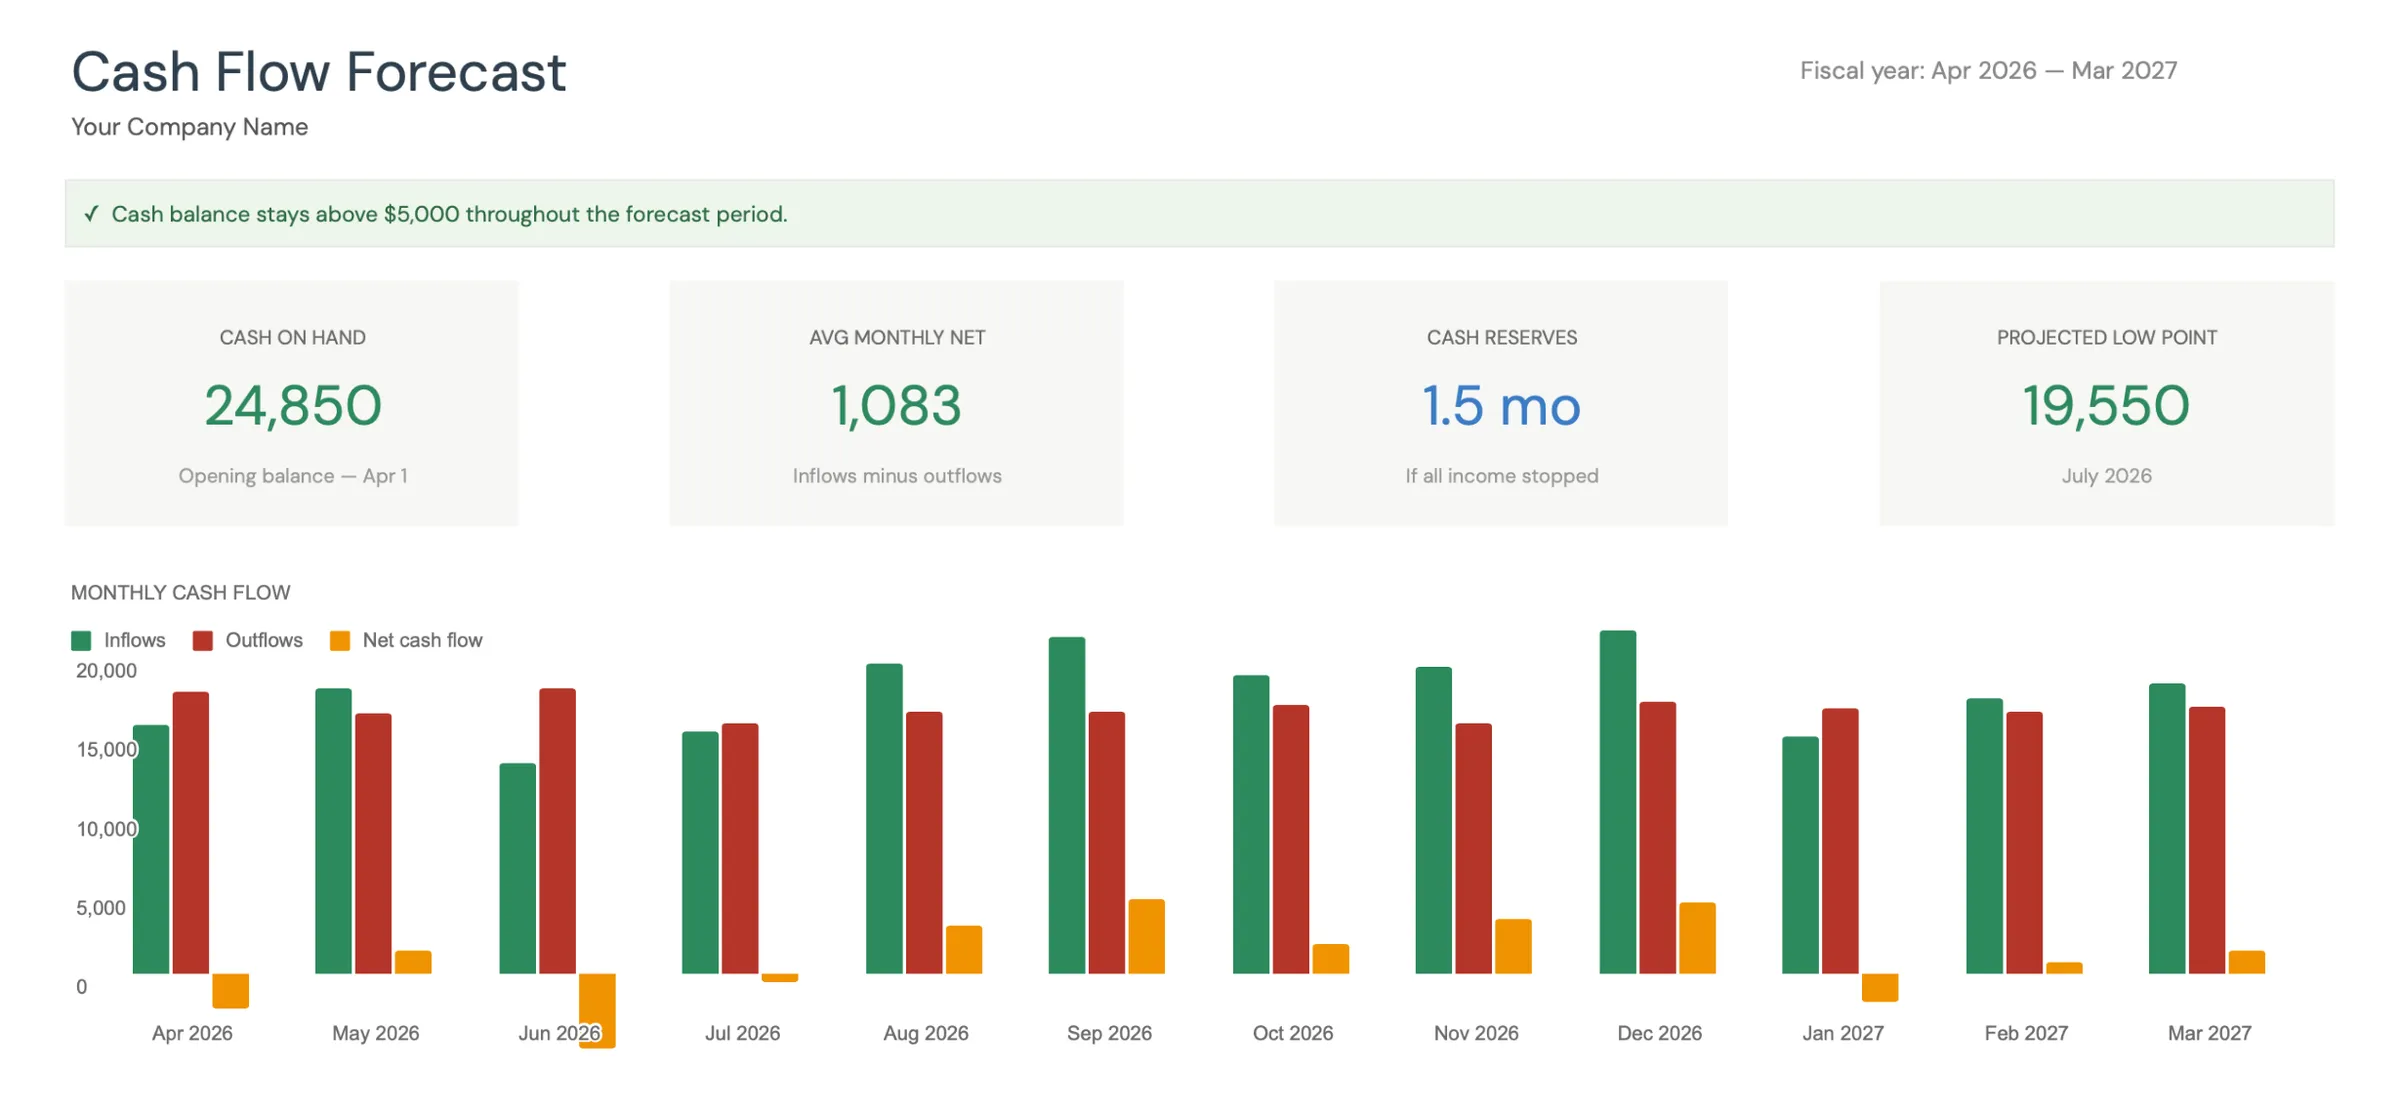
Monthly cash flow overview with KPIs and charts
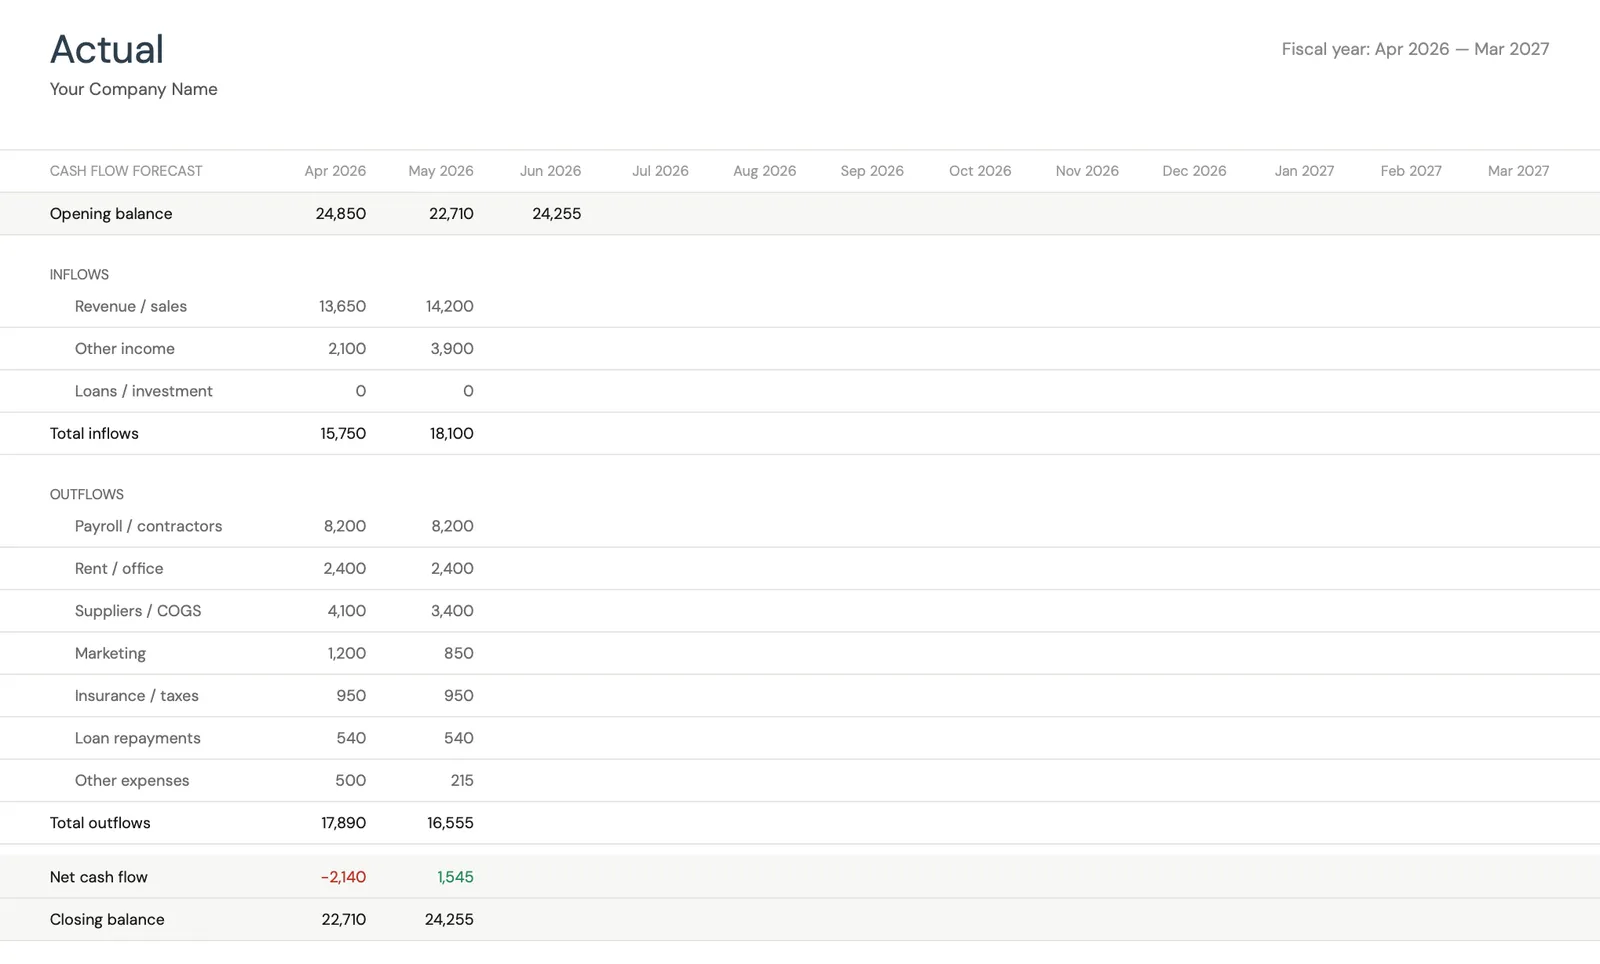
Track actual cash flow against your forecast
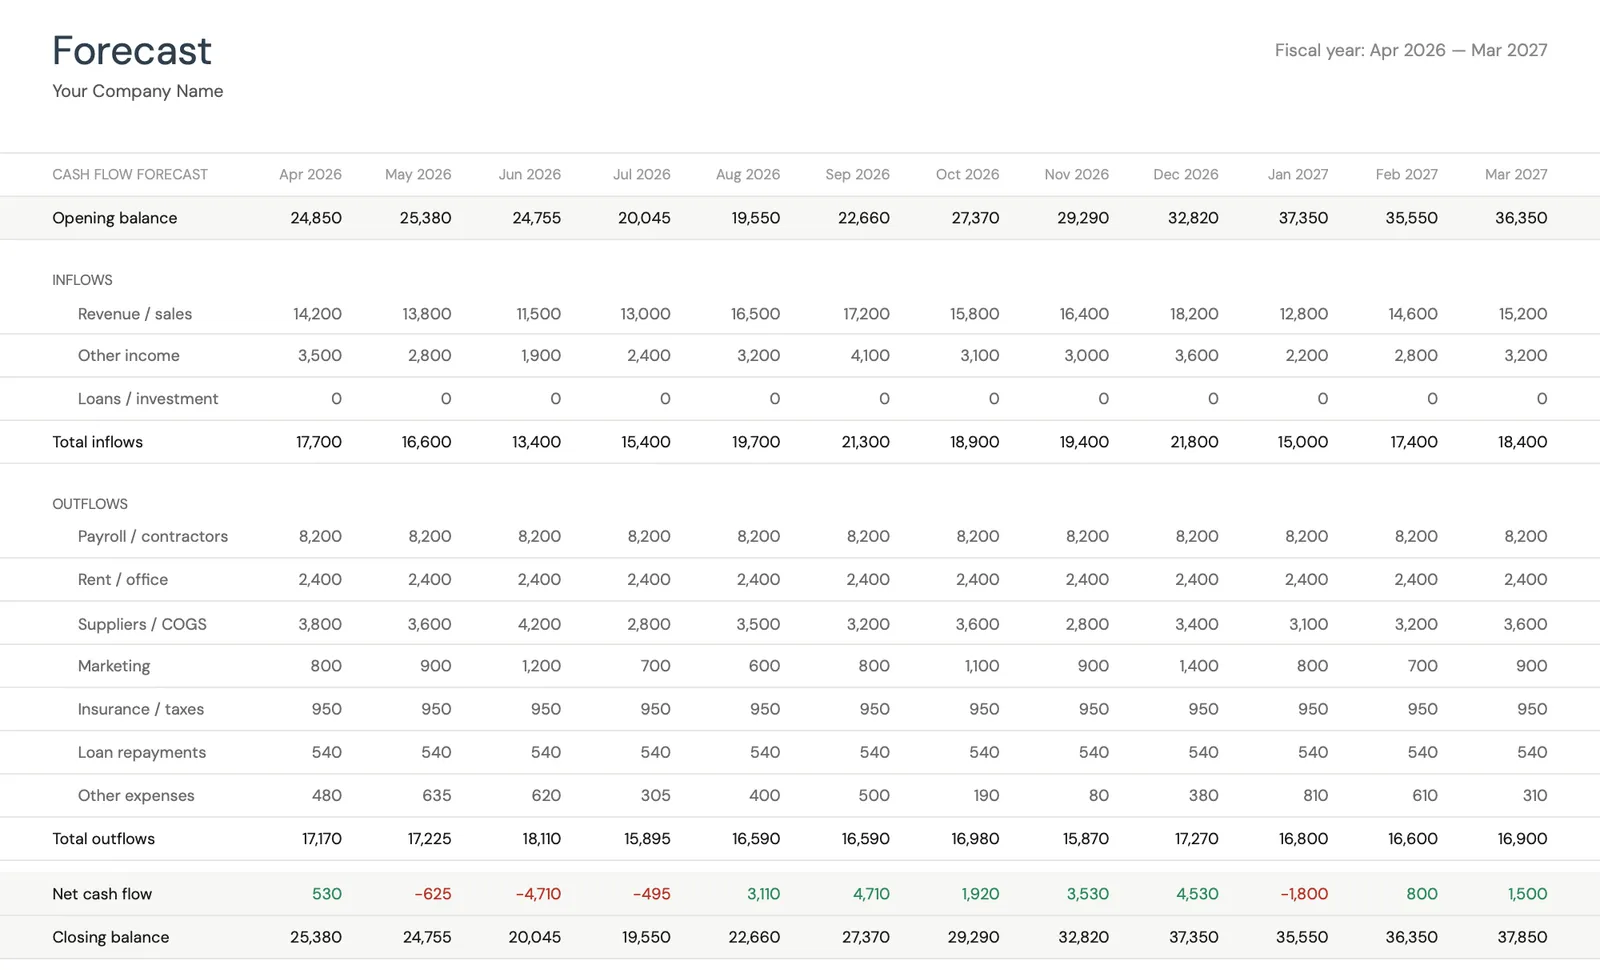
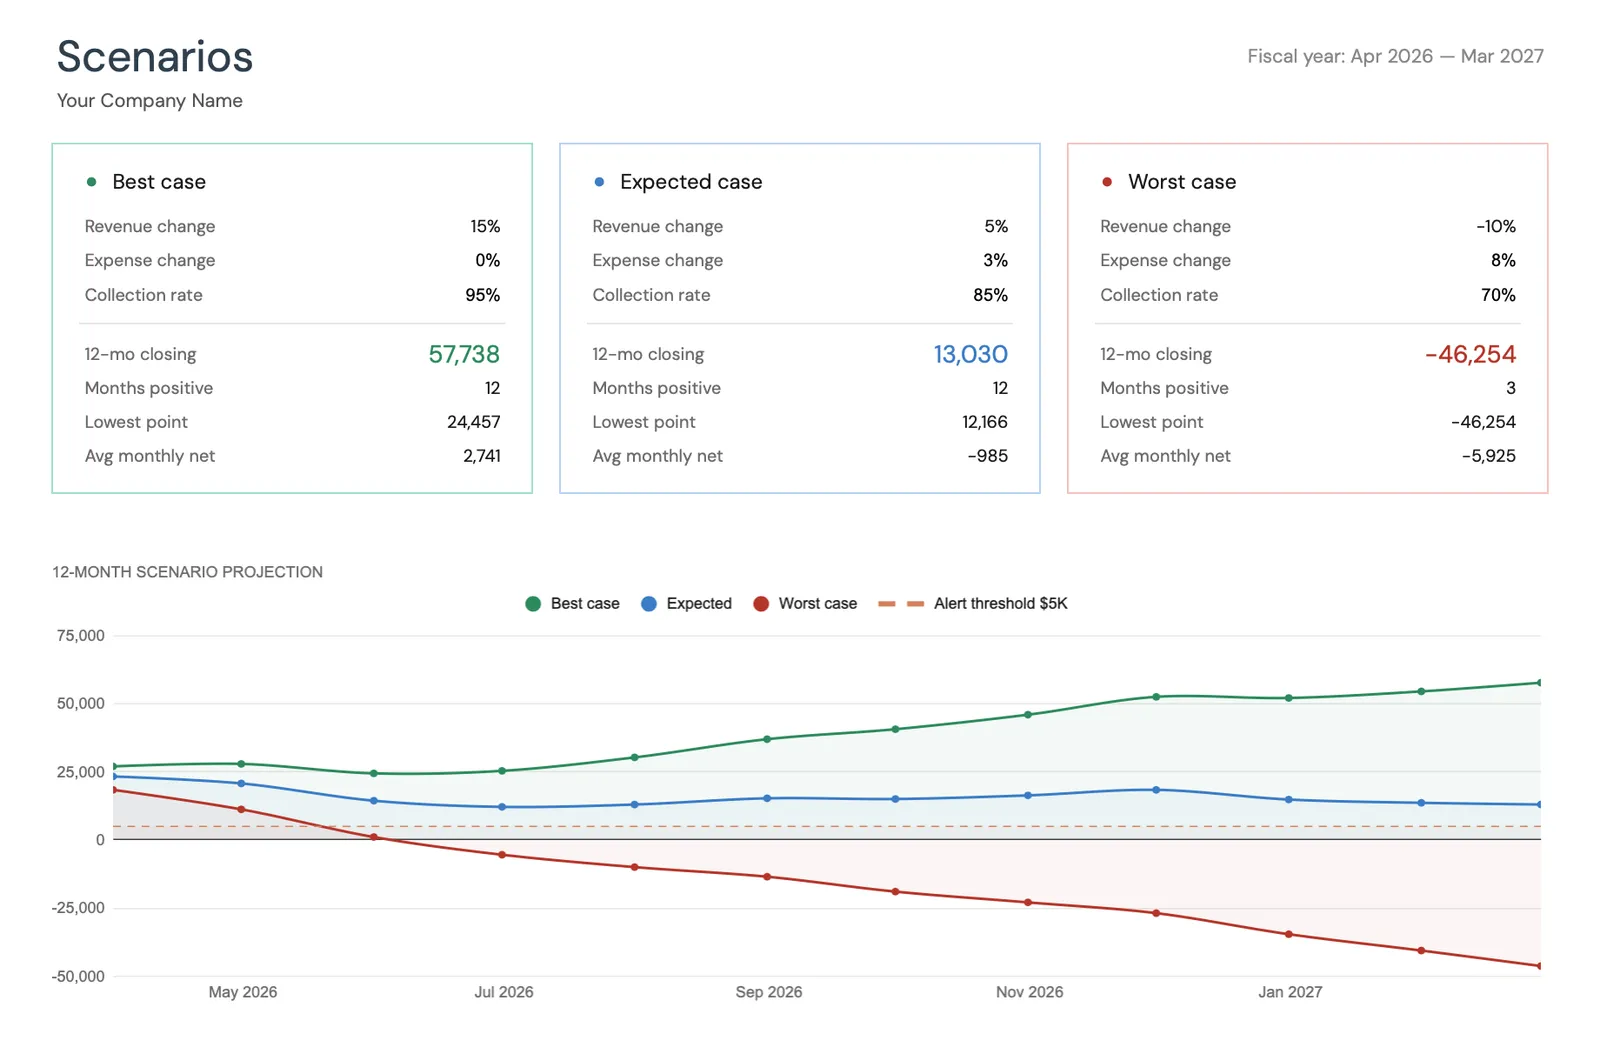
Project cash flow 12 months ahead
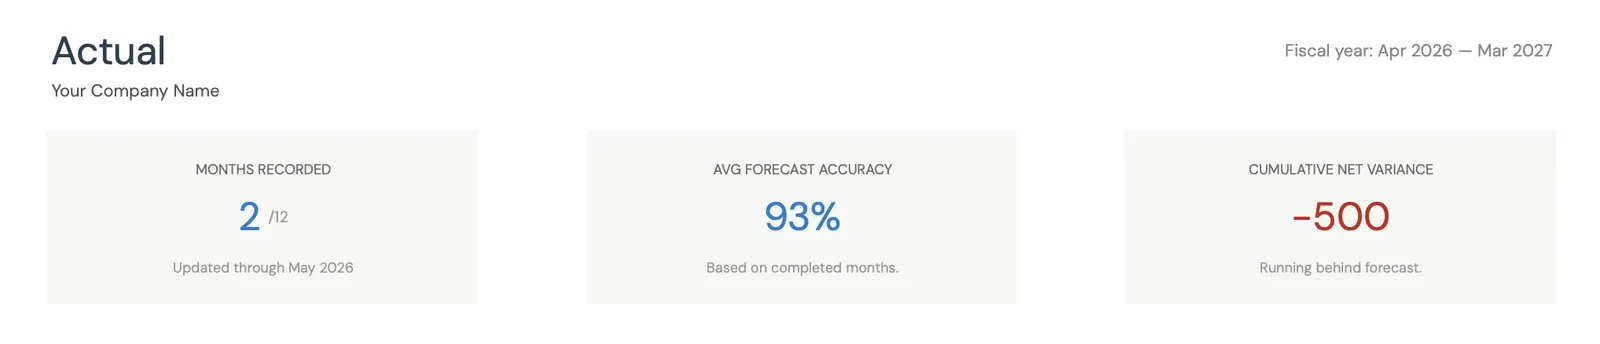
Key performance indicators for your cash flow
Model different scenarios for your business
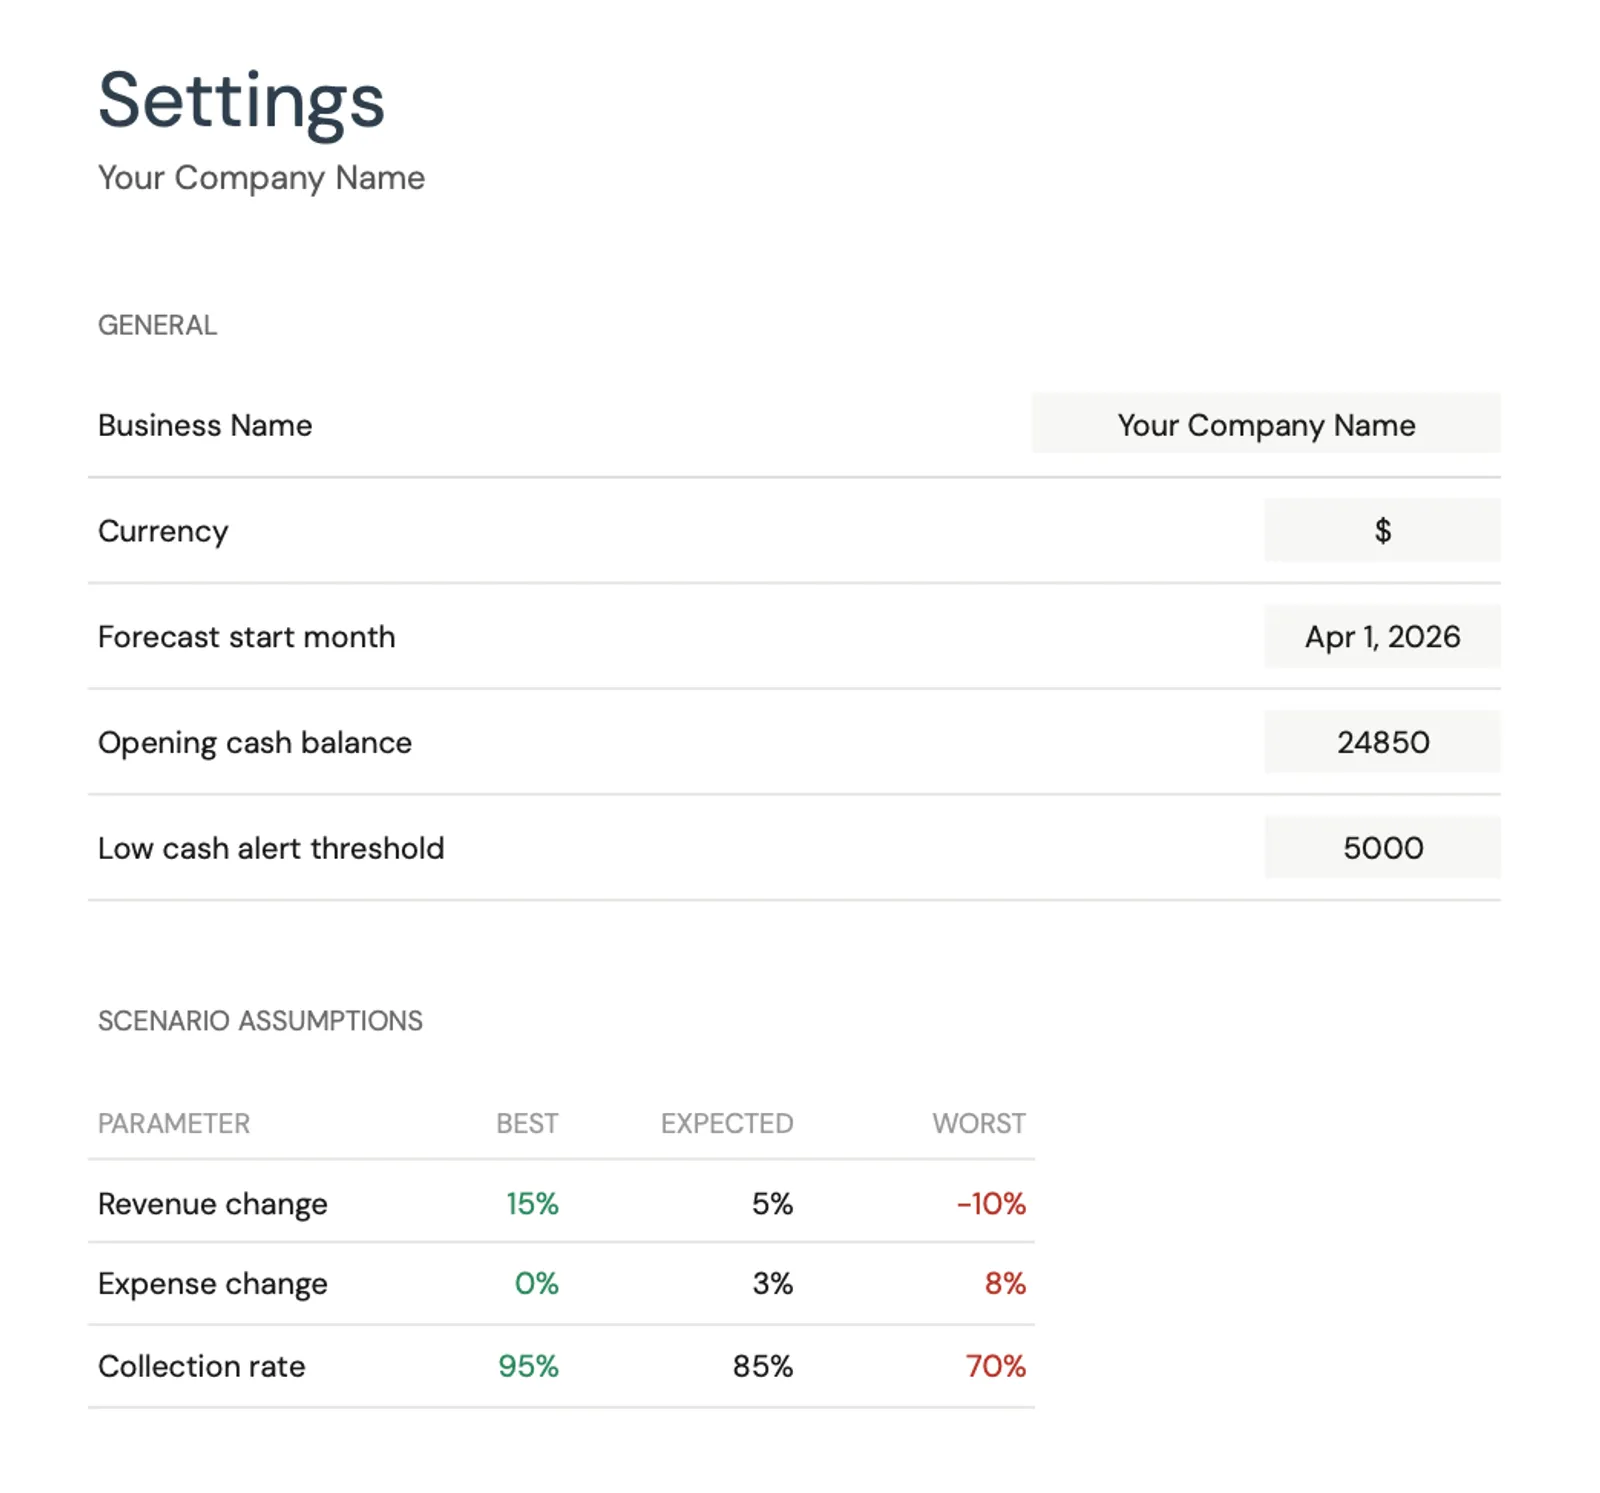
Customize categories for your business type
What You Get
How This Template Supports Food Truck Finances
Location-based revenue tracking
Track revenue by location and day to identify your most profitable spots and days. Over time, this data informs scheduling decisions and helps you drop underperforming locations.
Seasonal revenue modeling
Build seasonal patterns into the 12-month forecast. Food trucks often see 2-3x revenue during peak months versus slow months. The template helps plan cash reserves during peaks to fund off-season operations.
Weather-adjusted actual vs forecast view
Compare projected revenue and expenses against actuals. For food trucks, the biggest variance drivers are weather and event performance. Tracking actuals improves the accuracy of future seasonal projections.
Four-season cash flow outlook
See your projected cash position across all seasons. Identify when reserves will be needed, plan major maintenance during slow periods, and decide whether off-season catering or events can supplement regular location revenue.
Common Questions
Cash Flow for Food Trucks - FAQ
What profit margin is typical for food trucks?
Net margins for food trucks typically range from 6-15%, with well-run operations targeting 10-12%. Margins are generally higher than sit-down restaurants due to lower rent and labor costs, but vehicle expenses and weather-driven revenue loss offset some of that advantage. Food cost should stay in the 28-35% range to maintain healthy margins.
How many operating days should I forecast per month?
Most food trucks operate 15-25 days per month during peak season and 10-15 days during the slow season. Rain days, maintenance, and commissary prep days reduce available operating time. Forecast conservatively - building in 2-3 non-operating days per month for weather and mechanical issues gives a more realistic cash projection.
How do I handle the off-season cash flow gap?
Calculate your monthly fixed costs during the off-season and compare against projected off-season revenue. The gap is what you need in reserves. Some food trucks supplement with catering, pop-ups in indoor venues, or farmers markets. The forecast helps you test whether these supplemental revenue streams close the gap or just reduce it.
Should I include event revenue in my baseline forecast?
Include confirmed events with known fees. For recurring events (weekly farmers markets, monthly food truck rallies), historical data provides a reliable basis. One-off events are less predictable - include them when confirmed but do not forecast unconfirmed events as certain revenue. A separate pipeline or "potential" line helps track opportunities without overstating projected cash.
How do I budget for vehicle repairs?
Set aside 5-10% of monthly revenue into a vehicle and equipment reserve fund. A food truck with $12,000 in monthly revenue might reserve $600-$1,200 per month. This builds a fund to cover major repairs ($3,000-$8,000) without disrupting operating cash flow. The forecast should show this reserve as a recurring expense, with occasional large withdrawals for actual repairs.
Can't find the answer you're looking for? Contact our team
Forecast cash flow for your food truck
One-time purchase. No subscription. Your financial data stays in your Google Drive.