Cash Flow Forecast
Cash Flow Forecast Template for E-commerce / Shopify Stores
Forecast online sales revenue, plan inventory purchases, track advertising spend, and manage payment processor timing - all in a Google Sheets template built for cash flow management.
In Depth
Revenue and Timing in Online Retail
E-commerce cash flow has a paradox at its core - the faster a store grows, the more cash it needs. Every dollar of growth typically requires buying more inventory weeks or months before that inventory generates revenue. Add advertising spend that hits the credit card immediately while the resulting sales trickle in over days and weeks, and growth can actually make the bank balance go down even as the business gets healthier on paper.
The cash conversion cycle - how long it takes for a dollar spent on inventory to return as a dollar collected from a customer - varies enormously across e-commerce niches. A print-on-demand store with no inventory might have a cycle of just a few days. A brand importing products from overseas manufacturers might wait 90-120 days from purchase order to customer payment. That difference fundamentally shapes how each business needs to think about cash management.
Holiday season preparation is where e-commerce cash flow gets most intense. Inventory for November and December sales typically needs to be ordered in August or September, creating the largest cash outlay of the year during what is often one of the lower revenue months. Then January brings a wave of returns - sometimes 20-30% of holiday sales - that reduces incoming cash while the credit card bills from inventory purchases come due.
Platform diversification adds another layer. Selling through your own website, Amazon, wholesale accounts, and perhaps retail partnerships means managing multiple payment schedules, fee structures, and return policies. Each channel has its own cash flow personality. Some operators find that a channel generating lower margins actually improves overall cash flow because of faster payment terms or lower return rates.
The Challenge
Cash Flow Challenges for E-commerce Stores
E-commerce businesses deal with a unique cash flow paradox: growth requires spending money on inventory and ads before revenue arrives. The faster you grow, the more cash you need upfront. Understanding these dynamics helps you scale without running dry.
Inventory ties up cash for weeks or months
An e-commerce store might spend $20,000 on inventory that takes 60-90 days to sell through. If you are ordering from overseas manufacturers, lead times stretch to 3-4 months. That means cash goes out in January for inventory that generates revenue in April or May. A product that sells slowly ties up capital that could fund better-performing SKUs. Inventory management directly determines cash flow health.
Ad spend precedes revenue by days or weeks
Most e-commerce businesses spend 15-30% of revenue on advertising. The catch: you pay for ads immediately (or within days), but the resulting sales revenue takes time to collect. Factor in payment processor holds (2-7 days), potential chargebacks, and the reality that not every ad dollar converts to a sale. During scaling phases, ad spend can spike well ahead of revenue growth.
Payment processors and platforms create timing gaps
Shopify payments settle in 2-3 business days. PayPal can hold funds for new accounts. Amazon pays sellers every two weeks. Each platform has its own settlement schedule, reserve policies, and fee structure. If you sell across multiple channels, tracking when money actually hits your bank account - versus when a sale was made - becomes a genuine accounting challenge.
Seasonal demand creates boom-and-bust cash cycles
Many e-commerce businesses generate 30-40% of annual revenue during Q4 holiday season. Preparing for that peak means purchasing inventory 2-3 months early - a massive cash outlay in August and September when revenue is at its lowest. Post-holiday, returns eat into January revenue while credit card bills from inventory purchases come due. This seasonal whipsaw is the defining cash flow challenge for product-based online businesses.
Start forecasting your cash flow
Forecasting Guide
How to Forecast Cash Flow for Your E-commerce Store
E-commerce cash flow forecasting centers on the timing gap between spending (inventory, ads) and collecting (payment settlements). Here is how to structure it using the Cash Flow Forecast template.
Revenue Categories
- Direct website sales (net of returns and chargebacks)
- Amazon / marketplace revenue (net of fees)
- Wholesale / B2B orders
- Subscription / recurring revenue
- Gift card sales
Expense Categories
- Inventory purchases (COGS)
- Shipping and fulfillment (3PL, postage, packaging)
- Advertising spend (Meta, Google, TikTok)
- Platform fees (Shopify subscription, app costs)
- Payment processing fees (2.5-3.5% of revenue)
- Returns and refund costs
- Warehouse or storage rent
- Staff (customer service, operations, marketing)
- Software and tools (email, analytics, inventory management)
- Product photography and content creation
- Insurance (product liability, business)
- Sales tax remittance
Cash Flow Timing
E-commerce cash flow depends on your inventory cycle. Calculate your cash conversion cycle: days of inventory on hand + days to collect payment - days of payables. If you hold 60 days of inventory, collect payment in 3 days, and pay suppliers in 30 days, your cash cycle is 33 days. Every dollar of revenue requires 33 days of cash funding. The forecast needs to model inventory purchases 2-3 months ahead of expected sales.
See It In Action
What the template looks like
Browse through the template to see dashboards, forecasting, actuals tracking, and scenario planning.
- Visual cash flow dashboard
- Forecast vs actuals comparison
- Scenario planning tools
- Customizable categories

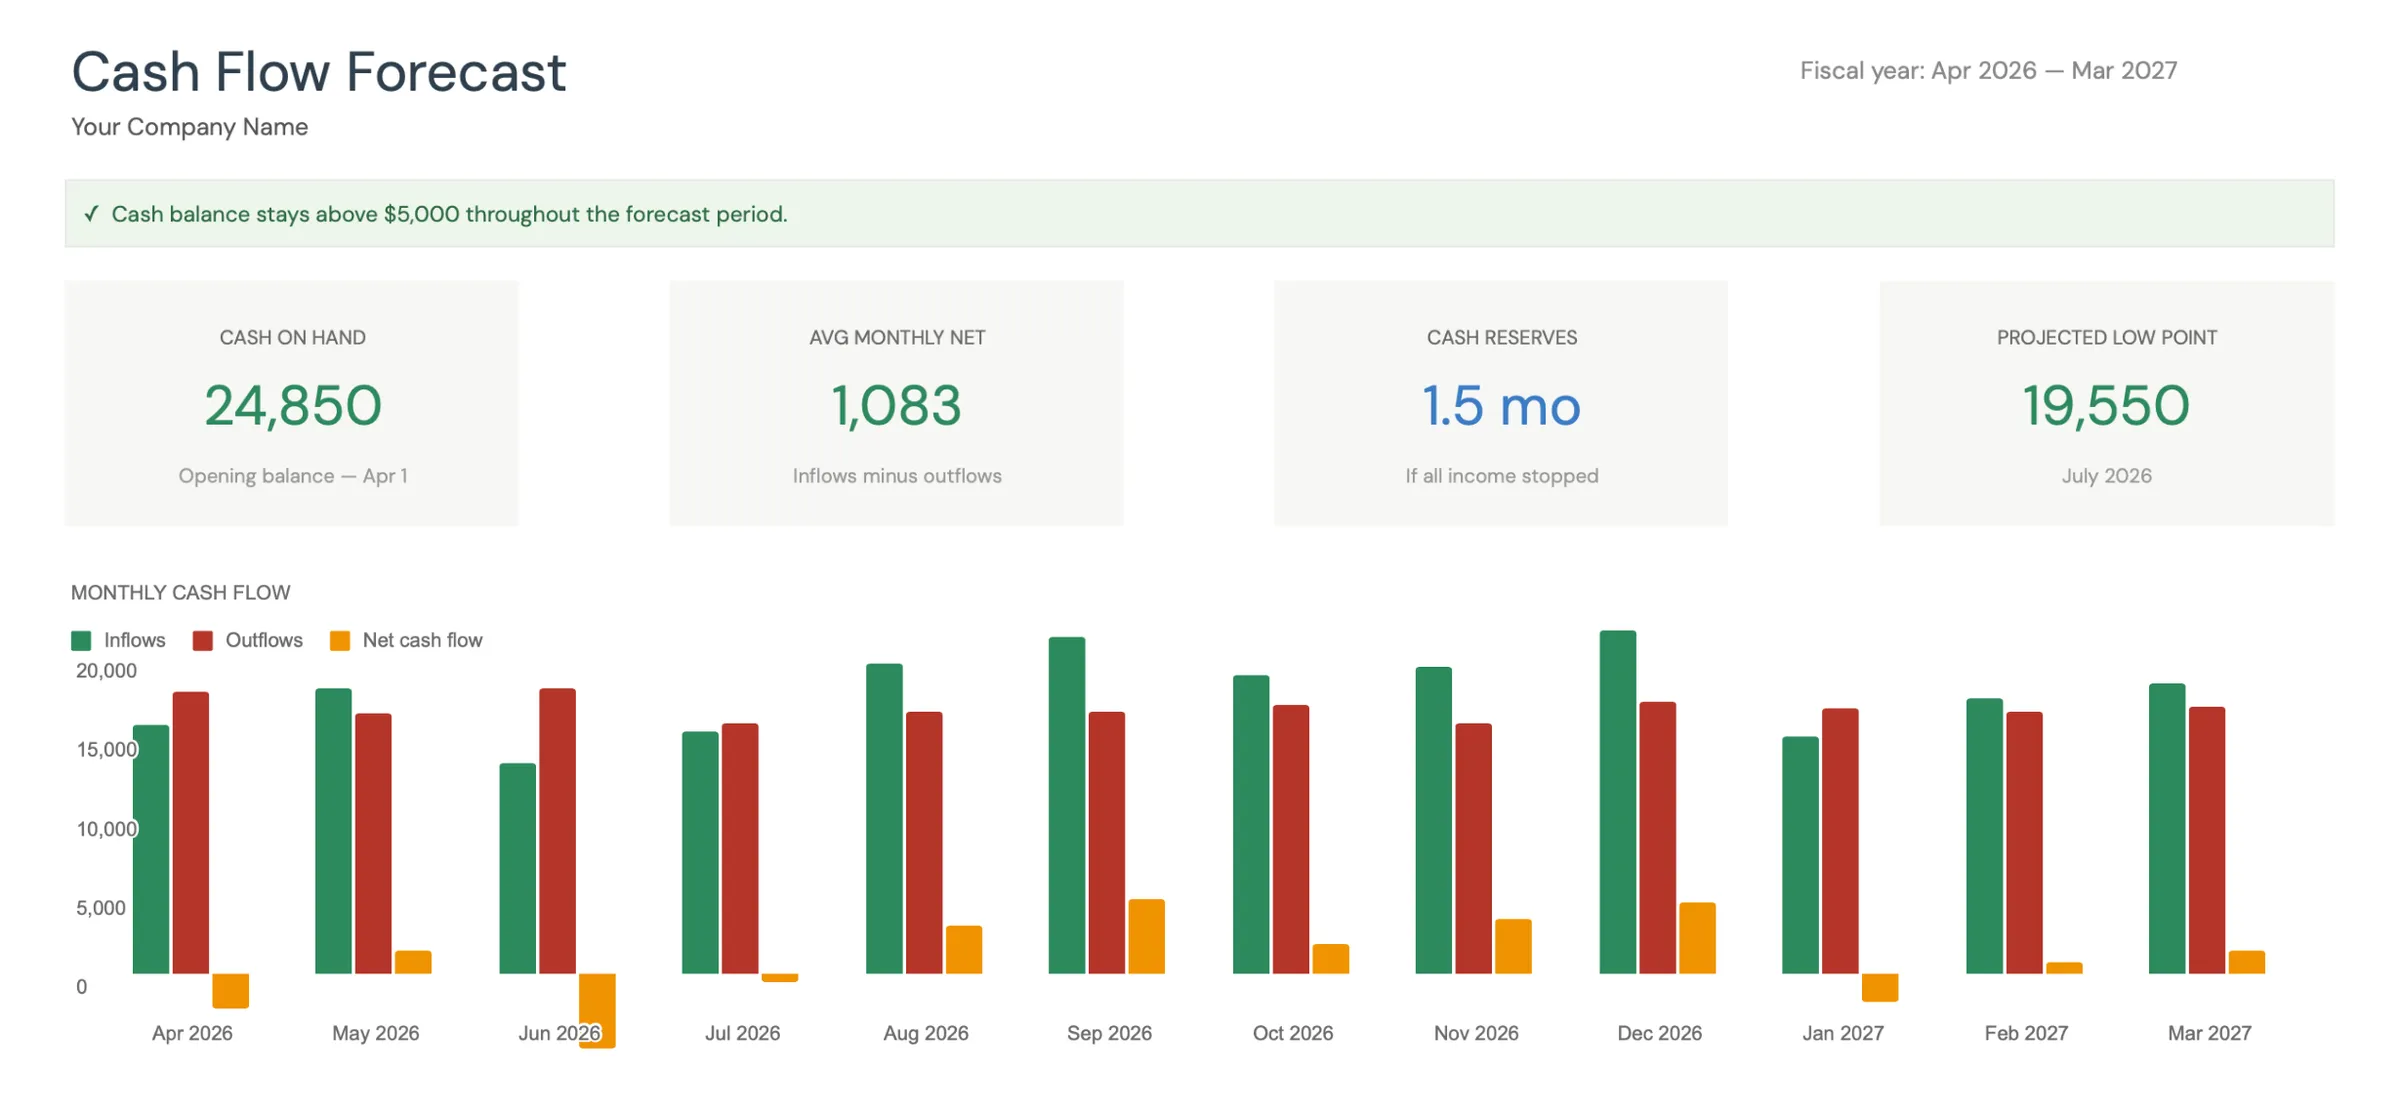
Monthly cash flow overview with KPIs and charts
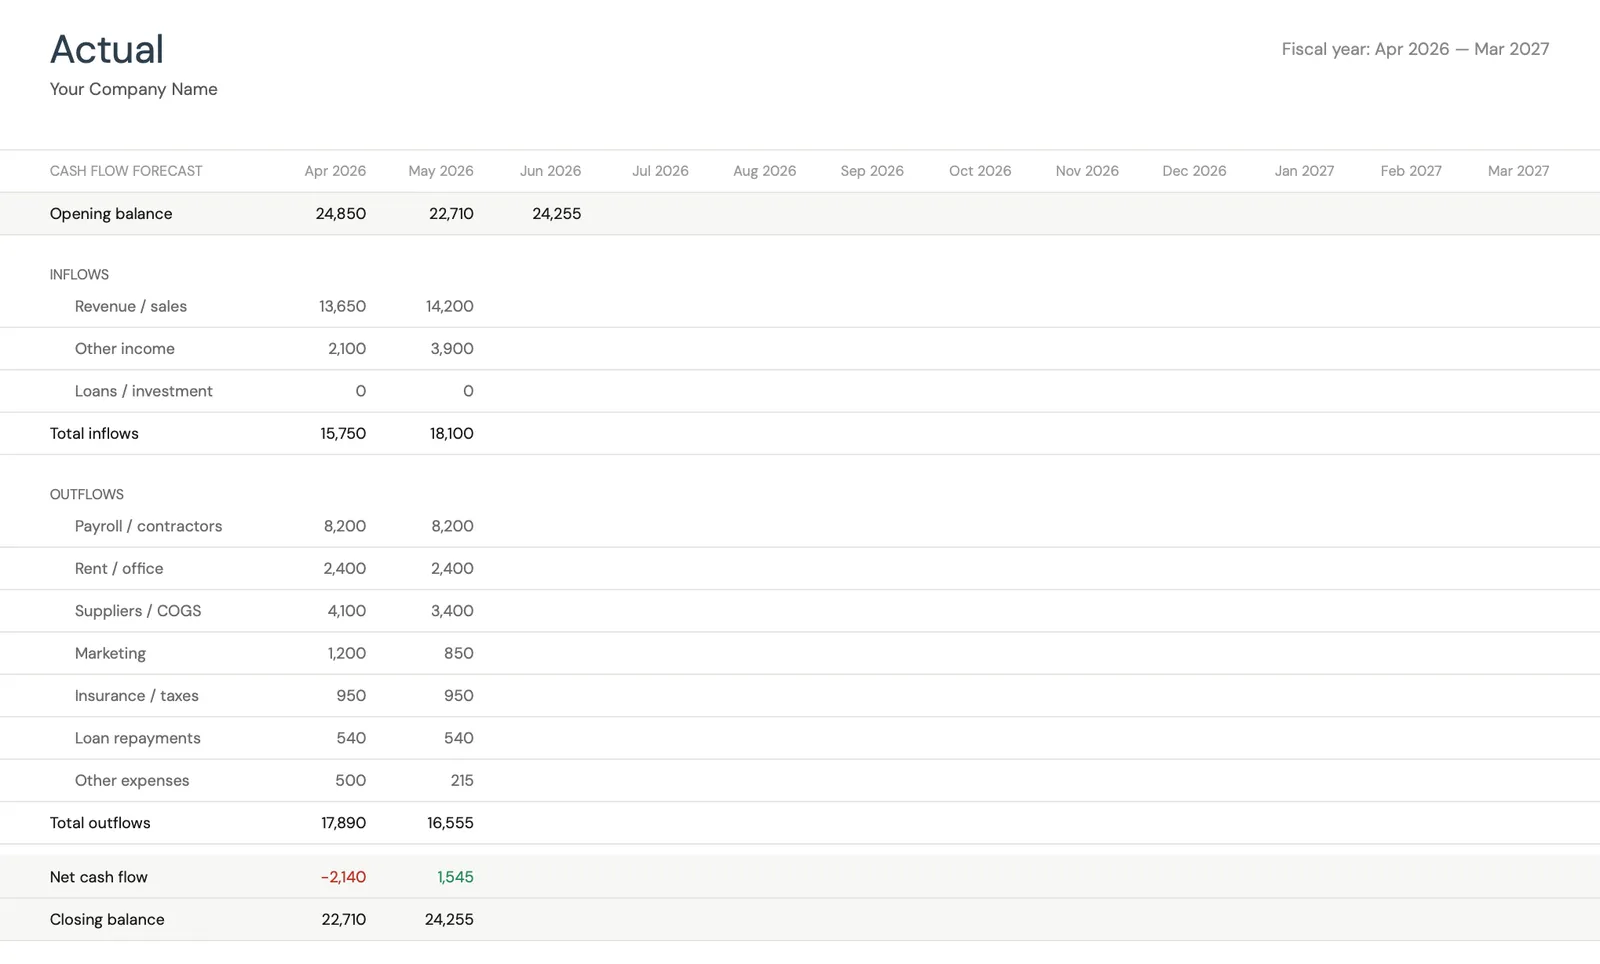
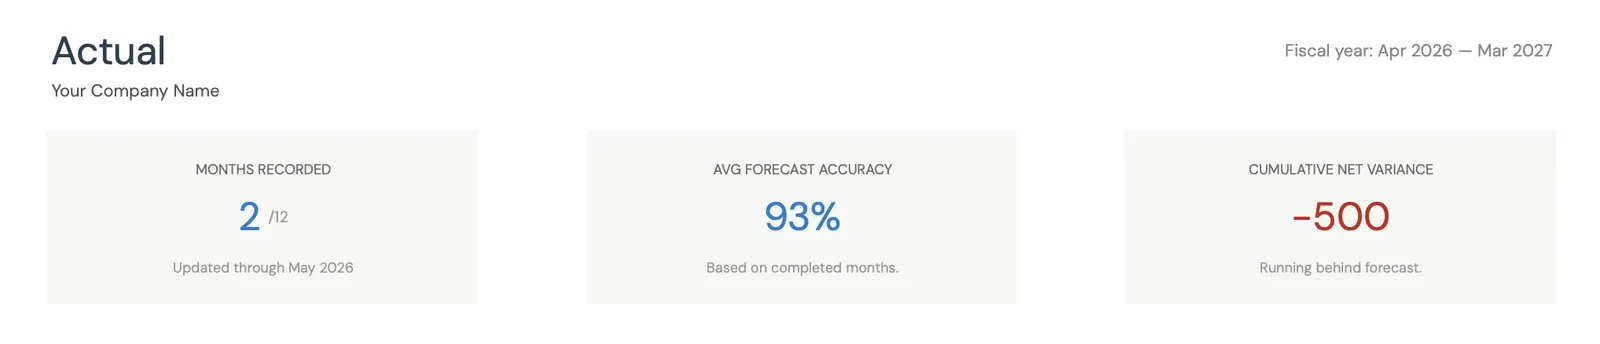
Track actual cash flow against your forecast
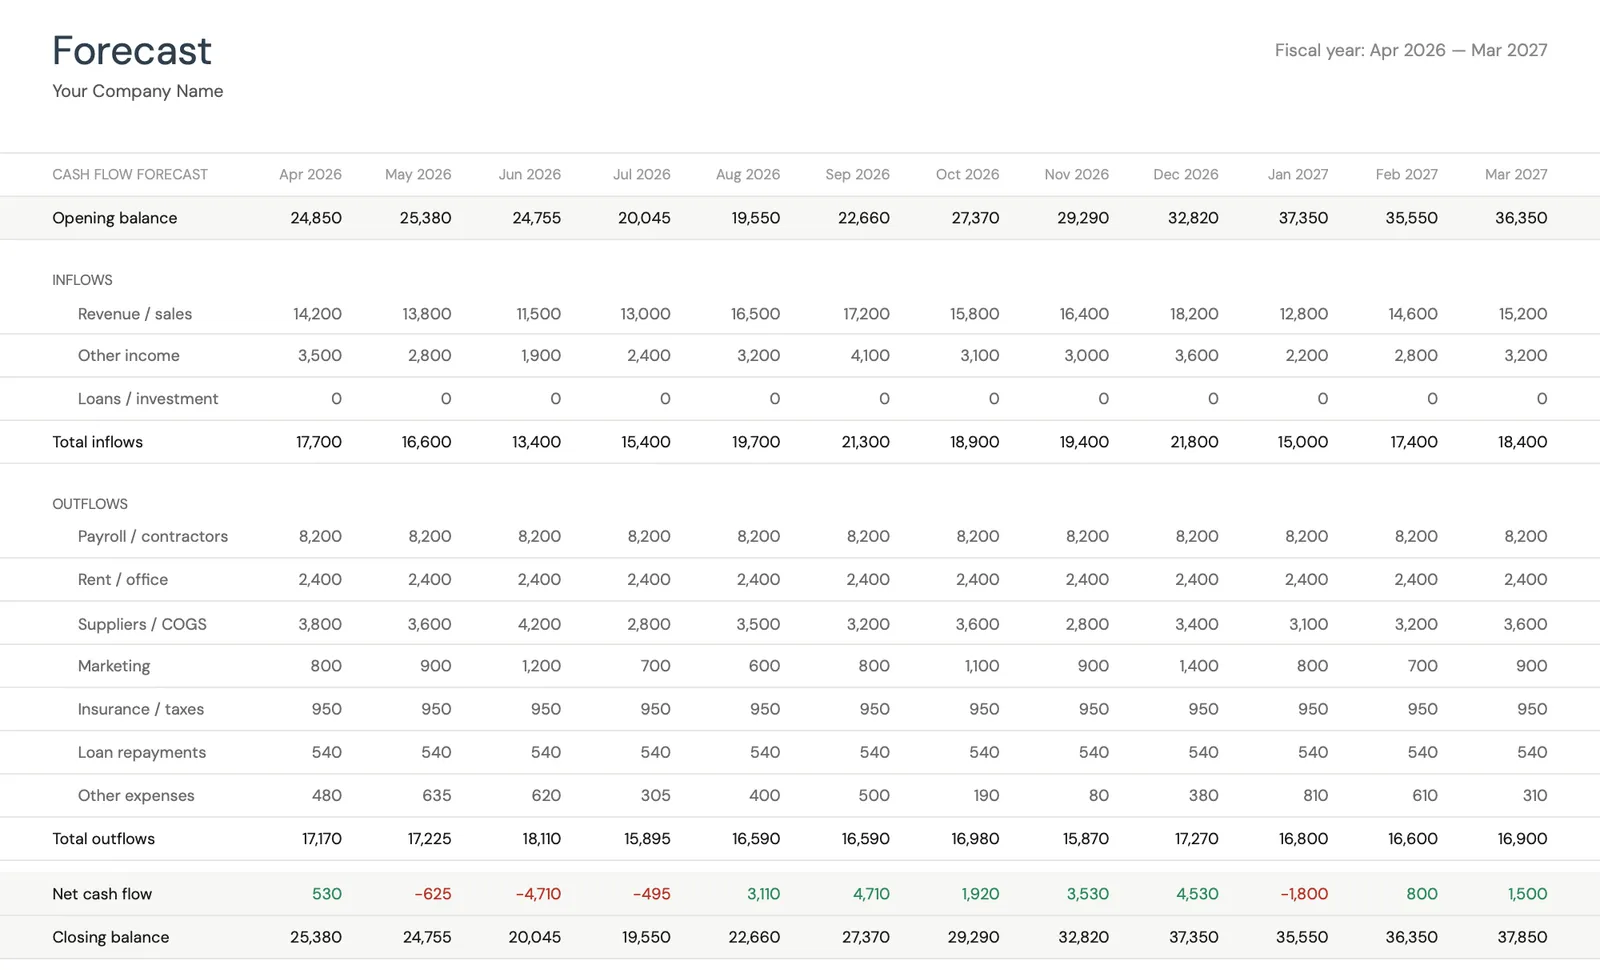
Project cash flow 12 months ahead
Key performance indicators for your cash flow
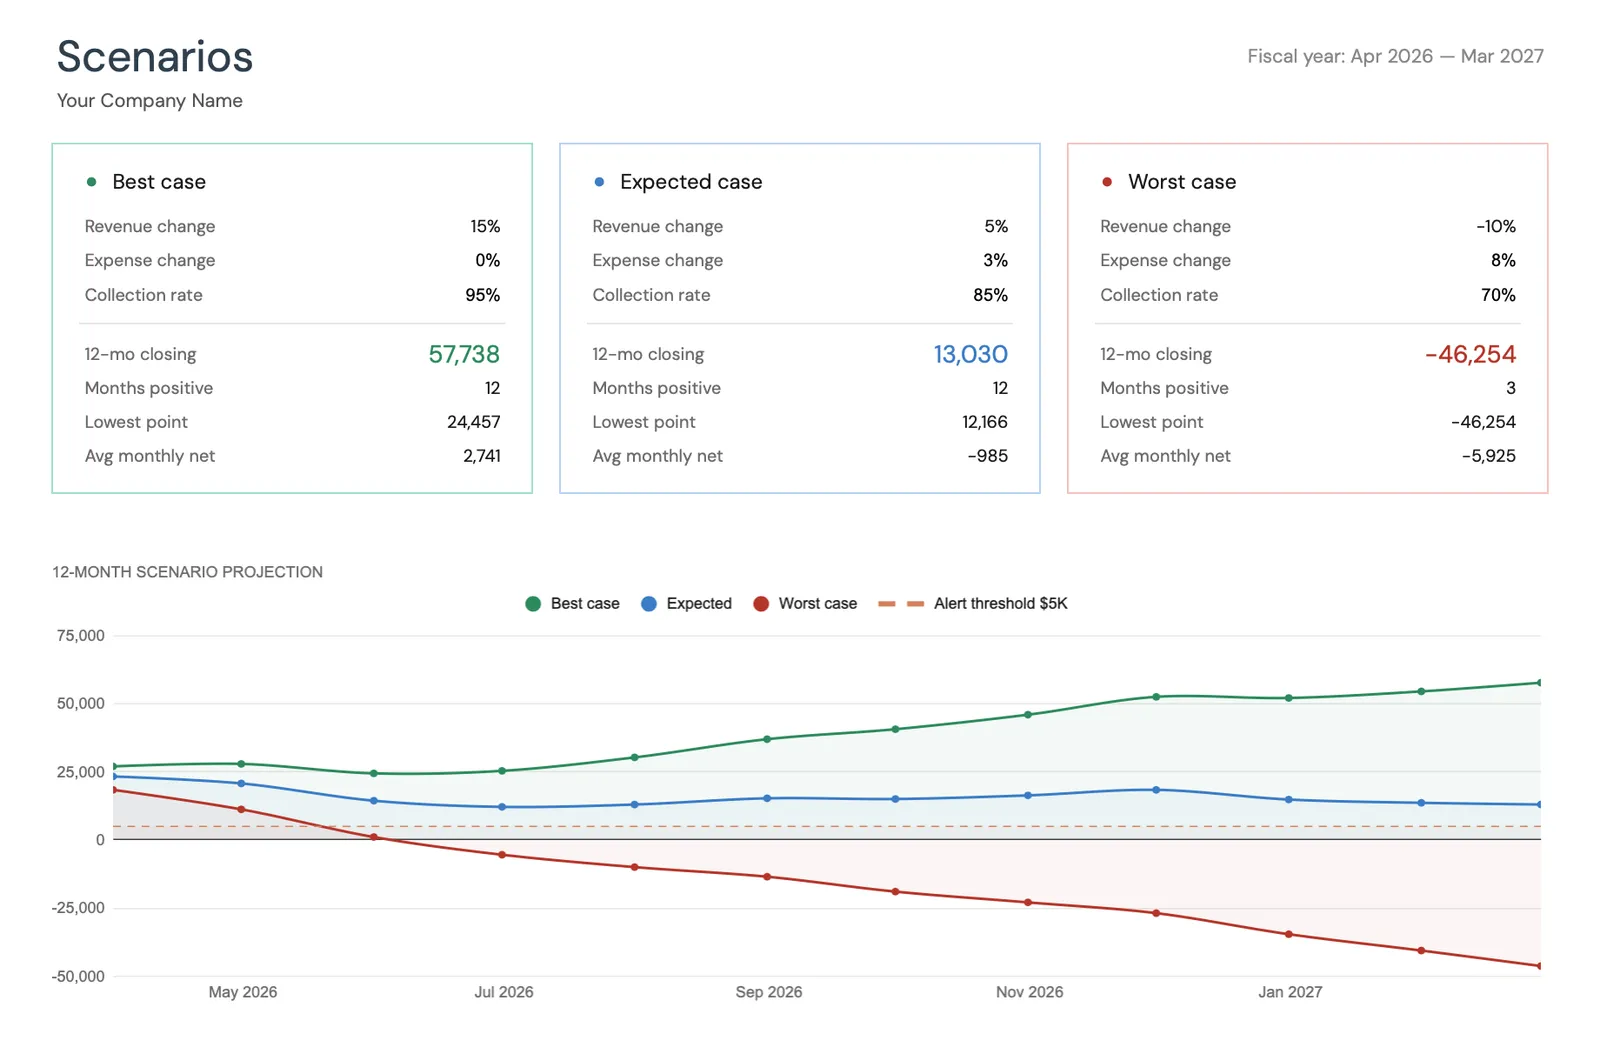
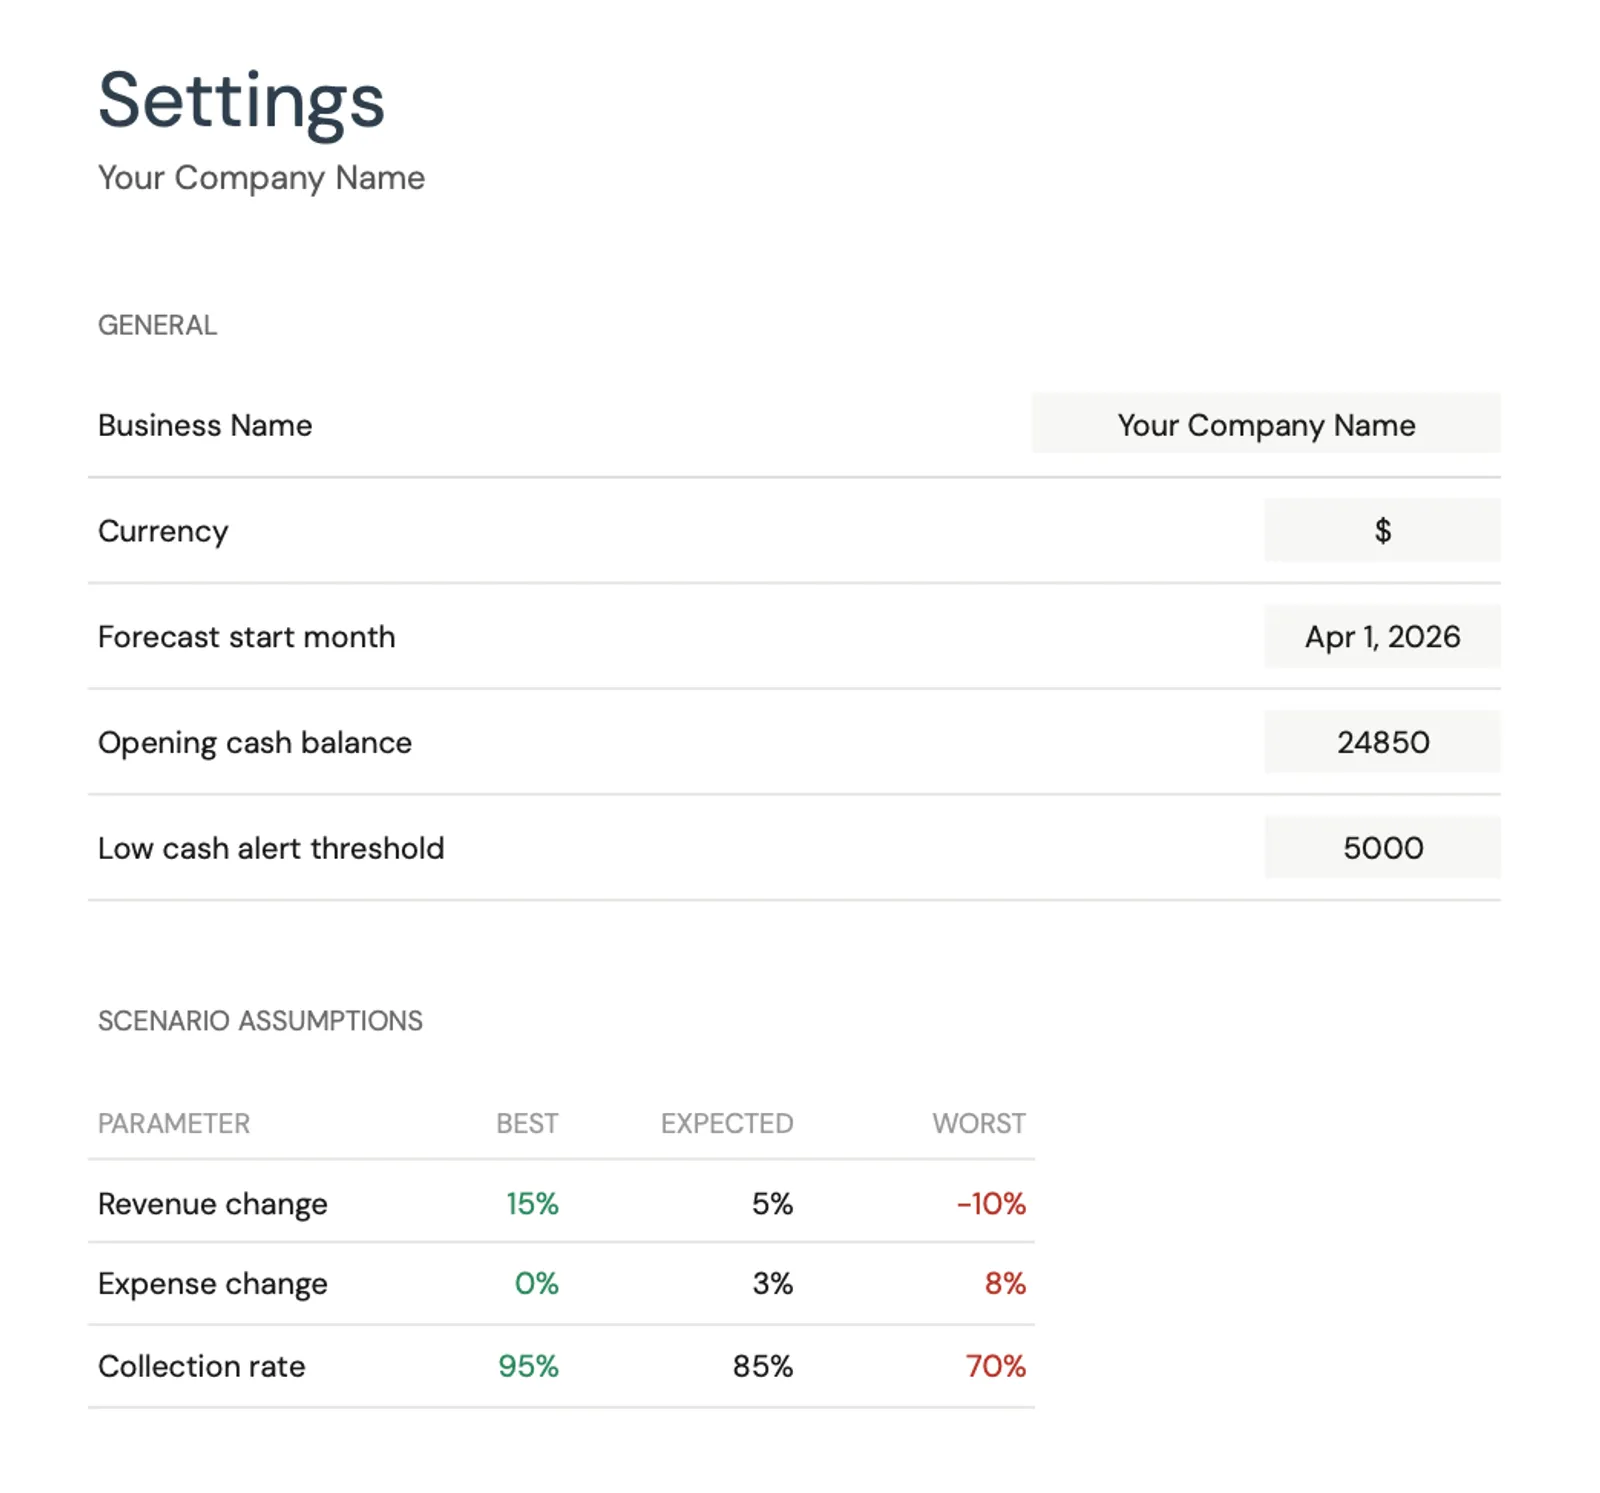
Model different scenarios for your business
Customize categories for your business type
What You Get
E-commerce Cash Flow Tools Inside the Template
Revenue by sales channel
Track revenue from your website, Amazon, wholesale, and other channels separately. Each channel has different margins, fee structures, and payment timing - lumping them together hides important cash flow differences.
Inventory purchase planning
Map planned inventory purchases against projected sales. The template helps visualize the cash outlay months before revenue arrives, so you can plan financing or adjust order quantities accordingly.
Real sales numbers against your forecast
Compare forecasted sales and expenses against actuals. E-commerce data is highly measurable - use conversion rates, average order values, and return rates to refine your forecast each month.
12-month seasonal cash flow projection
Essential for seasonal businesses. See how Q4 inventory purchases affect Q3 cash position, and whether Q1 returns will create a January cash crunch. Plan your cash reserves and financing needs months ahead.
Common Questions
Cash Flow for E-commerce / Shopify Stores - FAQ
What profit margins are typical for e-commerce businesses?
Gross margins (revenue minus COGS) typically range from 40-65% for branded products and 20-35% for resold goods. Net margins after all expenses (ads, shipping, platform fees, overhead) usually land between 5-15% for healthy e-commerce businesses. These figures vary enormously by product category, pricing strategy, and ad efficiency.
How do I forecast for my first holiday season?
Research industry benchmarks for your product category - many see 2-4x normal monthly sales in November and December. Work backward from your sales target: how much inventory do you need, when must you order it, and what ad budget supports those sales? The forecast helps you calculate the total cash outlay and determine if you need financing to bridge the gap.
How do I handle multiple sales channels in the forecast?
Set up separate revenue lines for each channel (website, Amazon, wholesale). Each has different fee structures, payment timing, and return rates. Amazon might pay every two weeks with 15% fees, while your website processes daily with 3% fees. The template aggregates these into your total cash position.
What about returns - how do I forecast those?
E-commerce return rates average 15-30% depending on category (apparel is higher, consumables lower). Forecast returns as a negative revenue line, typically lagging sales by 2-4 weeks. Also factor in the cost of processing returns - shipping, restocking, and any unsalvageable inventory that becomes a total write-off.
How often should I update my e-commerce cash flow forecast?
Monthly at minimum, but biweekly during high-growth phases or peak season. E-commerce businesses generate real-time sales data, so updating the forecast is straightforward. The key is updating inventory projections and ad spend plans as actual performance data comes in.
Can't find the answer you're looking for? Contact our team
Forecast cash flow for your e-commerce / shopify store
One-time purchase. No subscription. Your financial data stays in your Google Drive.