Cash Flow Forecast
Cash Flow Forecast Template for Daycare / Childcare
Forecast enrollment-based revenue, manage staffing ratio requirements, track licensing and compliance costs, and plan for seasonal enrollment changes - all in a Google Sheets template built for cash flow management.
In Depth
Revenue, Ratios, and the Economics of Childcare
Childcare centers operate under financial constraints that few other businesses face - legally mandated staffing ratios that determine costs regardless of how the owner would prefer to manage them. When a state requires one caregiver for every four infants, there is no negotiating that number down during a slow week. This regulatory floor on labor costs means childcare margins are structurally thin, and the difference between a profitable center and one losing money often comes down to maintaining enrollment within a few children of capacity.
The age-group economics within a single center can vary dramatically. Infant care rooms, with their strict ratios and higher staffing requirements, often operate at lower margins than preschool rooms where one teacher can supervise eight or ten children. Some center operators find that infant care barely breaks even while the preschool program generates the majority of the profit. Understanding which classrooms contribute to cash flow and which consume it helps in making decisions about expansion, pricing, and marketing priorities.
Government subsidy programs introduce a financial dynamic that many childcare operators describe as both essential and challenging. Subsidies can represent 20-50% of a center's revenue, providing access to families who could not otherwise afford care. But subsidy payments arrive on a different timeline than private tuition - often 30 to 60 days after the service month - and at rates that are typically below private-pay rates. The cash flow impact of a growing subsidy population is more revenue but slower collection and lower per-child income.
Summer enrollment changes are the seasonal pattern that childcare operators plan around. School-age programs lose 20-40% of enrollment as families shift to camps and vacation schedules. Even infant and toddler rooms may see 10-15% dips as families take vacations. The revenue drop arrives in June and persists through August, while fixed costs - rent, administrative staff, insurance - continue unchanged. Centers that plan for this annual dip by building reserves during the high-enrollment school year months tend to navigate summer with less financial stress.
The Challenge
Cash Flow Challenges for Daycare and Childcare Centers
Childcare centers operate with thin margins, strict staffing ratios mandated by regulation, and a revenue model that depends on maintaining full enrollment. These constraints create a cash flow environment with little room for error.
Revenue depends entirely on enrollment and attendance
A daycare with 60 spots at $250/week generates $15,000/week at full enrollment. But enrollment fluctuates with the school year, summer breaks, and family moves. Losing just 5 children drops weekly revenue by $1,250 while costs barely change. Most centers maintain 85-95% enrollment - the difference between 85% and 95% on a 60-child center is $1,500/week or $6,000/month in revenue. Getting and keeping enrollment near capacity is the primary cash flow challenge.
Mandated staff-to-child ratios create rigid labor costs
State licensing requires specific staff-to-child ratios (typically 1:4 for infants, 1:10 for school-age). These are not guidelines - they are legal requirements. A center cannot reduce staff below ratio minimums even if enrollment drops temporarily. If the infant room requires 3 staff for 12 children, losing 2 children still requires 3 staff (for 10 children at 1:4 ratio). Staff costs represent 55-70% of childcare revenue, making this the largest and most inflexible expense.
Government subsidy payments are delayed and complex
Many childcare centers accept government childcare subsidies, which can represent 20-50% of revenue. These subsidies often pay 30-60 days after service and at rates below private-pay tuition. Processing delays, paperwork requirements, and rate changes create unpredictable payment timing. A center waiting on $8,000 in subsidy payments while payroll is due faces a genuine cash crunch.
Summer enrollment drops while costs persist
School-age programs often see enrollment drop 20-40% during summer as families take vacations or switch to camp programs. Infant and toddler rooms are typically more stable but may still see 10-15% summer drops. The revenue decline is seasonal and predictable, but the center still needs to maintain staffing, rent, and insurance. Centers that do not plan for this annual dip may struggle to make June-August payrolls.
Start forecasting your cash flow
Forecasting Guide
How to Forecast Cash Flow for Your Daycare or Childcare Center
Childcare cash flow forecasting starts with enrollment projections and staffing requirements. Here is how to structure it using the Cash Flow Forecast template.
Revenue Categories
- Private-pay tuition (by age group)
- Government subsidy payments
- Registration and enrollment fees
- Before/after school program fees
- Summer program revenue
- Late pickup and other fees
Expense Categories
- Teacher and caregiver wages
- Director and administrative salaries
- Payroll taxes and benefits
- Rent or mortgage
- Utilities
- Food and snacks
- Educational supplies and curriculum
- Insurance (liability, workers' comp)
- Licensing fees and compliance costs
- Cleaning and sanitation supplies
- Background checks and staff training
- Playground maintenance and equipment
Cash Flow Timing
Tuition is typically collected weekly or monthly in advance, making cash flow timing relatively predictable for private-pay families. Government subsidies introduce a 30-60 day lag. The key timing challenge is the summer enrollment dip: revenue drops in June through August while staffing costs remain near peak levels. Build cash reserves during full-enrollment months (September-May) to fund the summer gap.
See It In Action
What the template looks like
Browse through the template to see dashboards, forecasting, actuals tracking, and scenario planning.
- Visual cash flow dashboard
- Forecast vs actuals comparison
- Scenario planning tools
- Customizable categories

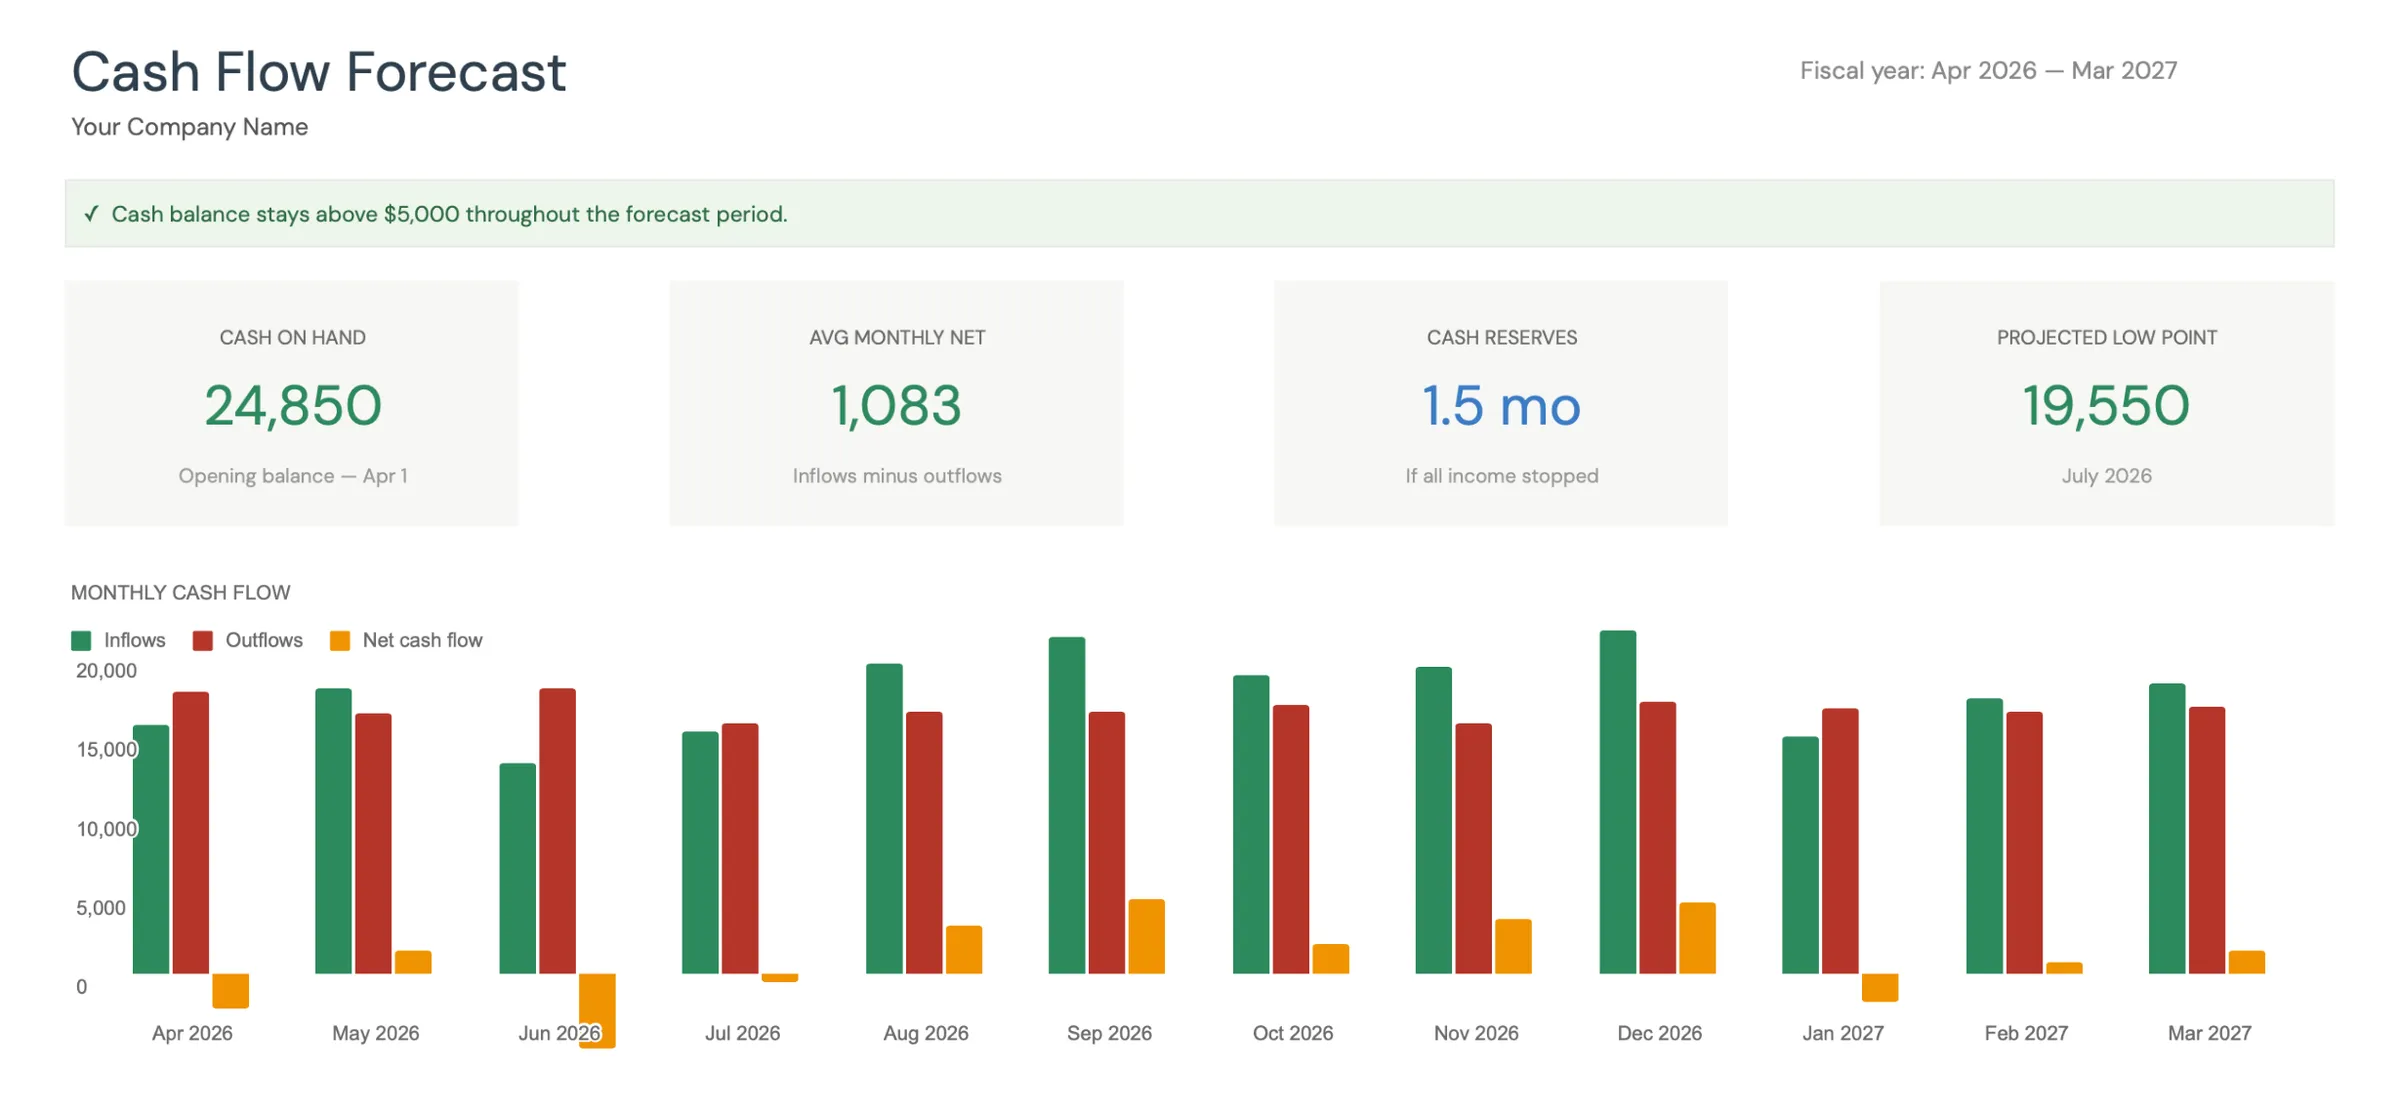
Monthly cash flow overview with KPIs and charts
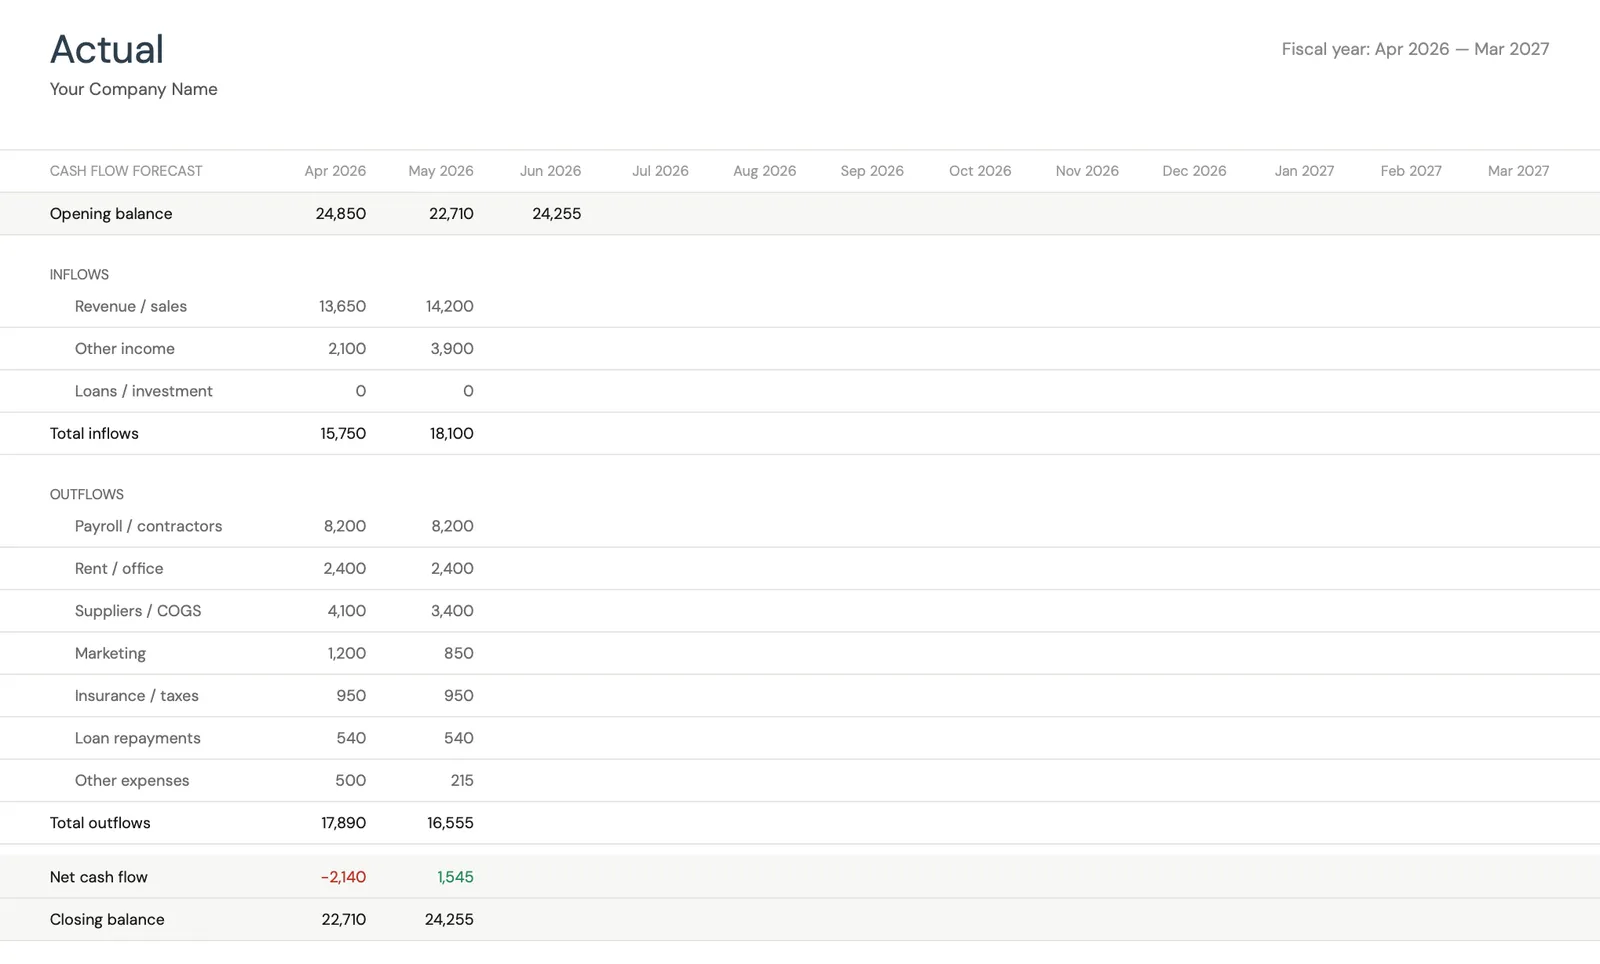
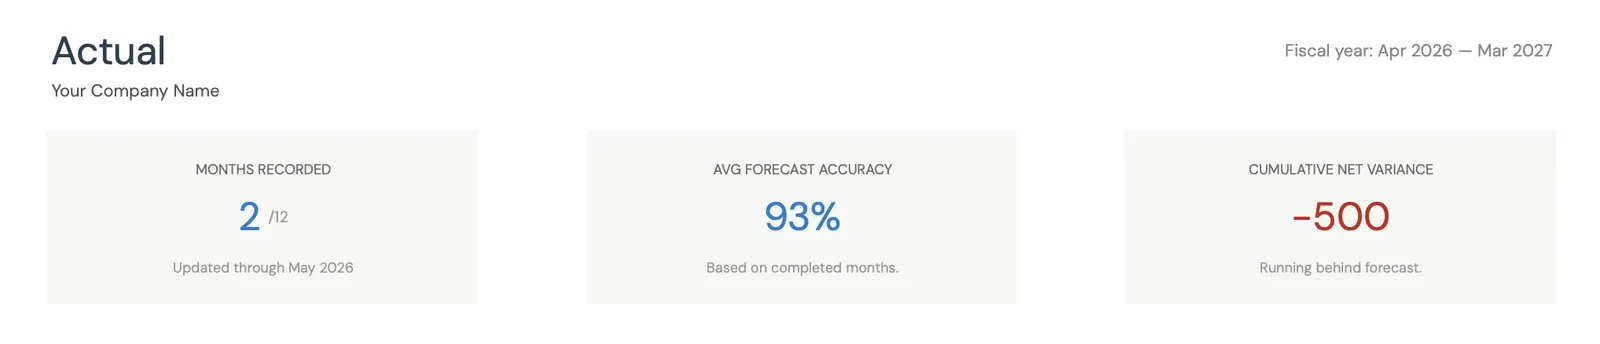
Track actual cash flow against your forecast
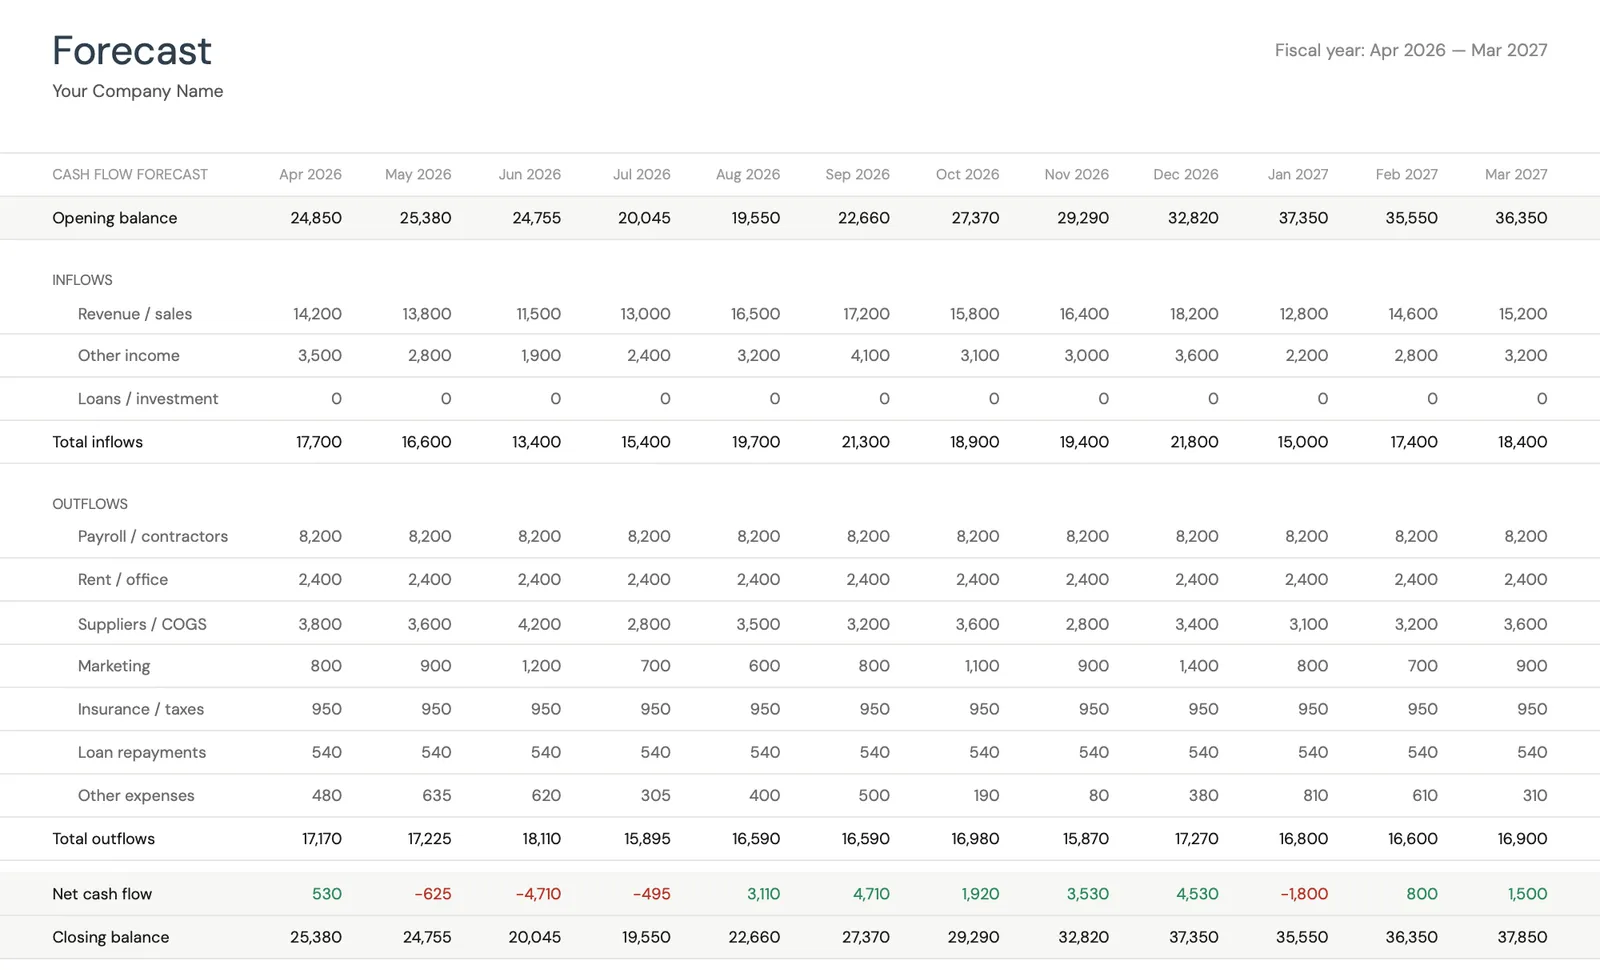
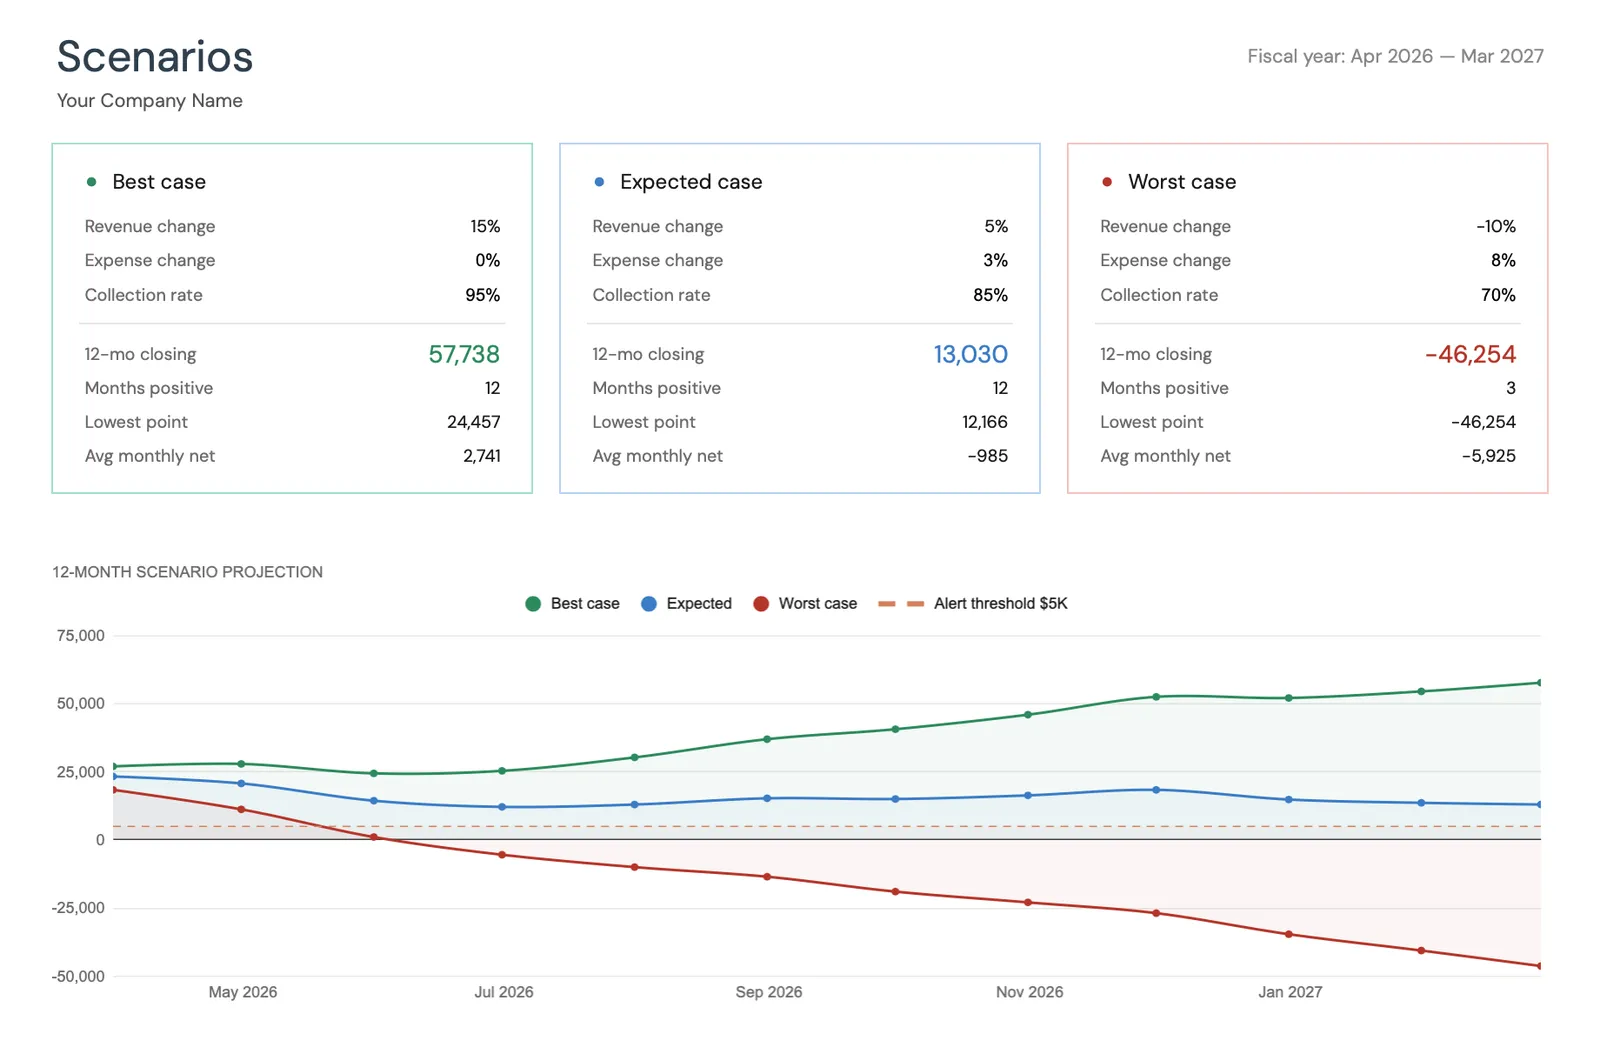
Project cash flow 12 months ahead
Key performance indicators for your cash flow
Model different scenarios for your business
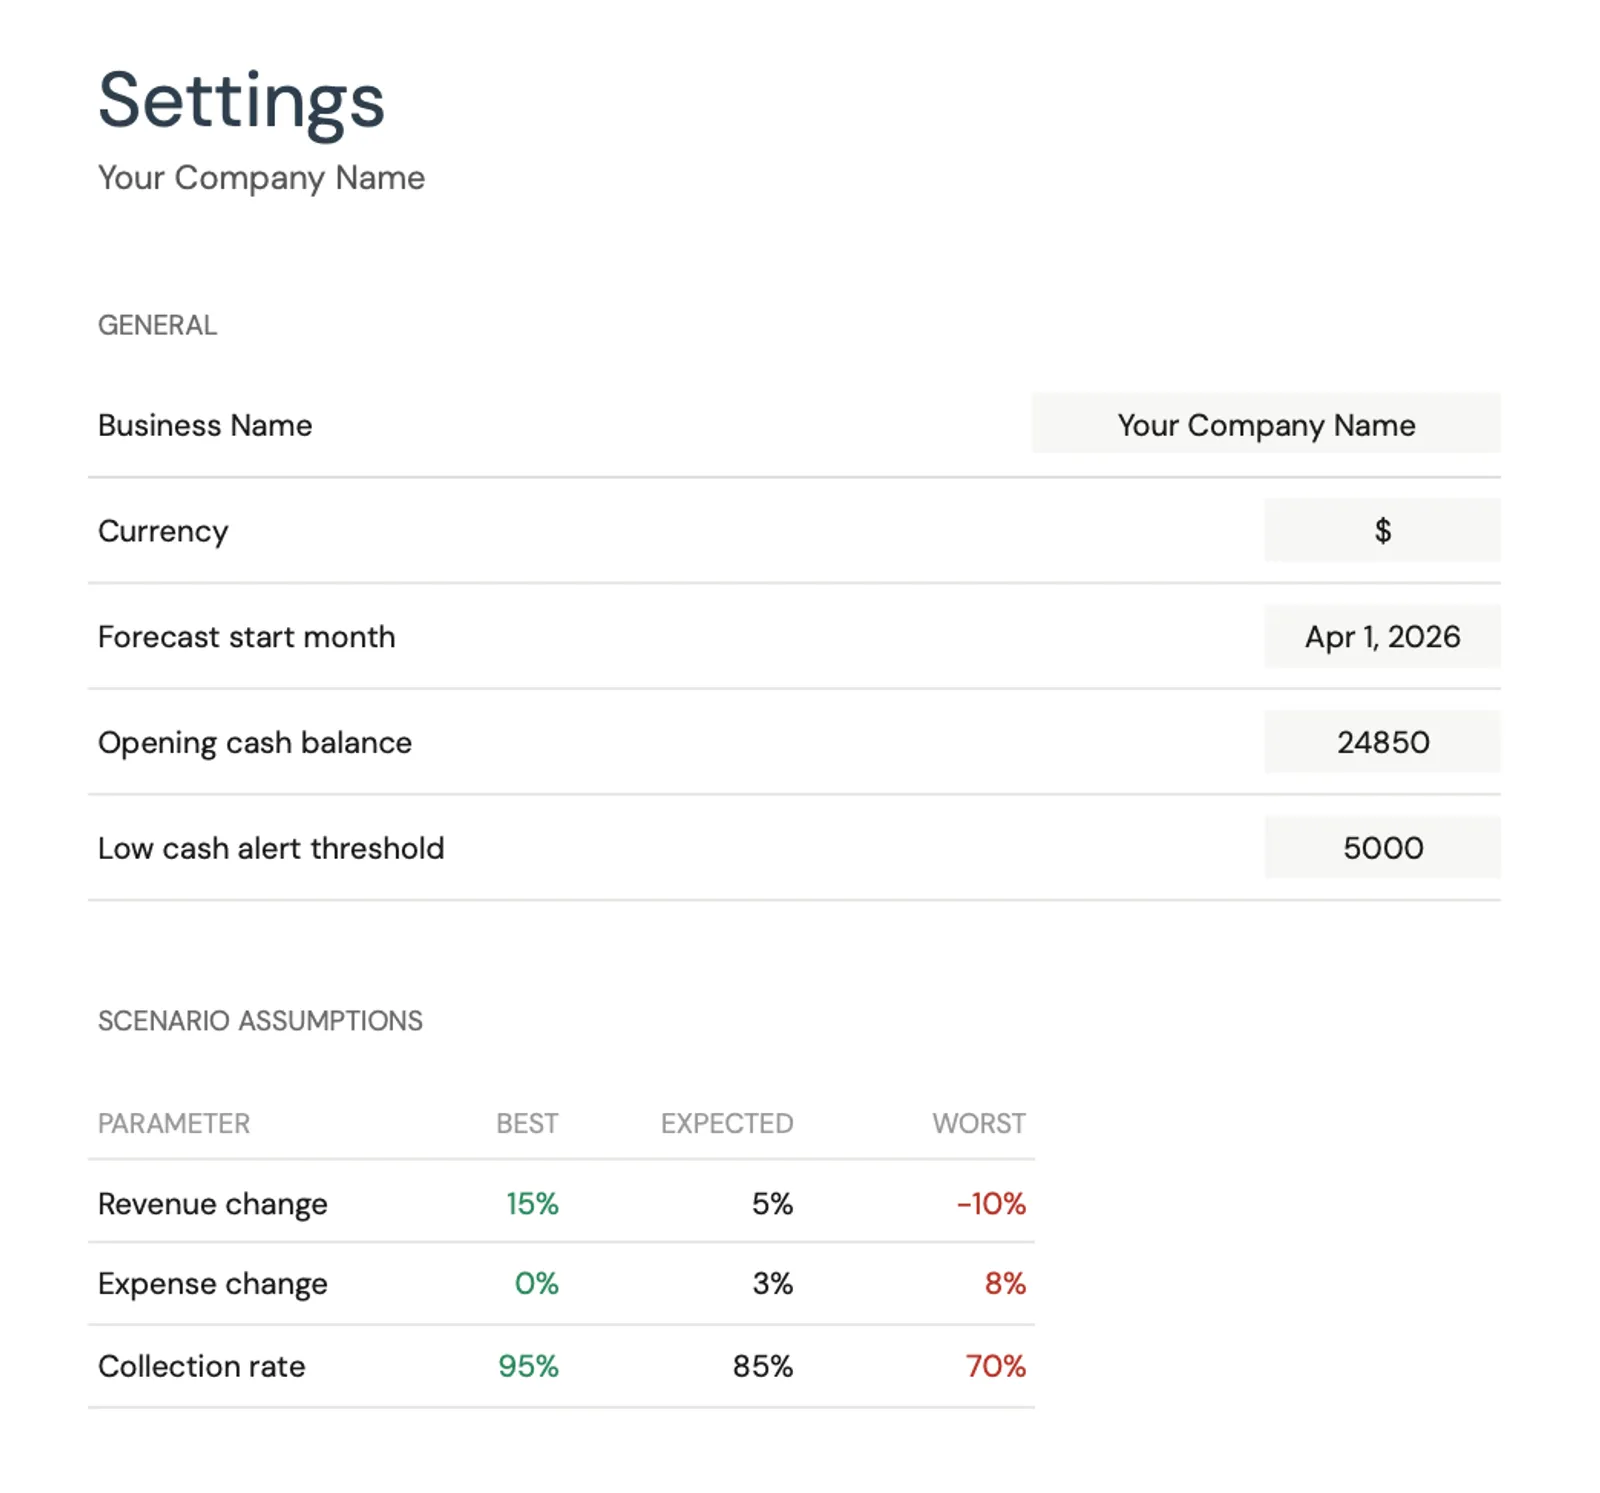
Customize categories for your business type
What You Get
What Daycare and Childcare Centers Get With This Template
Enrollment-based revenue tracking
Track enrollment by age group and payment type (private-pay vs subsidy). Since revenue is directly tied to headcount, monitoring enrollment trends is the most important forecasting input. Even small enrollment changes have outsized cash flow impact.
Staffing ratio compliance
Map staffing levels against enrollment to ensure ratio compliance while avoiding overstaffing. The forecast helps plan hiring and schedule adjustments as enrollment fluctuates seasonally.
Enrollment and subsidy timing vs plan
Compare projected enrollment and revenue against actuals. Track subsidy payment timing to build realistic collection assumptions. If subsidies consistently arrive 45 days late, the forecast should reflect that reality.
Full enrollment cycle cash forecast
See your projected cash position through the full enrollment cycle. Plan for the summer dip, back-to-school enrollment surge, and any planned program expansions against your projected cash position.
Common Questions
Cash Flow for Daycare / Childcare - FAQ
What profit margin is typical for daycare centers?
Net margins for childcare centers typically range from 5-15%. Centers operating at full enrollment with efficient staffing can achieve the upper end, while those below 85% enrollment often operate near breakeven. The tight margins reflect the labor-intensive nature of childcare and regulatory staffing requirements. Infant care rooms often have the lowest margins due to stricter staff ratios.
How do I plan for the summer enrollment drop?
Calculate the revenue difference between full enrollment (September-May) and expected summer enrollment. If monthly revenue drops from $65,000 to $50,000 for three months, you need $45,000 in reserves or summer revenue offsets (camps, summer programs). The forecast helps determine the required monthly reserve contribution during the school year to cover the summer gap.
How do I handle government subsidy payment delays?
Track average subsidy payment timing by program. If payments typically arrive 45 days after the service month, forecast that lag consistently. Maintain a working capital buffer equal to 1-2 months of subsidy revenue to absorb timing variations. If subsidies represent $12,000/month, a $12,000-$24,000 buffer prevents late payments from causing payroll problems.
When should I consider expanding capacity?
The forecast helps answer this by modeling the financial impact of expansion. If you are consistently at 95%+ enrollment with a waitlist, the forecast can model additional rooms or locations. Key variables: time to reach breakeven enrollment in the new space, upfront renovation costs, additional staff needed from day one, and the cash reserves required to fund the ramp-up period.
How do I manage the balance between part-time and full-time enrollment?
Part-time enrollment fills spots but at lower revenue per slot. A spot generating $200/week full-time might generate $120/week from two part-time children splitting the slot. Track revenue per available slot (not just per child) to assess the true cash flow impact. The forecast should reflect your actual enrollment mix and its impact on both revenue and staffing requirements.
Can't find the answer you're looking for? Contact our team
Forecast cash flow for your daycare / childcare
One-time purchase. No subscription. Your financial data stays in your Google Drive.