Cash Flow Forecast
Cash Flow Forecast Template for Churches / Ministries
Forecast giving patterns, track facility and staff costs, manage ministry program budgets, and plan for seasonal giving cycles - all in a Google Sheets template built for cash flow management.
In Depth
Generosity, Giving Cycles, and Church Finances
Church finances rest on a foundation unlike any other organization - voluntary giving. No invoices are sent, no services are billed, and no contracts obligate members to contribute. This means cash flow is ultimately shaped by the generosity and financial circumstances of the congregation, both of which can shift in ways that are difficult to predict. A strong economy and growing membership tend to lift giving; a recession or the departure of a few key giving families can reduce it quickly.
The concentration of giving among a relatively small group of households is a financial reality that many church leaders find uncomfortable but important to understand. In many congregations, 20% of giving households provide 60-80% of total revenue. This is not inherently problematic, but it does mean the departure or financial setback of even one or two major giving families can have an outsized impact. Some churches track giving trends at the aggregate level - not individual amounts - to identify shifts before they become cash flow problems.
Facility costs represent the most significant fixed obligation for most churches, and they persist regardless of giving levels. A church building with a $10,000 monthly mortgage payment, $3,000 in utilities, and $2,000 in maintenance and insurance needs $15,000 each month just for the building - before a single staff member is paid or a single program is funded. When giving dips seasonally - as it reliably does in summer - these fixed facility costs become the largest pressure point on cash flow.
The December giving surge and summer giving dip create an annual financial rhythm that experienced church administrators learn to plan around. Year-end giving, driven by both holiday generosity and tax planning, often exceeds the monthly average by 25-40%. Summer giving, affected by travel and reduced attendance, typically falls 10-20% below average. The cash accumulated in December and January often needs to sustain operations through June and July, making the annual cycle one of building and drawing down reserves.
The Challenge
Cash Flow Challenges for Churches and Ministries
Churches rely primarily on voluntary giving, which fluctuates with attendance, economic conditions, and seasonal patterns. Managing cash flow when revenue is entirely based on generosity creates unique challenges.
Giving is seasonal with significant monthly variation
Most churches see giving peak in December (year-end giving) and dip in summer when attendance drops. The difference between the highest and lowest giving months can be 30-40%. A church receiving $40,000/month in average giving might see $55,000 in December and $28,000 in July. These swings are predictable in pattern but not in magnitude, making it hard to match expenses to revenue month by month.
A small percentage of givers contribute most of the budget
In many churches, 20% of giving households contribute 60-80% of total giving. If one or two major givers relocate, change financial circumstances, or reduce giving, the impact on total revenue is immediate and significant. A household giving $2,000/month represents $24,000/year - losing two such families creates a $48,000 annual gap that may take years to replace through new giving.
Facility costs are substantial and fixed
Church buildings come with significant fixed costs: mortgage or rent (often the largest expense), utilities, maintenance, insurance, and property taxes (if applicable). A building worth $1-2 million might cost $8,000-$15,000/month in total carrying costs. These costs persist regardless of attendance or giving levels. Deferred maintenance on aging buildings creates the risk of sudden, expensive repairs.
Ministry programs expand during giving peaks and contract during dips
The temptation during high-giving months is to expand programs and commitments. But programs that launch during December giving levels need to be sustainable at July giving levels. Staff hired during a giving surge become fixed costs that persist through giving dips. Forecasting helps distinguish between sustainable program expansion and overextension based on temporary giving peaks.
Start forecasting your cash flow
Forecasting Guide
How to Forecast Cash Flow for Your Church or Ministry
Church cash flow forecasting starts with giving trend analysis and fixed cost mapping. Here is how to structure it using the Cash Flow Forecast template.
Revenue Categories
- Regular tithes and offerings
- Online giving
- Special offerings and designated gifts
- Building fund contributions
- Event and program fees
- Facility rental income
Expense Categories
- Pastoral and ministry staff salaries
- Administrative staff wages
- Payroll taxes and benefits
- Mortgage or rent
- Utilities (buildings often have high HVAC costs)
- Building maintenance and repairs
- Insurance (property, liability, workers' comp)
- Ministry program costs
- Missions and benevolence
- Music and worship expenses
- Technology (AV equipment, streaming, church management software)
- Office and administrative supplies
Cash Flow Timing
Giving patterns are weekly, with most receipts coming on Sundays. Monthly giving depends heavily on attendance - holiday weekends, summer vacations, and weather all affect Sunday attendance and giving. Online recurring giving (typically 20-40% of total giving for churches that have adopted it) provides a more stable base. Plan major expenses around months when giving is historically strong, and maintain reserves to cover summer and early-year giving dips.
See It In Action
What the template looks like
Browse through the template to see dashboards, forecasting, actuals tracking, and scenario planning.
- Visual cash flow dashboard
- Forecast vs actuals comparison
- Scenario planning tools
- Customizable categories

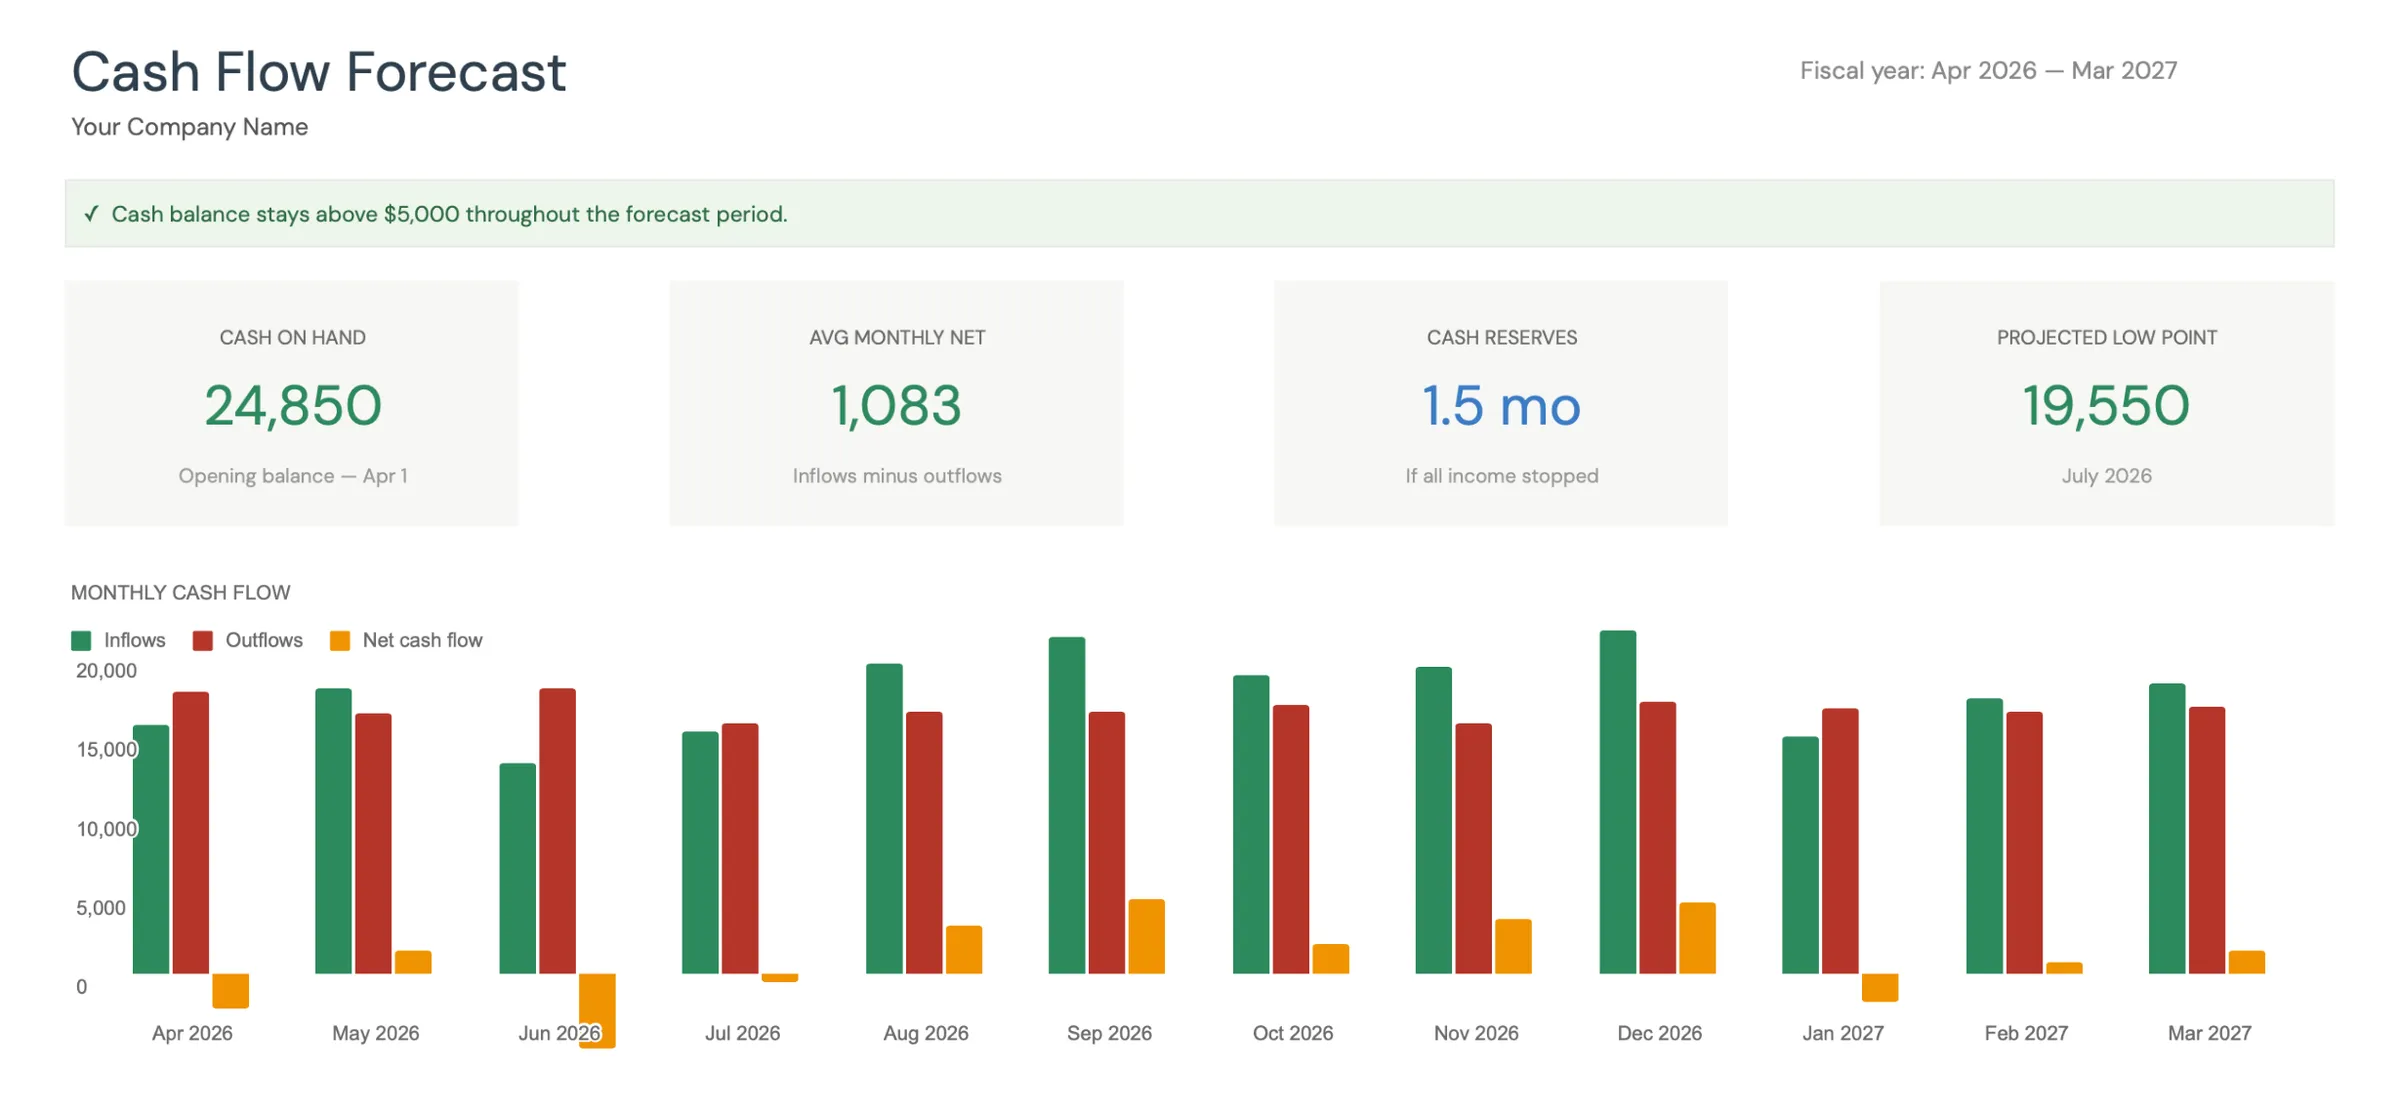
Monthly cash flow overview with KPIs and charts
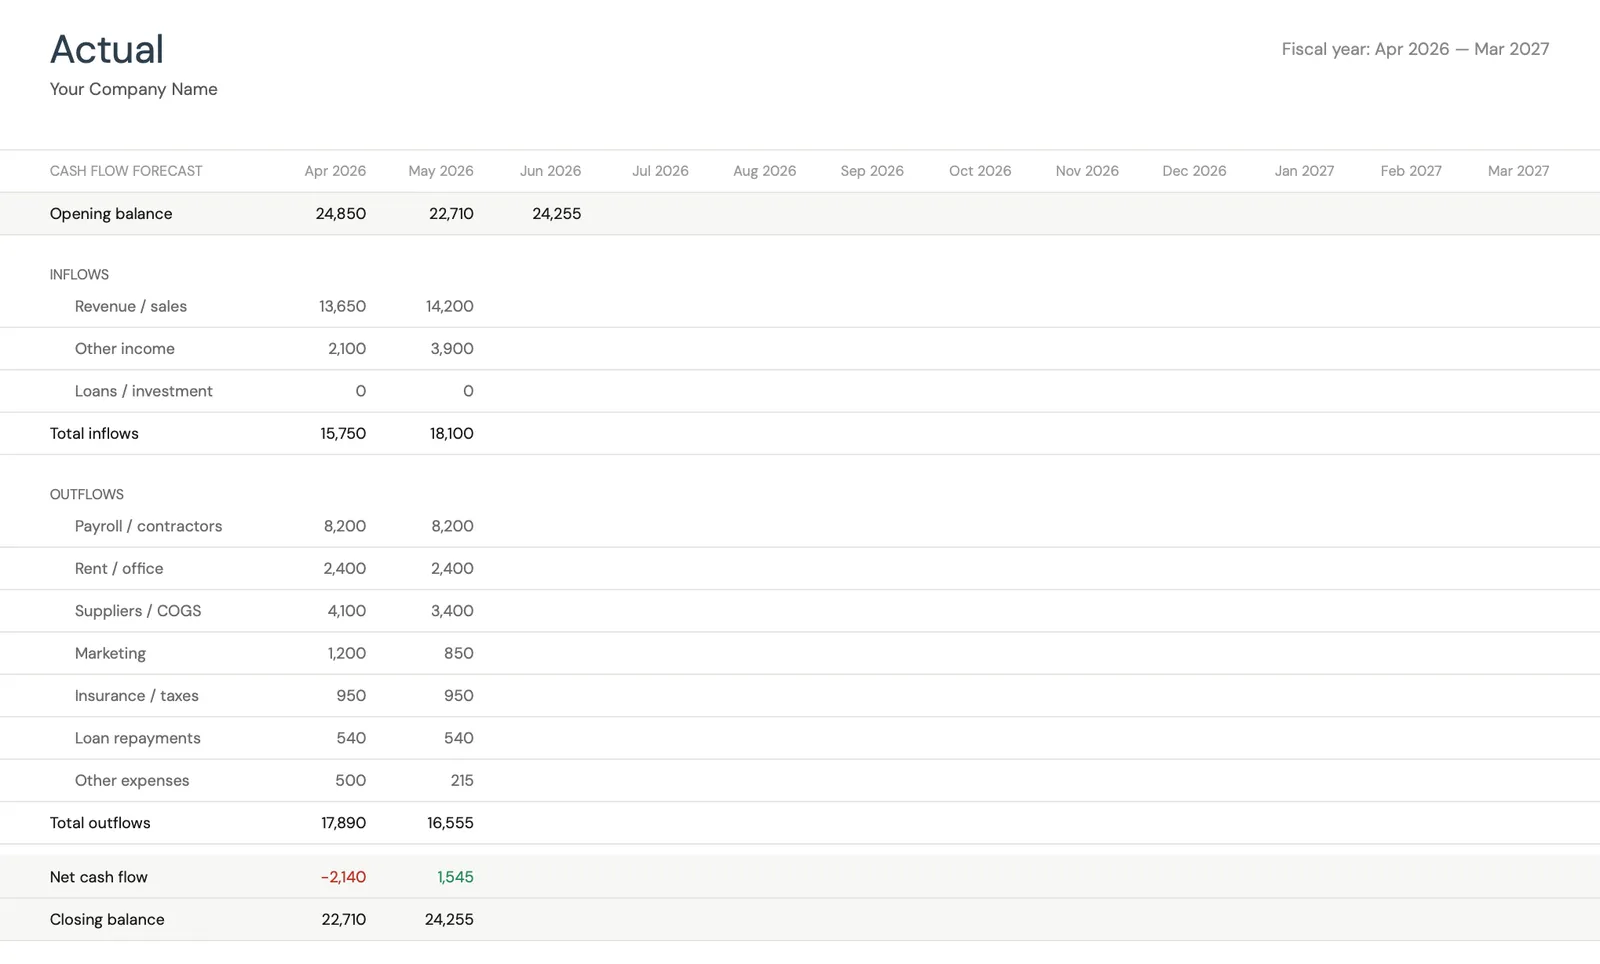
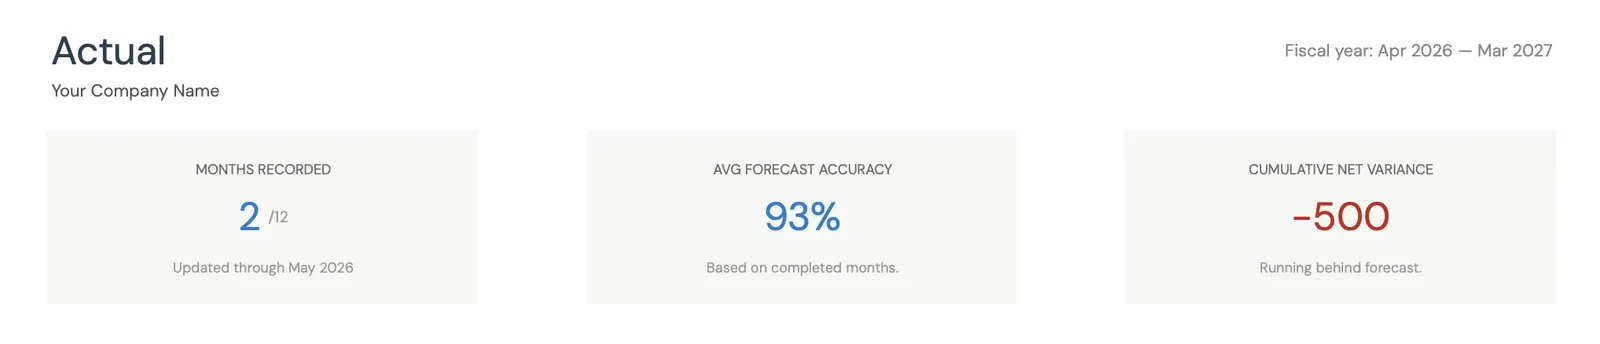
Track actual cash flow against your forecast
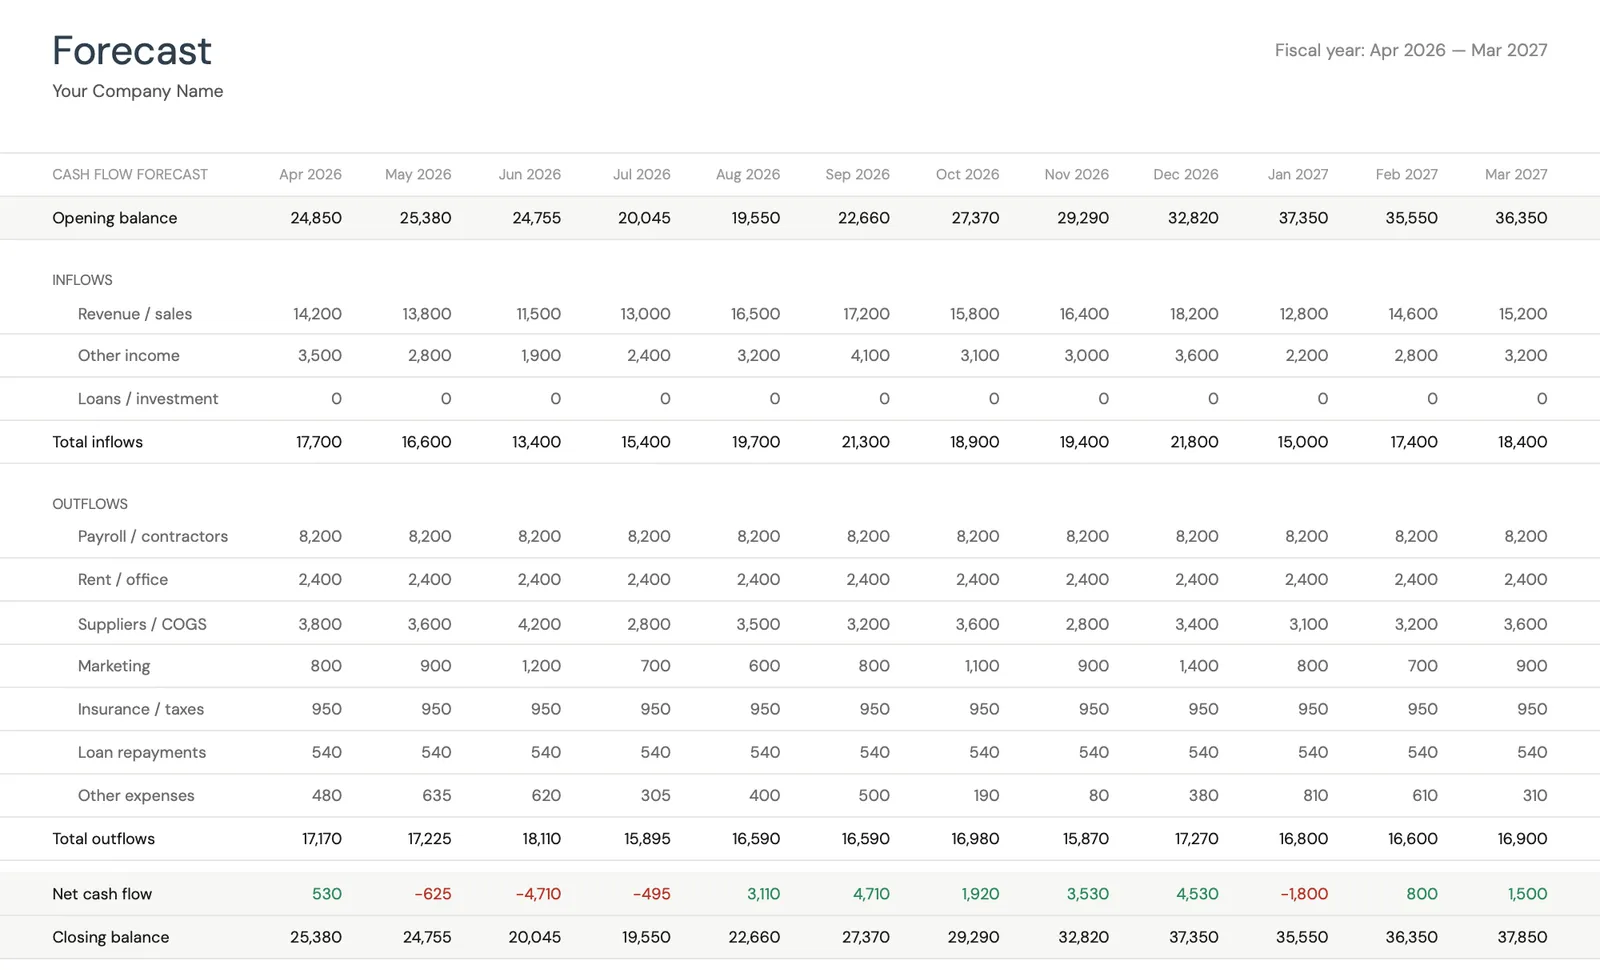
Project cash flow 12 months ahead
Key performance indicators for your cash flow
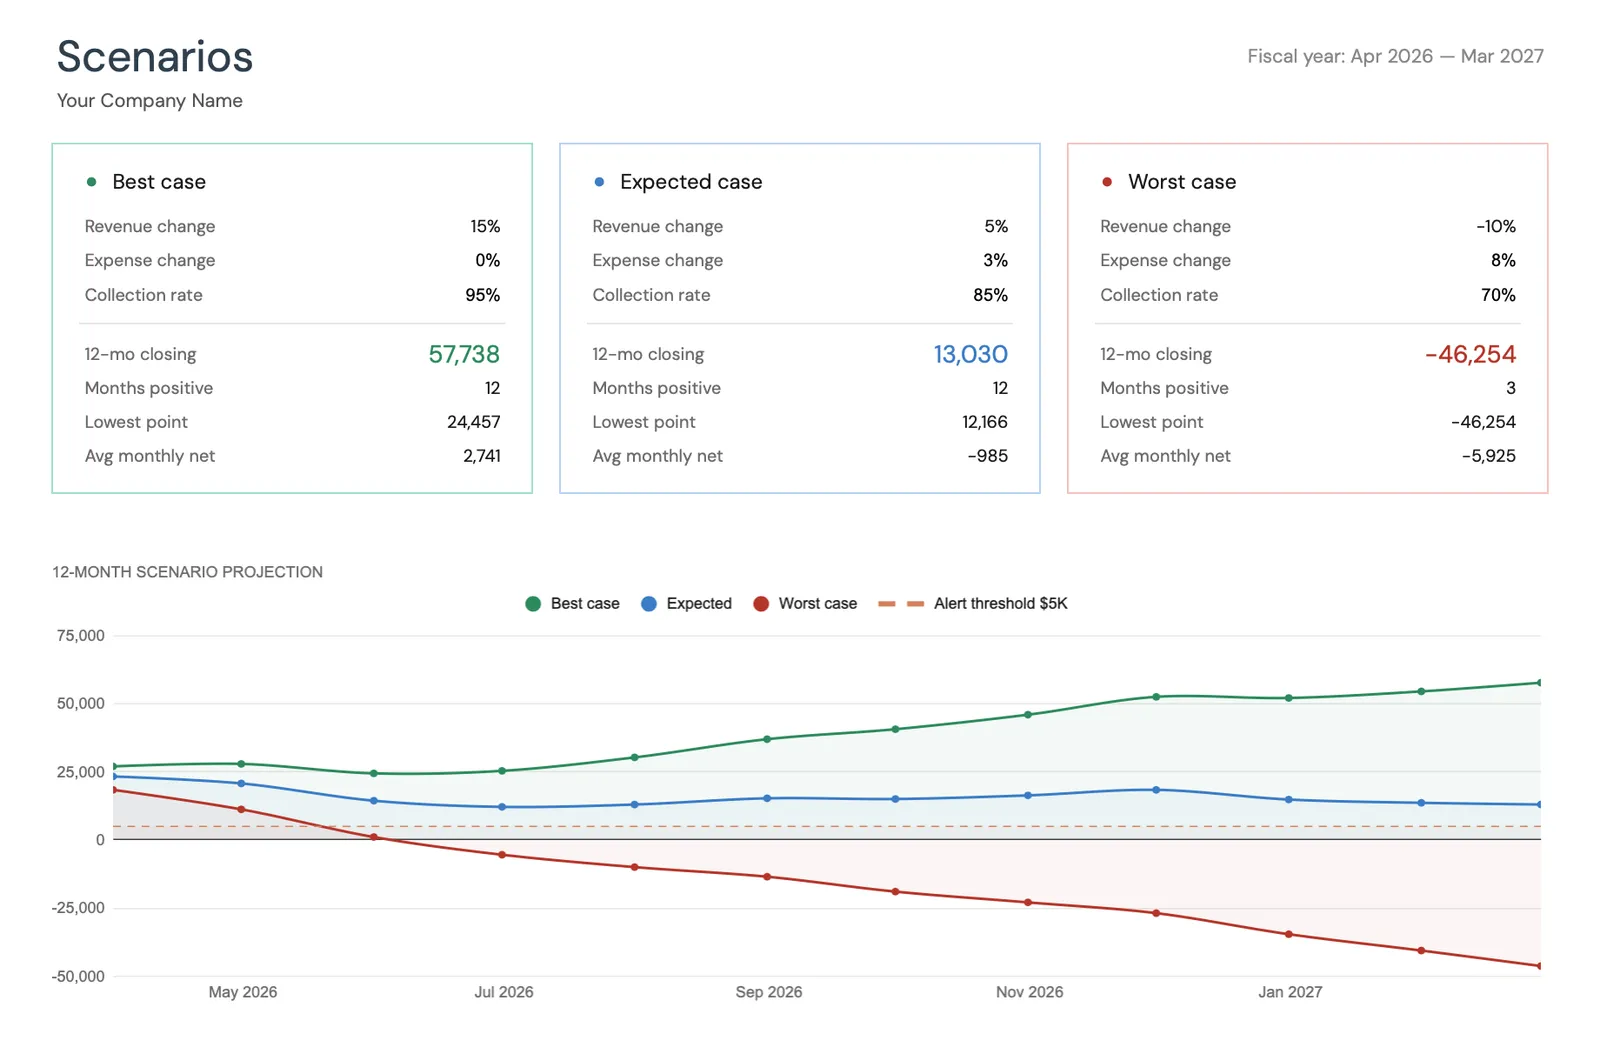
Model different scenarios for your business
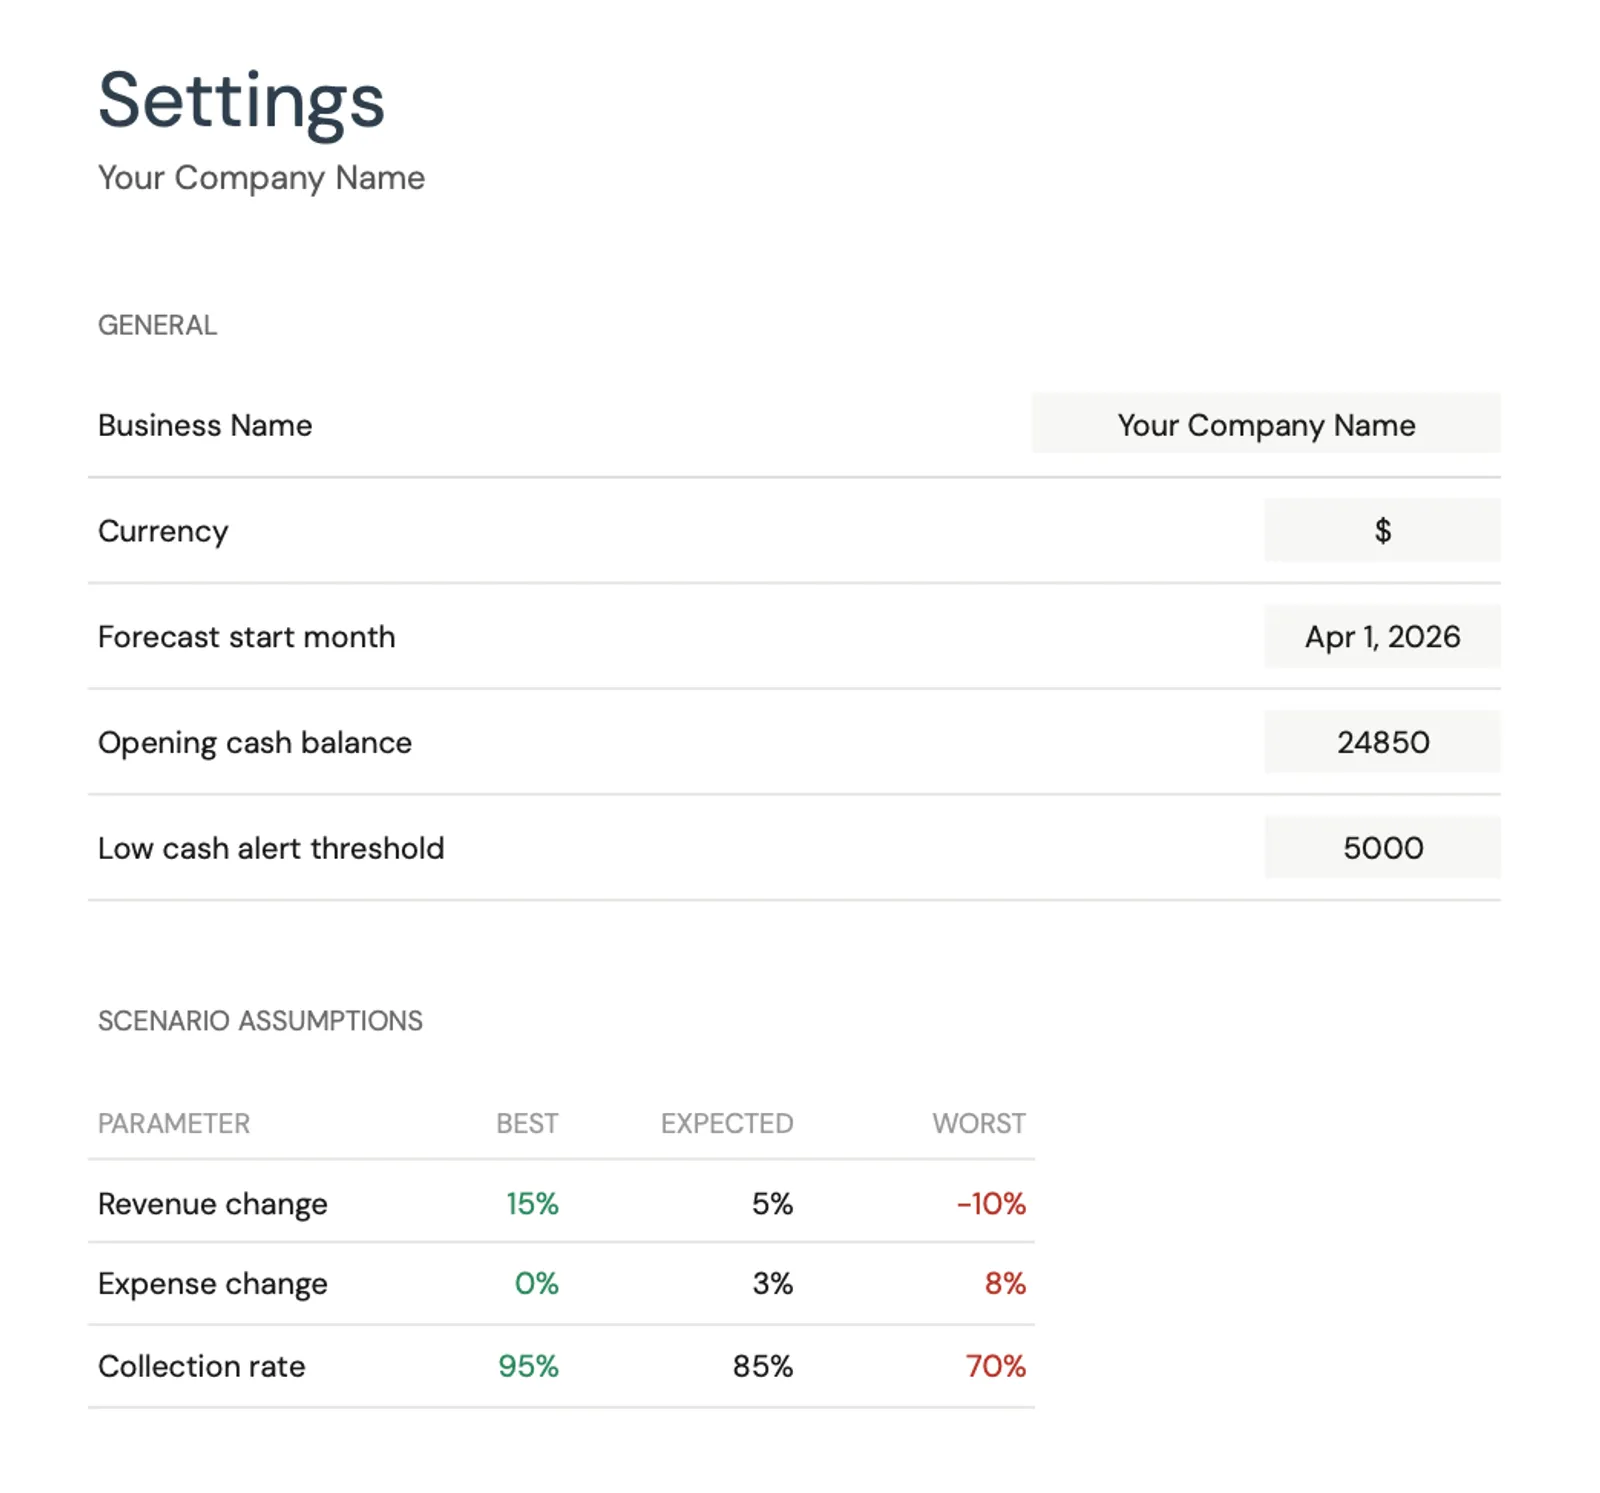
Customize categories for your business type
What You Get
Cash Flow Tools Built for Churches and Ministries
Giving trend tracking
Monitor total giving by month and compare against historical patterns. Identifying giving trends early - whether upward or downward - provides time to adjust spending before a cash crunch develops.
Ministry budget alignment
Track spending by ministry area (worship, children's, youth, missions) against the overall budget. Ensure program spending stays within sustainable levels relative to actual giving - not budgeted giving.
Giving patterns vs what you projected
Compare projected giving against actuals. Churches with 2-3 years of giving data can forecast within 10-15% accuracy. The variance between projected and actual giving provides early warning of financial trends.
Year-round giving cycle cash view
See your projected cash position through the full giving cycle. Plan facility projects, staff additions, and major purchases for months when cash reserves are projected to be strongest.
Common Questions
Cash Flow for Churches / Ministries - FAQ
How much operating reserve should a church maintain?
A commonly referenced guideline is 2-3 months of operating expenses. For a church spending $50,000/month, that means $100,000-$150,000 in reserves. This covers the summer giving dip, unexpected facility repairs, and provides a buffer if a major giving household leaves. The cash flow forecast helps determine whether current reserves are adequate by identifying the largest projected cash gap.
How do I forecast giving when it is voluntary?
Use 2-3 years of historical giving data as the baseline. Apply seasonal factors (December typically 20-30% above average, July 10-20% below). Adjust for known changes (new members, departures of giving households). Be conservative - it is far better to underspend a budget than to commit to expenses based on optimistic giving projections that do not materialize.
How should building fund and designated gifts be handled?
Track building fund and designated gifts separately from general operating giving. Designated gifts cannot be used for general operations - they must be spent according to their designation. The forecast should show general fund cash flow separately to avoid the illusion that designated gifts solve operating cash shortages.
How do we plan for a major facility project?
Use the forecast to model the project's cash flow impact. If a $200,000 roof replacement will be funded by a special capital campaign, map the expected pledge payments against the contractor payment schedule. Most capital campaigns collect 60-80% of pledges over 2-3 years. The forecast should use realistic collection rates, not total pledged amounts.
What percentage of the budget should go to staff versus programs?
Church budget allocation varies widely, but common benchmarks show 45-55% for personnel, 15-25% for facilities, 10-15% for ministries, and 5-15% for missions. The cash flow forecast does not prescribe allocation but helps track whether total commitments are sustainable at your realistic (not optimistic) giving level. If staff costs consume 65% of actual giving, there may be limited flexibility during a giving dip.
Can't find the answer you're looking for? Contact our team
Forecast cash flow for your churches / ministrie
One-time purchase. No subscription. Your financial data stays in your Google Drive.