Cash Flow Forecast
Cash Flow Forecast Template for Auto Repair Shops
Forecast repair revenue, track parts costs and labor margins, manage warranty and fleet work, and plan for equipment investments - all in a Google Sheets template built for cash flow management.
In Depth
Under the Hood - Financial Patterns in Auto Repair
Auto repair shops generate revenue from two distinct sources with different financial characteristics - labor and parts. Labor revenue carries high margins (65-75% after technician pay) because the primary cost is the technician's time. Parts revenue carries lower margins (45-55% markup) because the shop must purchase parts at wholesale and resell them. The overall profitability of a shop depends heavily on the mix between these two streams. Shops that generate a higher proportion of labor revenue - through diagnostics, complex repairs, and maintenance services - tend to achieve stronger overall margins.
Daily car count and average repair order are the two numbers that drive auto repair revenue, and they fluctuate more than many shop owners expect. A Monday might bring eight cars averaging $350 each, while Wednesday sees twelve cars averaging $600 due to a couple of major jobs. Weather, local events, and even the day of the week create meaningful daily variation. Over the course of a month, these variations tend to average out, but week-to-week cash flow can feel unpredictable even in a well-established shop.
Parts inventory decisions have a direct cash flow impact. Keeping common items - brake pads, filters, belts, common sensors - on the shelf means faster turnaround and more completed jobs per day. But inventory sitting on shelves is cash that is not available for other purposes. Most independent shops maintain $10,000-$30,000 in parts inventory, with the rest ordered from local suppliers for same-day delivery. Finding the balance between having enough stock for efficiency and not tying up excessive capital is an ongoing optimization.
Seasonal patterns in auto repair are real but less extreme than many other industries. Winter brings battery replacements, cooling system failures, and heating issues. Spring drives brake and tire work as drivers address winter damage. Summer heat stresses cooling systems and air conditioning. Fall is often the quietest period for many shops. These patterns are moderate enough that most shops operate year-round without dramatic revenue swings, but they do affect monthly cash flow in ways worth tracking and planning around.
The Challenge
Cash Flow Challenges for Auto Repair Shops
Auto repair shops deal with variable daily revenue, significant parts inventory investment, and the constant need for diagnostic equipment upgrades. Cash flow management keeps the bays productive and the doors open.
Revenue varies significantly day to day
One day might bring three $2,000 engine jobs and the next might see only oil changes and brake pads totaling $600. A shop with 4-6 bays typically generates $30,000-$80,000/month in revenue, but the daily variation is extreme. Walk-in versus appointment mix, seasonal factors (winter brings more battery and heating jobs, spring brings more brake and tire work), and local economic conditions all influence daily revenue. Forecasting requires looking at weekly and monthly patterns rather than daily numbers.
Parts costs consume 35-45% of revenue with immediate payment requirements
Parts represent the largest direct cost for most repair shops, typically 35-45% of repair revenue. Parts suppliers often extend limited credit (net-15 to net-30) but may require COD for newer accounts. A shop that performs a $3,000 repair uses $1,200-$1,350 in parts that must be paid for promptly, while the customer payment might take a few days (especially for fleet or insurance work). Parts inventory on shelves ties up additional capital.
Skilled technician wages are rising and competitive
Qualified automotive technicians command $25-$45/hour (or more for specialty certifications). Total labor costs including benefits and taxes typically run 25-35% of revenue. Flat-rate pay systems tie technician compensation to completed work, but shops still need to cover base wages during slow periods. Losing a productive technician to a competitor can immediately reduce shop capacity and revenue by $8,000-$15,000/month.
Diagnostic equipment and tools require ongoing investment
Modern vehicles require increasingly sophisticated diagnostic equipment. Scan tools, alignment machines, and ADAS calibration equipment cost $5,000-$50,000+ each and require regular updates. Shops that do not invest in current technology lose work to competitors who can service newer vehicles. These are essential capital expenditures that must be planned and funded from operating cash flow.
Start forecasting your cash flow
Forecasting Guide
How to Forecast Cash Flow for Your Auto Repair Shop
Auto repair cash flow forecasting starts with average daily car count and average repair order value. Here is how to structure it using the Cash Flow Forecast template.
Revenue Categories
- Labor revenue (diagnostic, repair, maintenance)
- Parts markup revenue
- Fleet and commercial accounts
- State inspection and emissions testing
- Towing and sublet work
- Tire sales and installation
Expense Categories
- Parts and materials (COGS)
- Technician wages (flat rate or hourly)
- Service advisor and office staff wages
- Payroll taxes and benefits
- Rent or mortgage
- Shop insurance (garage keepers, general liability)
- Equipment loans and tool subscriptions
- Utilities (shop electricity and heating are significant)
- Waste disposal (oil, coolant, tires)
- Shop supplies and consumables
- Software (shop management, parts ordering)
- Marketing and customer retention
Cash Flow Timing
Most retail repair work is paid at pickup, making cash flow relatively immediate. Fleet and commercial accounts typically pay on net-30 terms, creating a lag for shops with significant commercial business. Parts suppliers expect payment within 15-30 days. The main cash timing consideration is parts inventory: keeping enough common parts on hand to avoid delays without tying up excessive capital. Seasonal patterns affect both revenue mix and volume.
See It In Action
What the template looks like
Browse through the template to see dashboards, forecasting, actuals tracking, and scenario planning.
- Visual cash flow dashboard
- Forecast vs actuals comparison
- Scenario planning tools
- Customizable categories

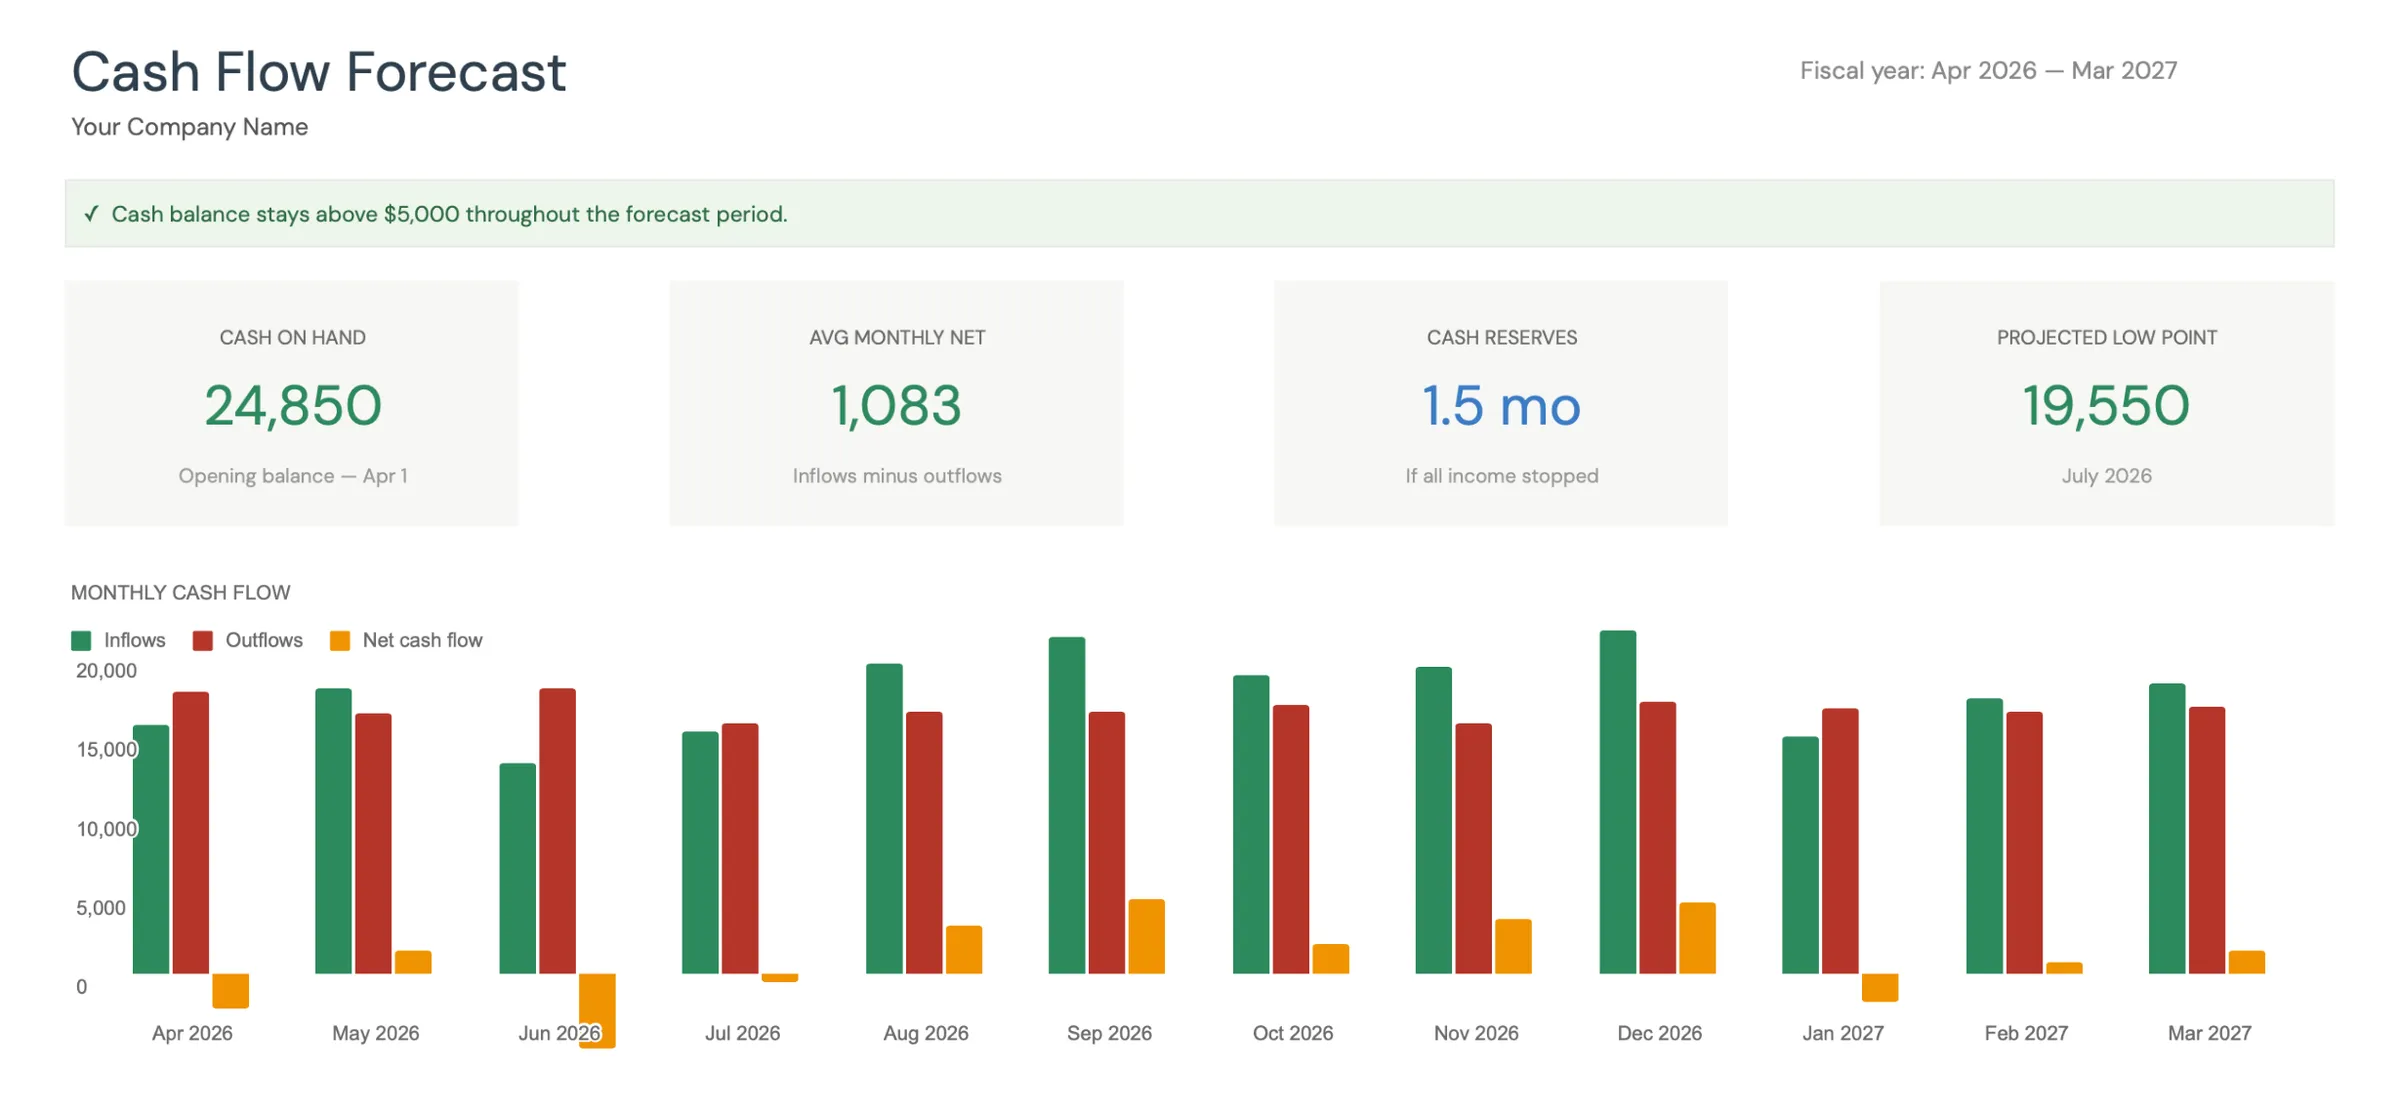
Monthly cash flow overview with KPIs and charts
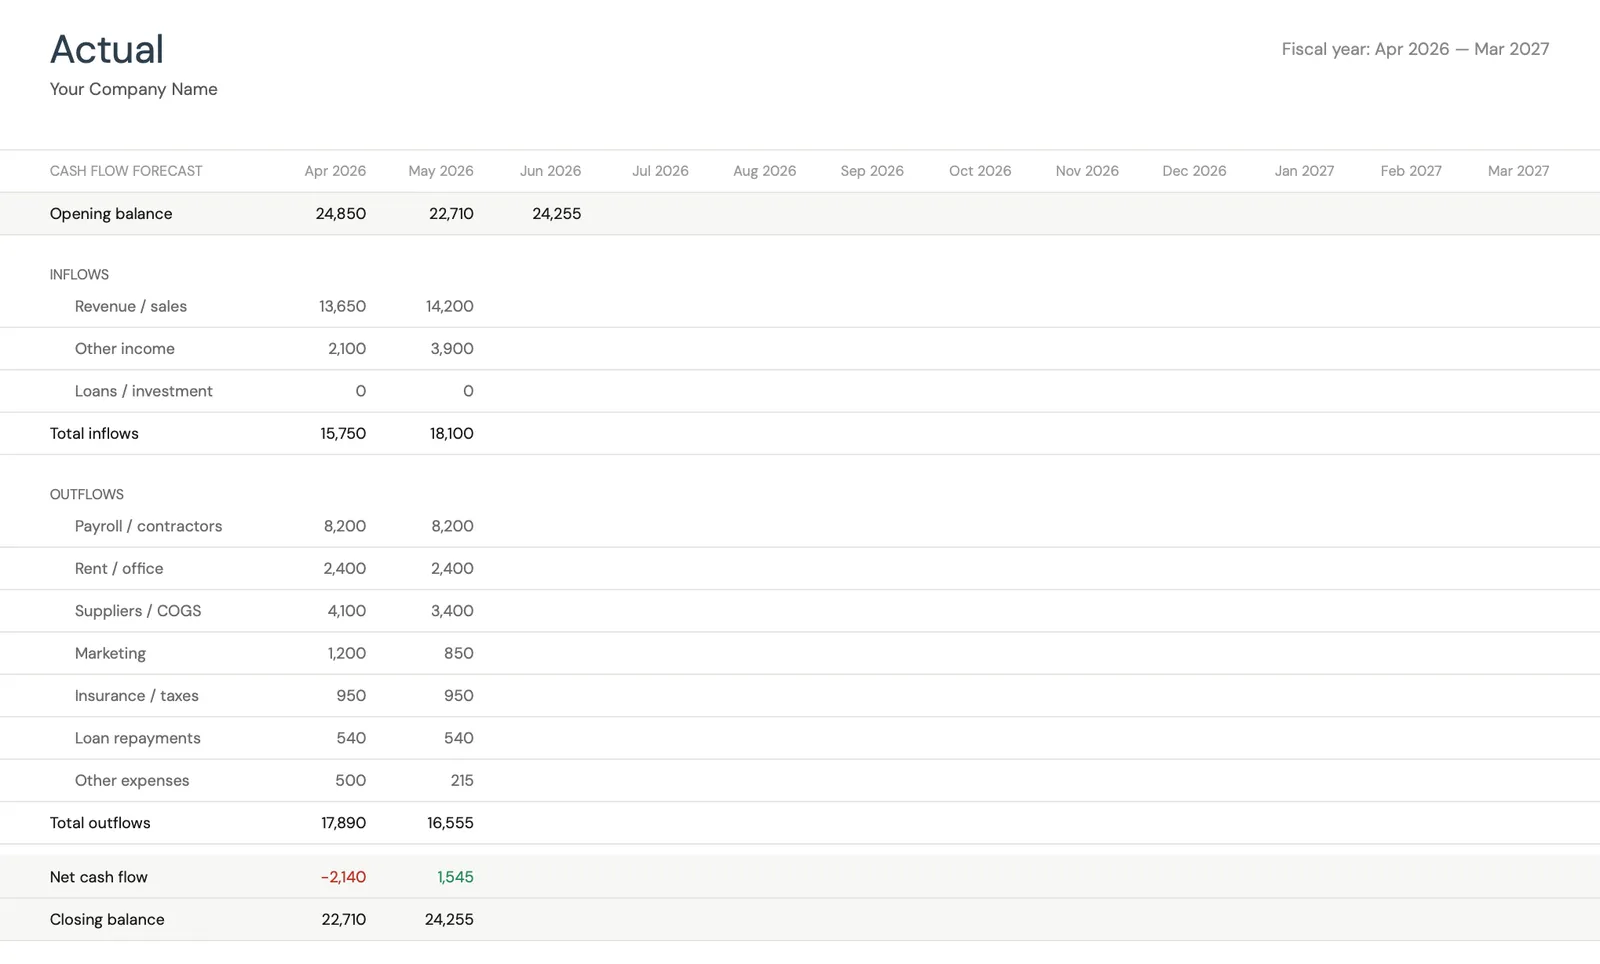
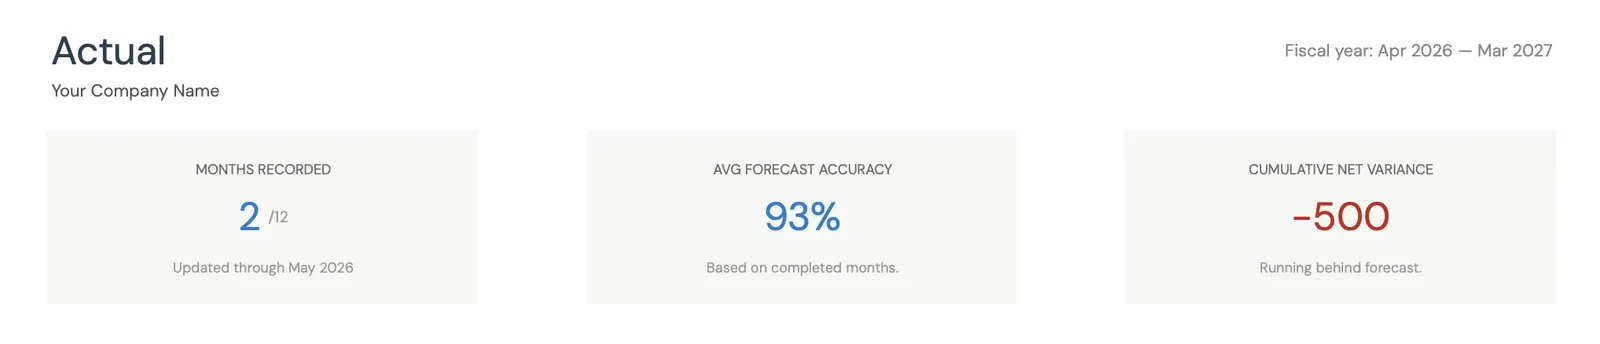
Track actual cash flow against your forecast
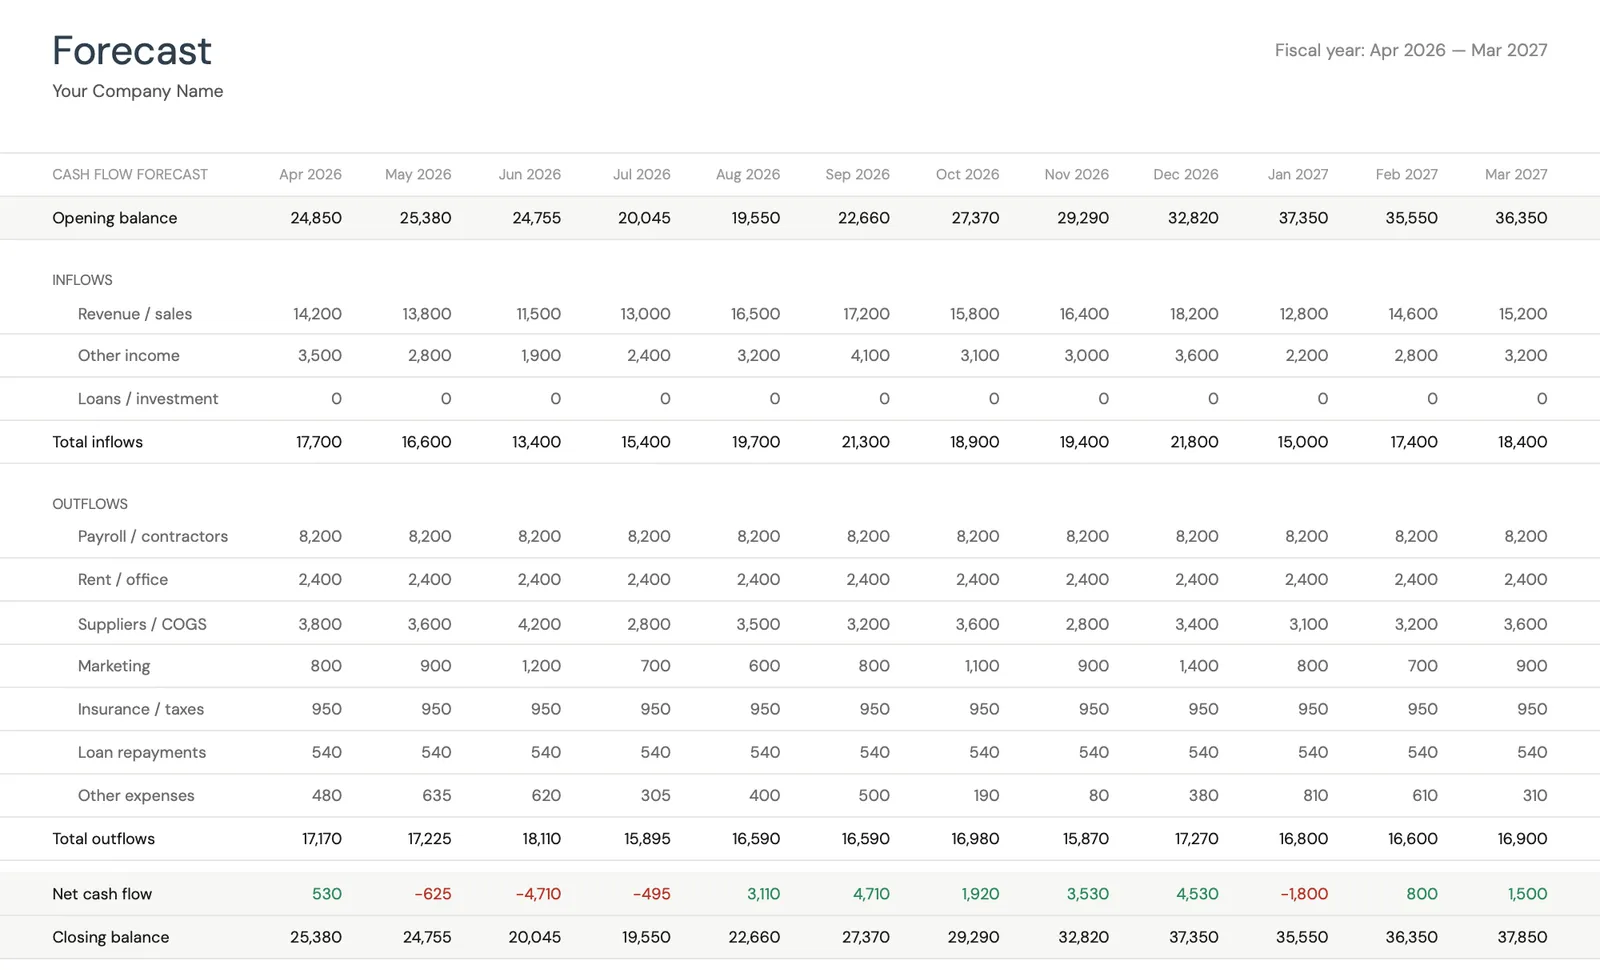
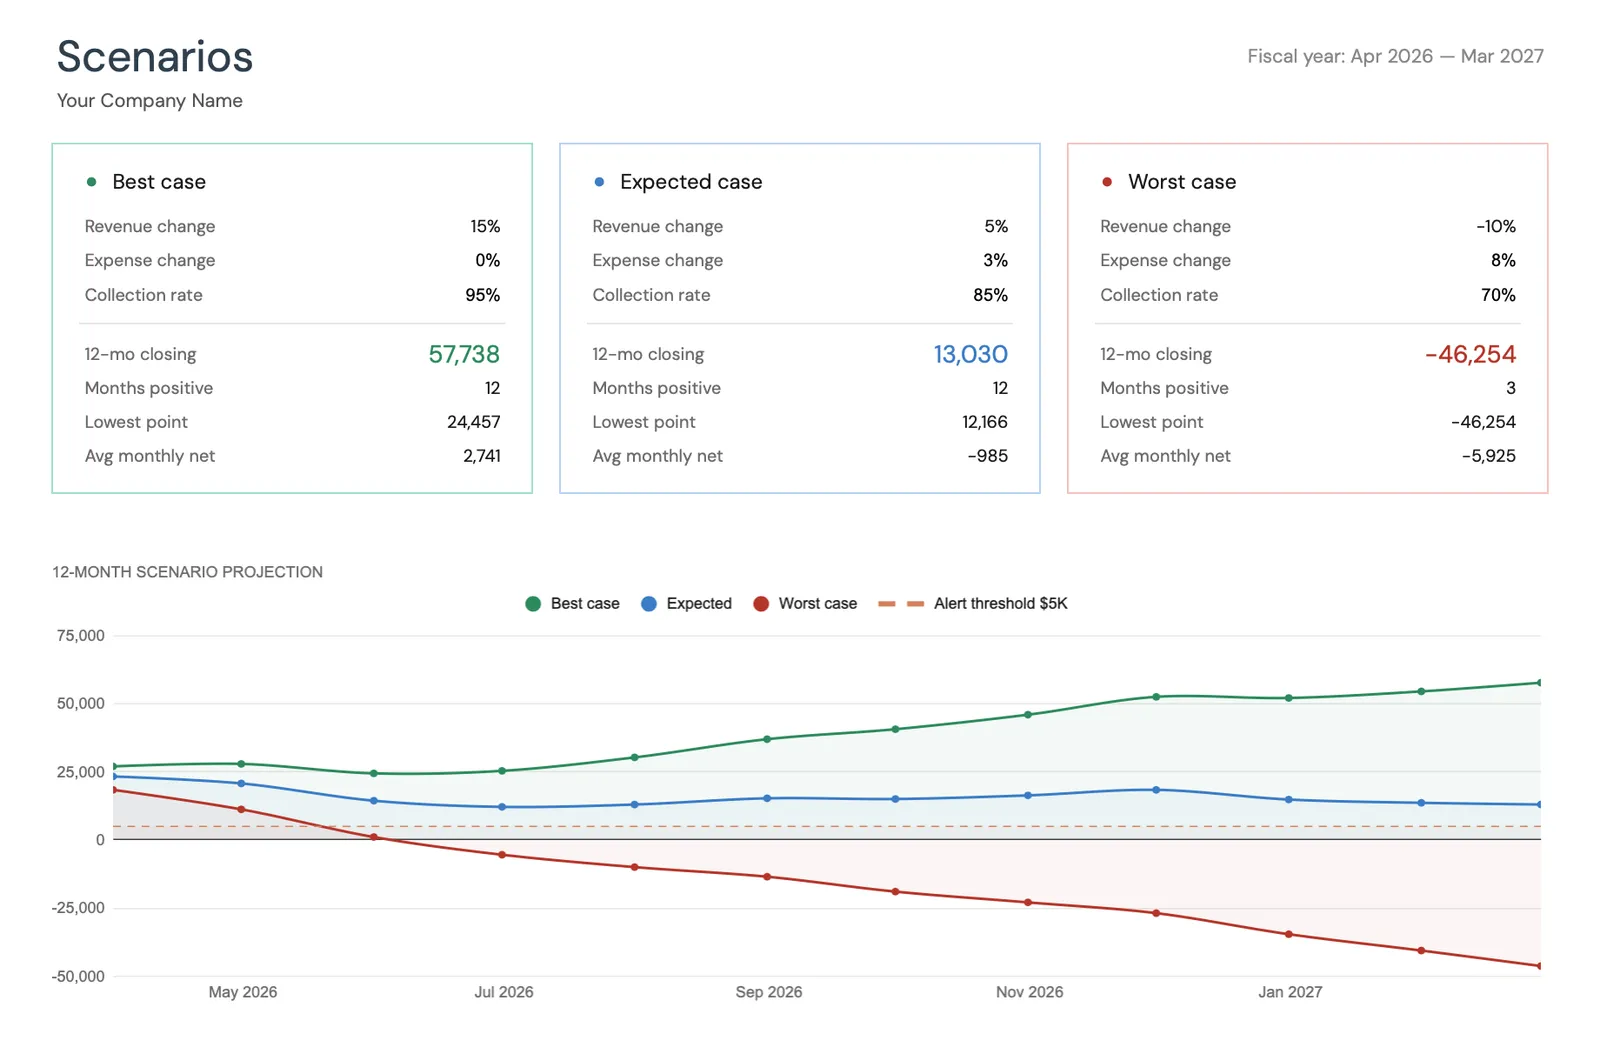
Project cash flow 12 months ahead
Key performance indicators for your cash flow
Model different scenarios for your business
Customize categories for your business type
What You Get
Auto Repair Shop Tools Inside the Template
Labor and parts revenue tracking
Track labor revenue and parts revenue separately. Healthy shops typically target a 70% labor margin and 45-55% parts margin. Monitoring these margins monthly catches erosion before it becomes a profit problem.
Average repair order monitoring
Track average repair order value and daily car count. These two numbers drive revenue. If average ticket is declining, the forecast shows the cash flow impact and signals the need for service advisor training or menu pricing adjustments.
Car count and ticket averages vs plan
Compare projected revenue and expenses against actuals. Auto repair shops with good management software generate detailed data - use it to refine forecast assumptions about car count, average ticket, and parts cost percentages.
Year-ahead shop revenue and cash forecast
See your projected cash position across seasonal cycles. Plan equipment purchases, facility upgrades, and marketing pushes around months with projected cash surpluses.
Common Questions
Cash Flow for Auto Repair Shops - FAQ
What profit margin is typical for auto repair shops?
Net margins for auto repair shops typically range from 10-20%. The key metrics are parts margin (45-55% markup is common), labor margin (65-75% after technician pay), and overall gross profit margin (50-60%). Shops that achieve high technician productivity (85%+ efficiency) and maintain strong parts margins consistently achieve the upper end of profitability.
How much parts inventory should I carry?
Most independent shops carry $10,000-$30,000 in common parts inventory. The goal is having frequently needed items (filters, brakes, belts) on hand while relying on same-day delivery from parts suppliers for less common parts. Track inventory turnover - parts sitting on shelves for months tie up cash. The forecast should include monthly parts purchasing and inventory cost as a percentage of revenue.
How do I handle fleet accounts in the forecast?
Fleet accounts provide steady, predictable work volume but typically pay on net-30 terms and may negotiate discounted labor rates. Track fleet revenue and accounts receivable separately. A fleet account generating $5,000/month in revenue with net-30 payment means you always have one month of fleet revenue ($5,000) outstanding in receivables. Factor this lag into cash projections.
How do I plan for major equipment purchases?
Build a monthly equipment reserve contribution into your forecast. If you anticipate needing a $25,000 alignment machine in 18 months, that requires setting aside roughly $1,400/month. The forecast shows whether current cash flow supports this reserve contribution or whether financing is needed. Most equipment can be financed over 3-5 years with monthly payments of $500-$1,500.
What is a healthy car count per day?
A general benchmark is 2-3 cars per bay per day for a general repair shop. A 4-bay shop targeting 8-12 cars/day at an average repair order of $400-$600 would generate $3,200-$7,200/day. Quick service operations (oil changes, inspections) may see higher car counts with lower ticket values. The forecast should use your actual average car count and ticket value, adjusted for seasonal patterns.
Can't find the answer you're looking for? Contact our team
Forecast cash flow for your auto repair shop
One-time purchase. No subscription. Your financial data stays in your Google Drive.