Cash Flow Forecast
Cash Flow Forecast Template for Airbnb / Short-term Rentals
Forecast occupancy-based revenue, track cleaning and turnover costs, manage platform fees, and plan for seasonal pricing changes - all in a Google Sheets template built for cash flow management.
In Depth
Occupancy, Pricing, and the Airbnb Cash Flow Equation
Short-term rental finances revolve around two variables that interact in ways that reward careful attention - occupancy rate and average nightly rate. Raising prices might increase revenue per booking but reduce the number of bookings. Lowering prices fills more nights but reduces revenue per stay. The relationship between these two numbers is not linear, and finding the combination that maximizes total revenue requires ongoing experimentation and market awareness.
Turnover costs create an expense pattern that long-term landlords rarely think about. Each guest departure triggers cleaning ($75-$200+), laundry, restocking consumables, and a property inspection. A property with 20 turnovers per month might spend $2,000-$4,000 on turnover-related costs alone - an expense that scales directly with bookings. Longer stays reduce per-night turnover costs, which is one reason many hosts offer weekly and monthly discounts. The trade-off between more bookings and fewer turnovers is a genuine financial calculation.
Seasonality in short-term rentals can be extreme. A beach property might achieve 90% occupancy in July and 15% in January. The July revenue needs to cover not just July expenses but contribute to a reserve that funds January when monthly costs - mortgage, insurance, utilities - continue while revenue drops to a fraction of peak levels. Some hosts find that their property is cash-flow negative for four to five months of the year, with the peak season generating enough surplus to cover the annual total.
The comparison between short-term and long-term rental income is more nuanced than many hosts initially expect. A property that could rent for $2,000/month as a long-term rental might generate $4,000/month as an Airbnb during peak season - but only $800/month in the off-season. After accounting for cleaning, supplies, higher utilities, platform fees, management time, and increased maintenance, the annual net cash flow difference between the two approaches can be surprisingly narrow. Understanding the full-year picture, not just the peak months, reveals the true financial comparison.
The Challenge
Cash Flow Challenges for Airbnb and Short-term Rental Hosts
Short-term rentals offer higher per-night revenue than traditional rentals but come with higher costs, more management complexity, and significant seasonal demand variation. Cash flow management separates profitable hosts from those who lose money.
Occupancy rates fluctuate dramatically by season
A beach property might achieve 90% occupancy in summer and 20% in winter. A city apartment might average 70% year-round but drop to 40% during slow periods. Revenue swings of 50-70% between peak and off-season months are common. Mortgage, insurance, and utilities continue regardless of occupancy. A property generating $4,000/month in peak season and $1,200/month in the off-season creates challenging cash flow dynamics when monthly costs are $2,500.
Per-stay costs add up quickly
Each guest turnover incurs cleaning costs ($75-$200+), laundry, supplies replacement, and potential maintenance. A property with 15 turnovers per month might spend $1,500-$3,000 on cleaning alone. Consumables (toiletries, coffee, kitchen supplies) add $15-$30 per stay. These variable costs mean short-term rental profitability depends heavily on average length of stay - more turnovers mean more per-stay costs eating into revenue.
Platform fees and management costs reduce gross revenue
Airbnb charges hosts 3% per booking (or up to 15-17% with the simplified pricing model). VRBO and Booking.com have their own fee structures. If you use a property manager, add 20-30% of revenue. Channel manager software, dynamic pricing tools, and smart locks add monthly subscription costs. By the time all fees are deducted, the host receives 55-75% of the guest's total payment. The forecast must work with net revenue, not gross bookings.
Maintenance intensity exceeds traditional rentals
Short-term rental properties experience 3-5x the wear and tear of long-term rentals due to constant turnover. Furniture needs replacing every 2-3 years instead of 5-7. Appliances are used more intensively. Guests occasionally cause damage that security deposits do not fully cover. Annual maintenance and replacement costs typically run 5-10% of gross revenue, with periodic larger refreshes ($3,000-$10,000) needed every 2-3 years.
Start forecasting your cash flow
Forecasting Guide
How to Forecast Cash Flow for Your Airbnb or Short-term Rental
Short-term rental cash flow forecasting centers on occupancy rate, average nightly rate, and per-stay costs. Here is how to structure it using the Cash Flow Forecast template.
Revenue Categories
- Nightly booking revenue (after platform fees)
- Cleaning fee income
- Extra guest fees
- Pet fees
- Long-term stay discounts (net revenue)
- Damage claim recoveries
Expense Categories
- Mortgage or rent
- Property taxes
- Insurance (short-term rental specific)
- Cleaning and laundry costs
- Supplies and consumables
- Utilities (electricity, gas, water, internet, streaming)
- Property management fees (if applicable)
- Software subscriptions (PMS, pricing tools, channel manager)
- Maintenance and repairs
- Furnishing and decor replacement
- HOA fees (if applicable)
- Lawn care and exterior maintenance
- Accounting and tax preparation
Cash Flow Timing
Airbnb payouts arrive approximately 24 hours after guest check-in. VRBO and other platforms have different payout schedules. Revenue is tied directly to occupancy, which varies seasonally. Fixed costs (mortgage, insurance, taxes) remain constant year-round. The key forecasting exercise: calculate your monthly breakeven occupancy rate, then compare against projected occupancy by month. Months below breakeven require cash reserves from peak months.
See It In Action
What the template looks like
Browse through the template to see dashboards, forecasting, actuals tracking, and scenario planning.
- Visual cash flow dashboard
- Forecast vs actuals comparison
- Scenario planning tools
- Customizable categories

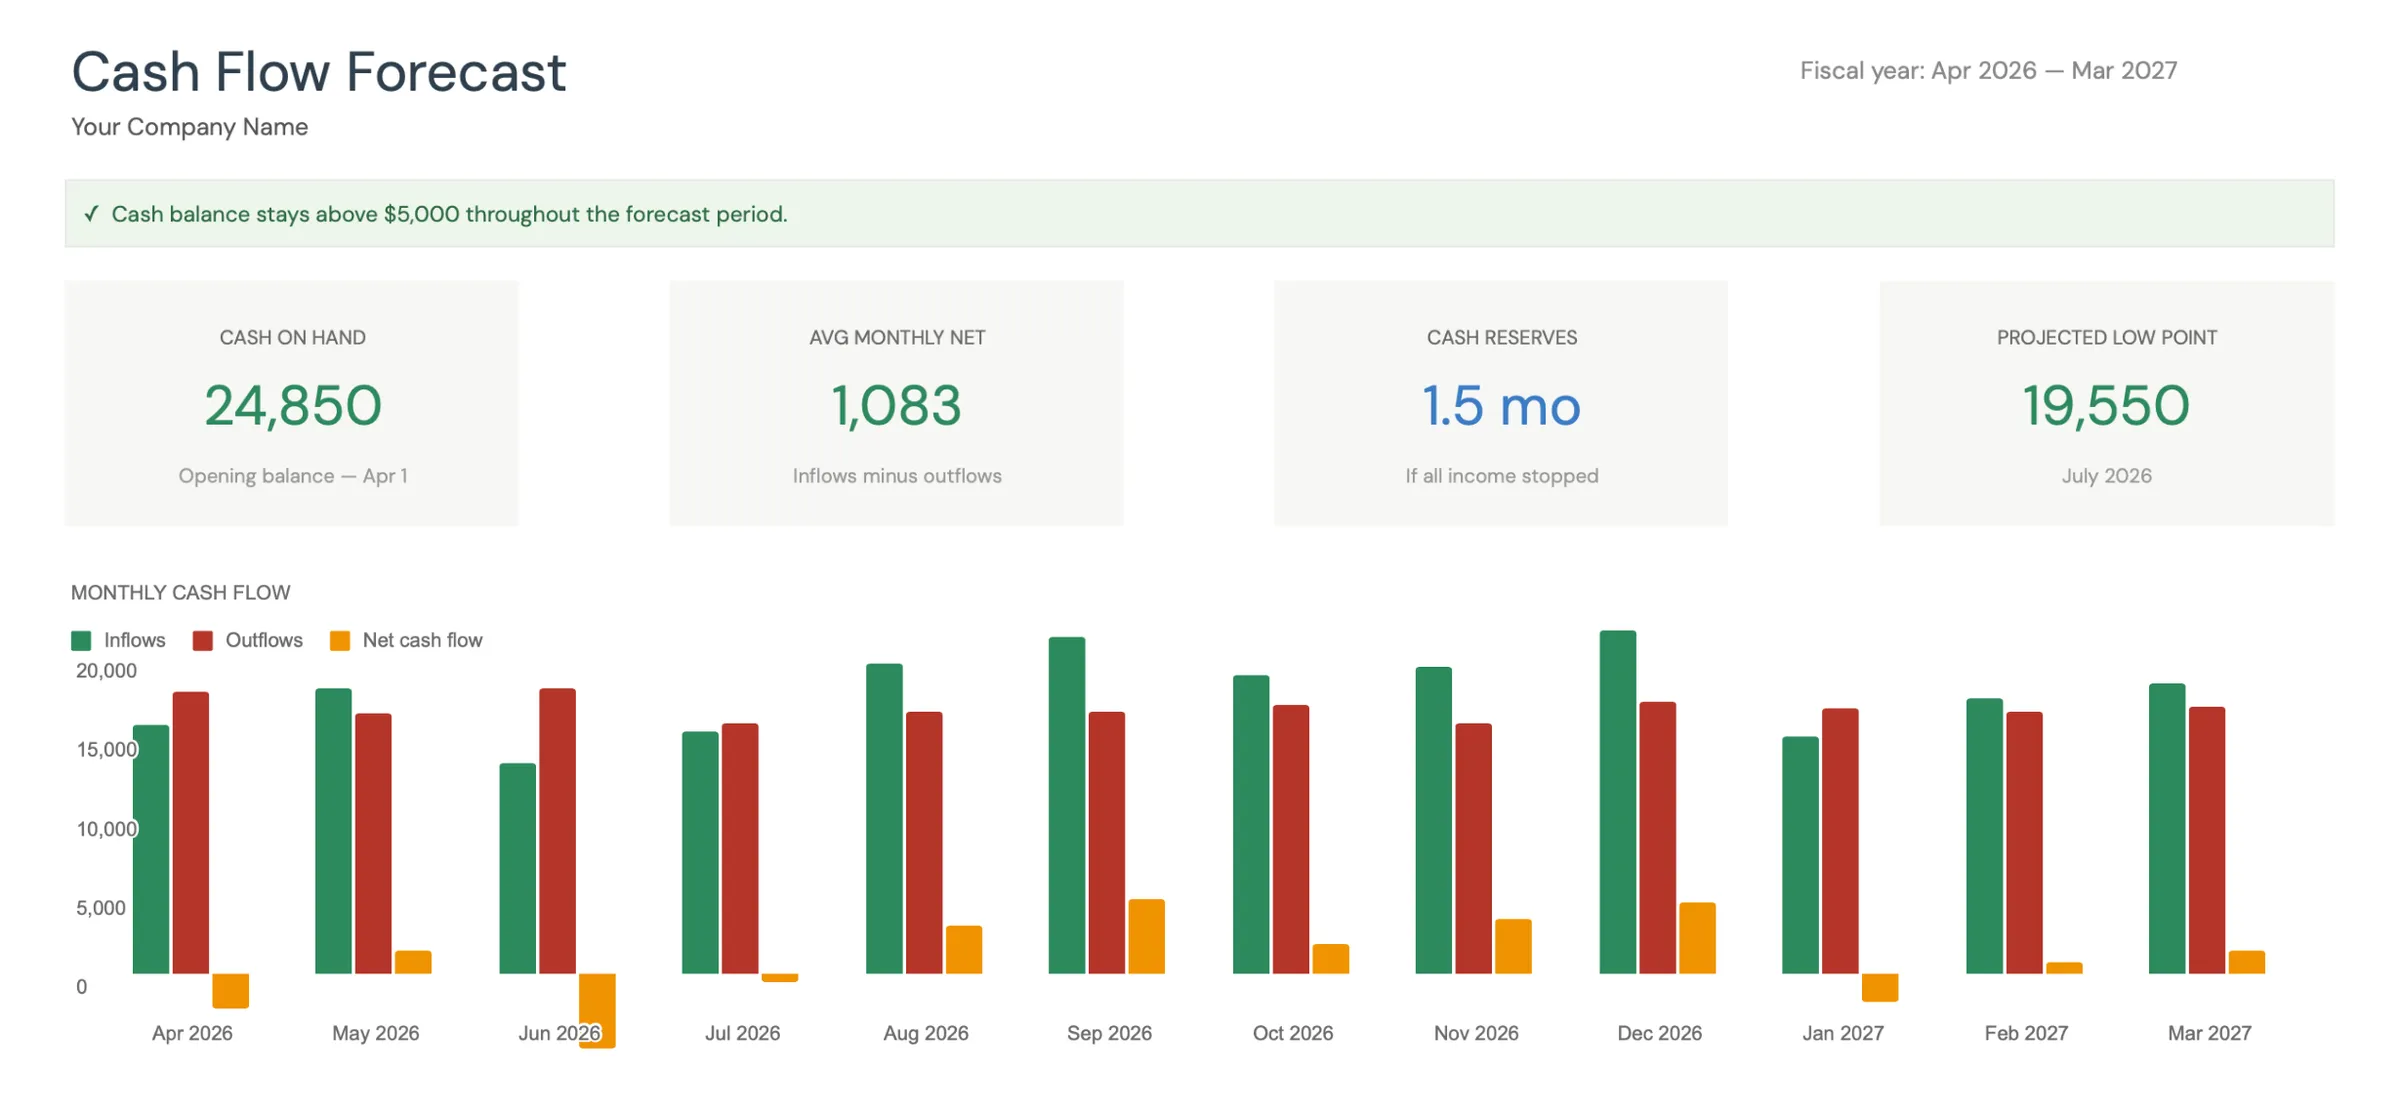
Monthly cash flow overview with KPIs and charts
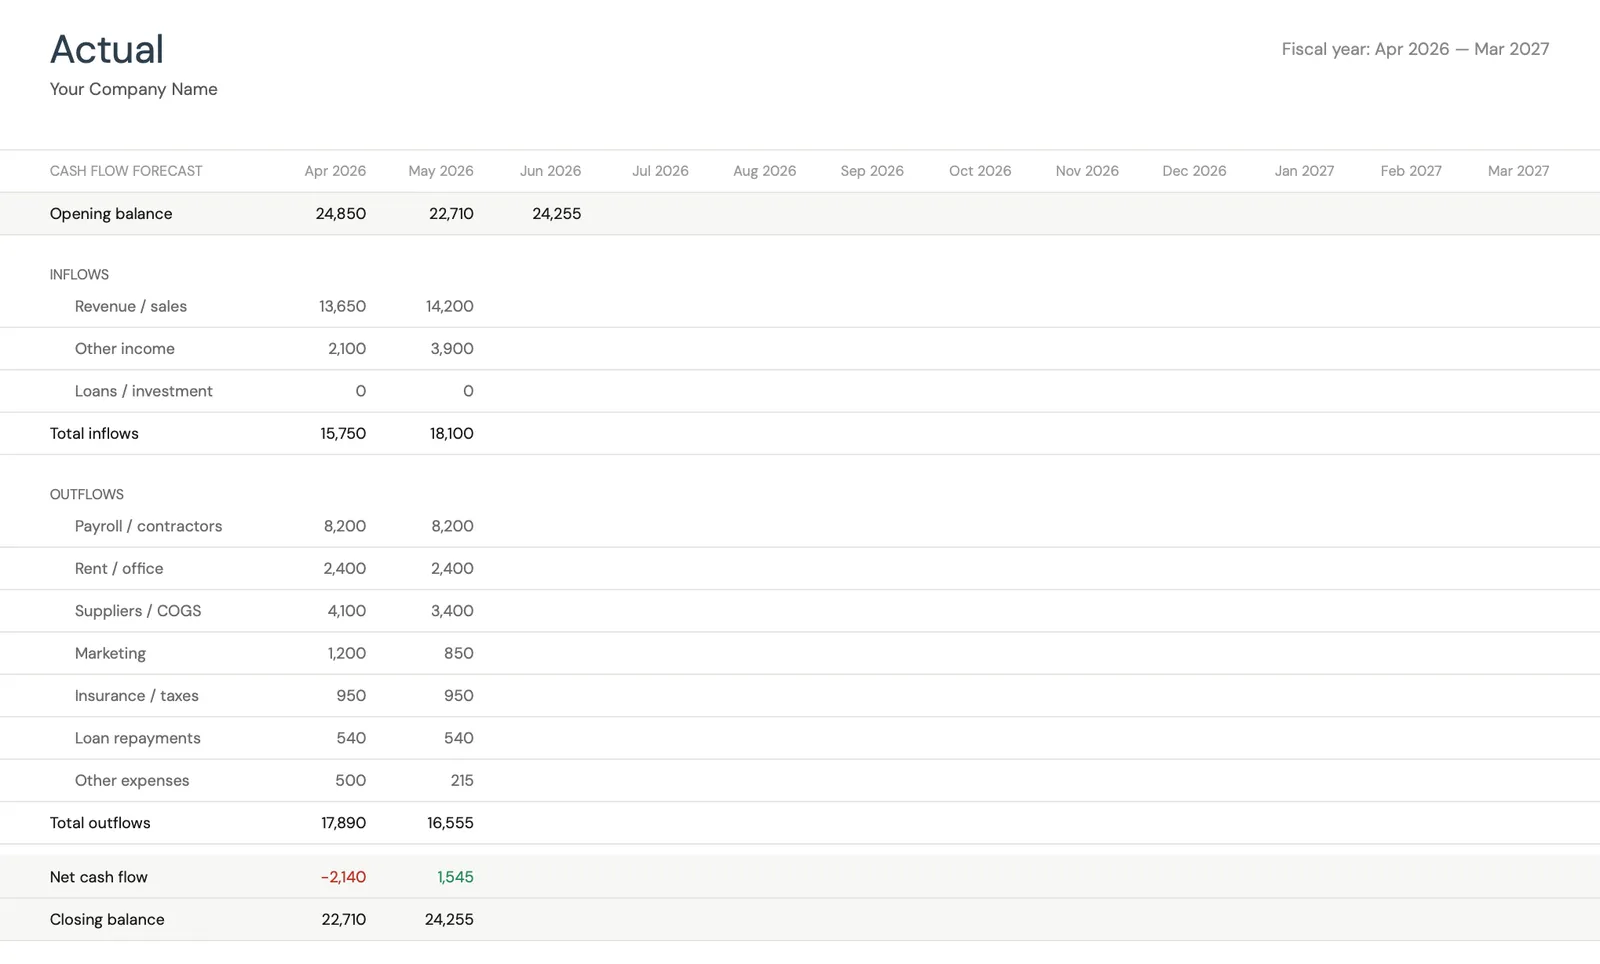
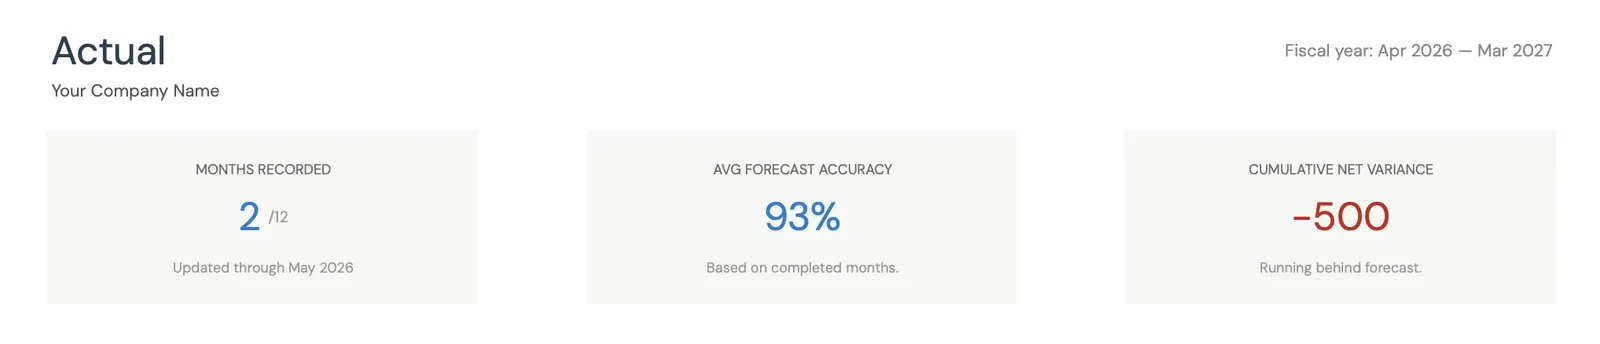
Track actual cash flow against your forecast
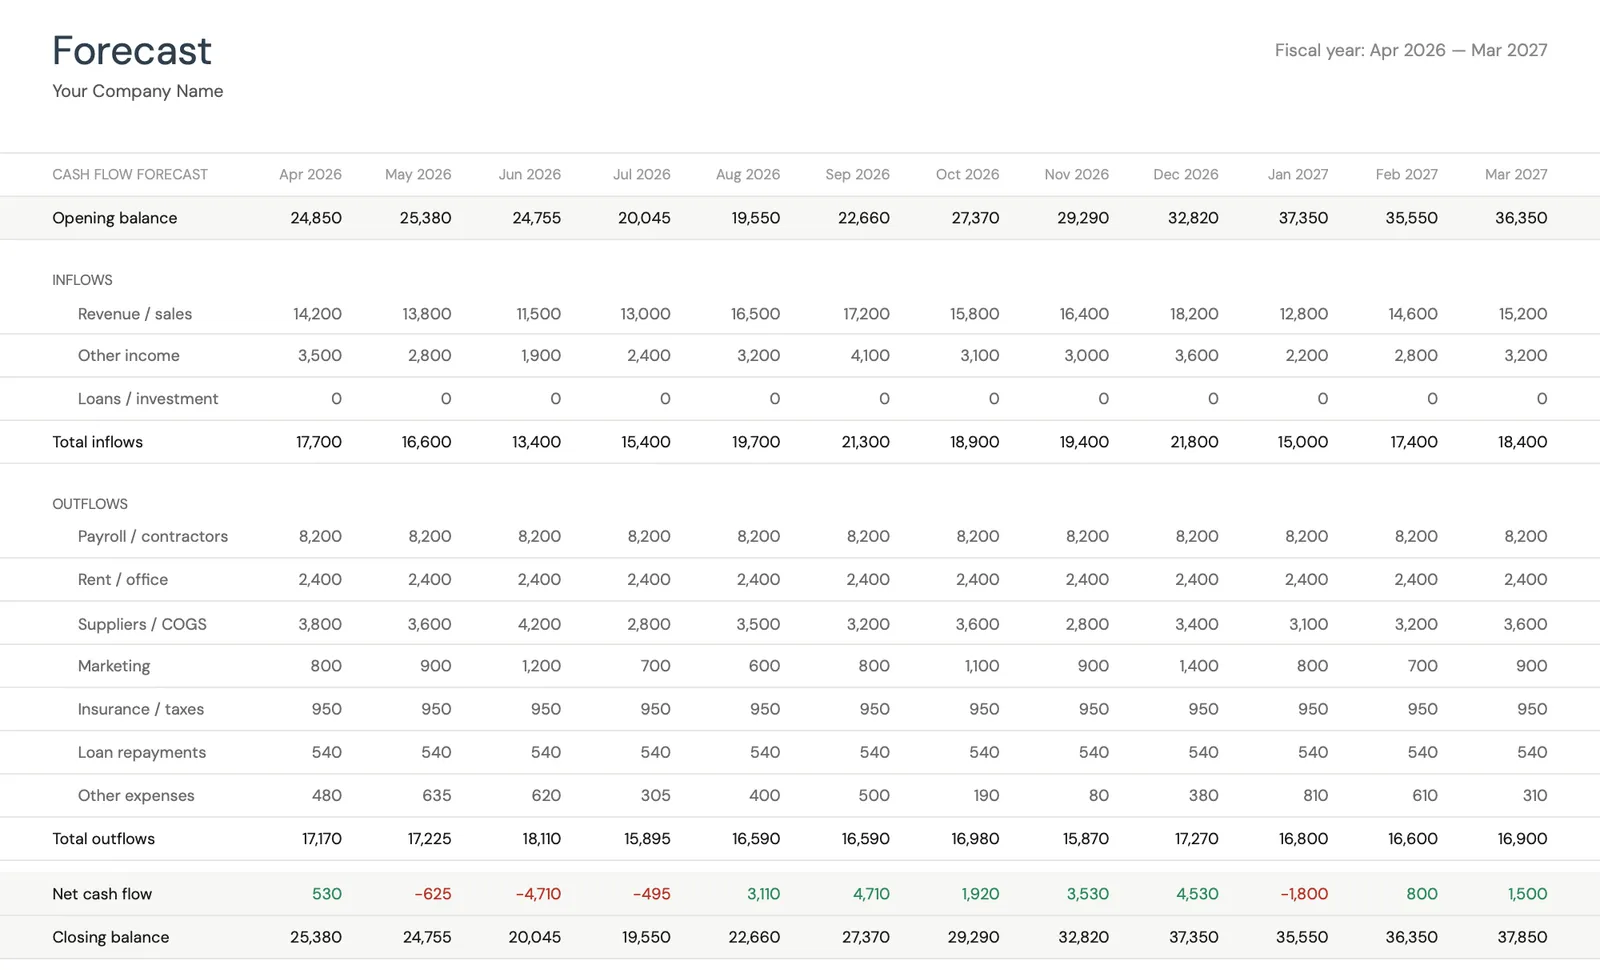
Project cash flow 12 months ahead
Key performance indicators for your cash flow
Model different scenarios for your business
Customize categories for your business type
What You Get
What Short-term Rental Hosts Get From This Template
Occupancy and rate tracking
Track occupancy rate and average nightly rate by month. These two numbers drive revenue. Seeing trends in both helps optimize pricing strategy and identify when seasonal adjustments are needed.
Per-stay cost analysis
Track cleaning, supplies, and turnover costs per stay to understand your true variable costs. Higher turnover means more revenue but also more costs - the template helps find the right balance.
Occupancy actuals vs your booking forecast
Compare projected occupancy and revenue against actuals. Short-term rental platforms provide detailed booking data, making it straightforward to update the forecast with real numbers each month.
Peak-to-off-season 12-month cash view
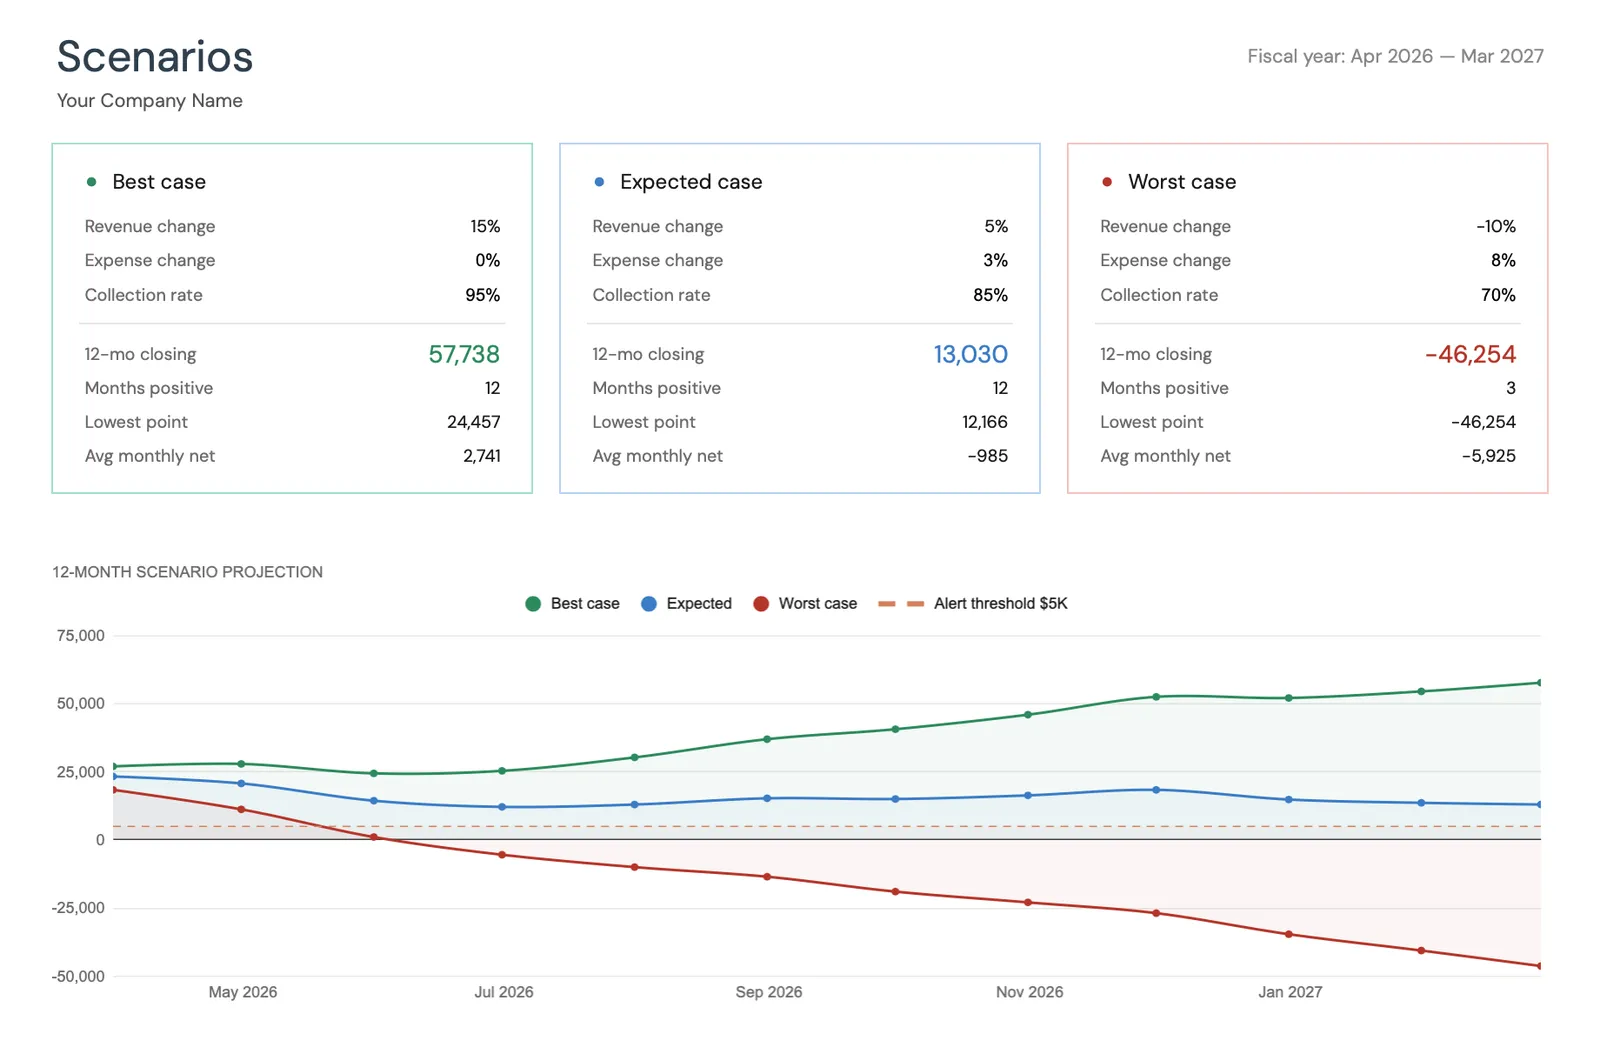
See your projected cash position through full seasonal cycles. Identify off-season months where the property operates below breakeven and calculate the reserves needed to bridge those periods.
Common Questions
Cash Flow for Airbnb / Short-term Rentals - FAQ
What occupancy rate makes a short-term rental profitable?
It depends entirely on your nightly rate versus fixed costs. Calculate your monthly breakeven: divide total monthly fixed costs by your net revenue per booked night (after cleaning costs and platform fees). If monthly costs are $2,500 and net revenue per night is $120, breakeven is about 21 nights or 70% occupancy. Most profitable short-term rentals achieve 55-75% annual average occupancy with higher rates during peak periods compensating for off-season dips.
How do I forecast seasonal pricing changes?
Use historical booking data or market comparable data to set monthly average nightly rates. Peak-season rates are typically 30-60% above off-season rates. Dynamic pricing tools can optimize nightly rates, but the forecast needs monthly averages. Multiply projected occupancy by projected average rate to estimate monthly revenue, then subtract platform fees and per-stay costs.
How much should I budget for furnishing replacement?
Plan to refresh furniture and decor every 2-3 years at a cost of $3,000-$10,000 depending on property size and quality level. Setting aside 3-5% of gross revenue monthly into a furnishing reserve fund prepares for these periodic refreshes. Guest reviews often decline when properties feel worn, so this investment directly affects future revenue.
Can this template handle multiple properties?
Yes. Track each property's revenue and expenses separately, then see the consolidated cash position. This is especially important because each property has different seasonal patterns, cost structures, and profitability levels. A portfolio view reveals which properties generate cash and which consume it.
How do I handle the gap between long-term rental income and short-term rental potential?
The forecast helps model this comparison directly. Enter your projected short-term rental revenue (with seasonal occupancy variations) and all associated costs. Compare the monthly net cash flow against what the same property would generate as a long-term rental (steady but lower). Many hosts find that short-term rentals are only more profitable during peak months, with the annual total sometimes comparable to long-term rental after accounting for all costs.
Can't find the answer you're looking for? Contact our team
Forecast cash flow for your airbnb / short-term rental
One-time purchase. No subscription. Your financial data stays in your Google Drive.