Stock Trading Journal Pro
Advanced trading journal for up to 200 trades with performance summary, monthly P&L, strategy analysis, and risk metrics.

Free vs Pro
- Log up to 50 trades with ticker, entry, exit, and P&L
- Dashboard with total P&L and win rate
- Monthly trade count and net P&L summary
- Works in Excel and Google Sheets
- Log up to 200 trades with ticker, date, direction (Long/Short), shares, entry price, exit price, strategy, and notes
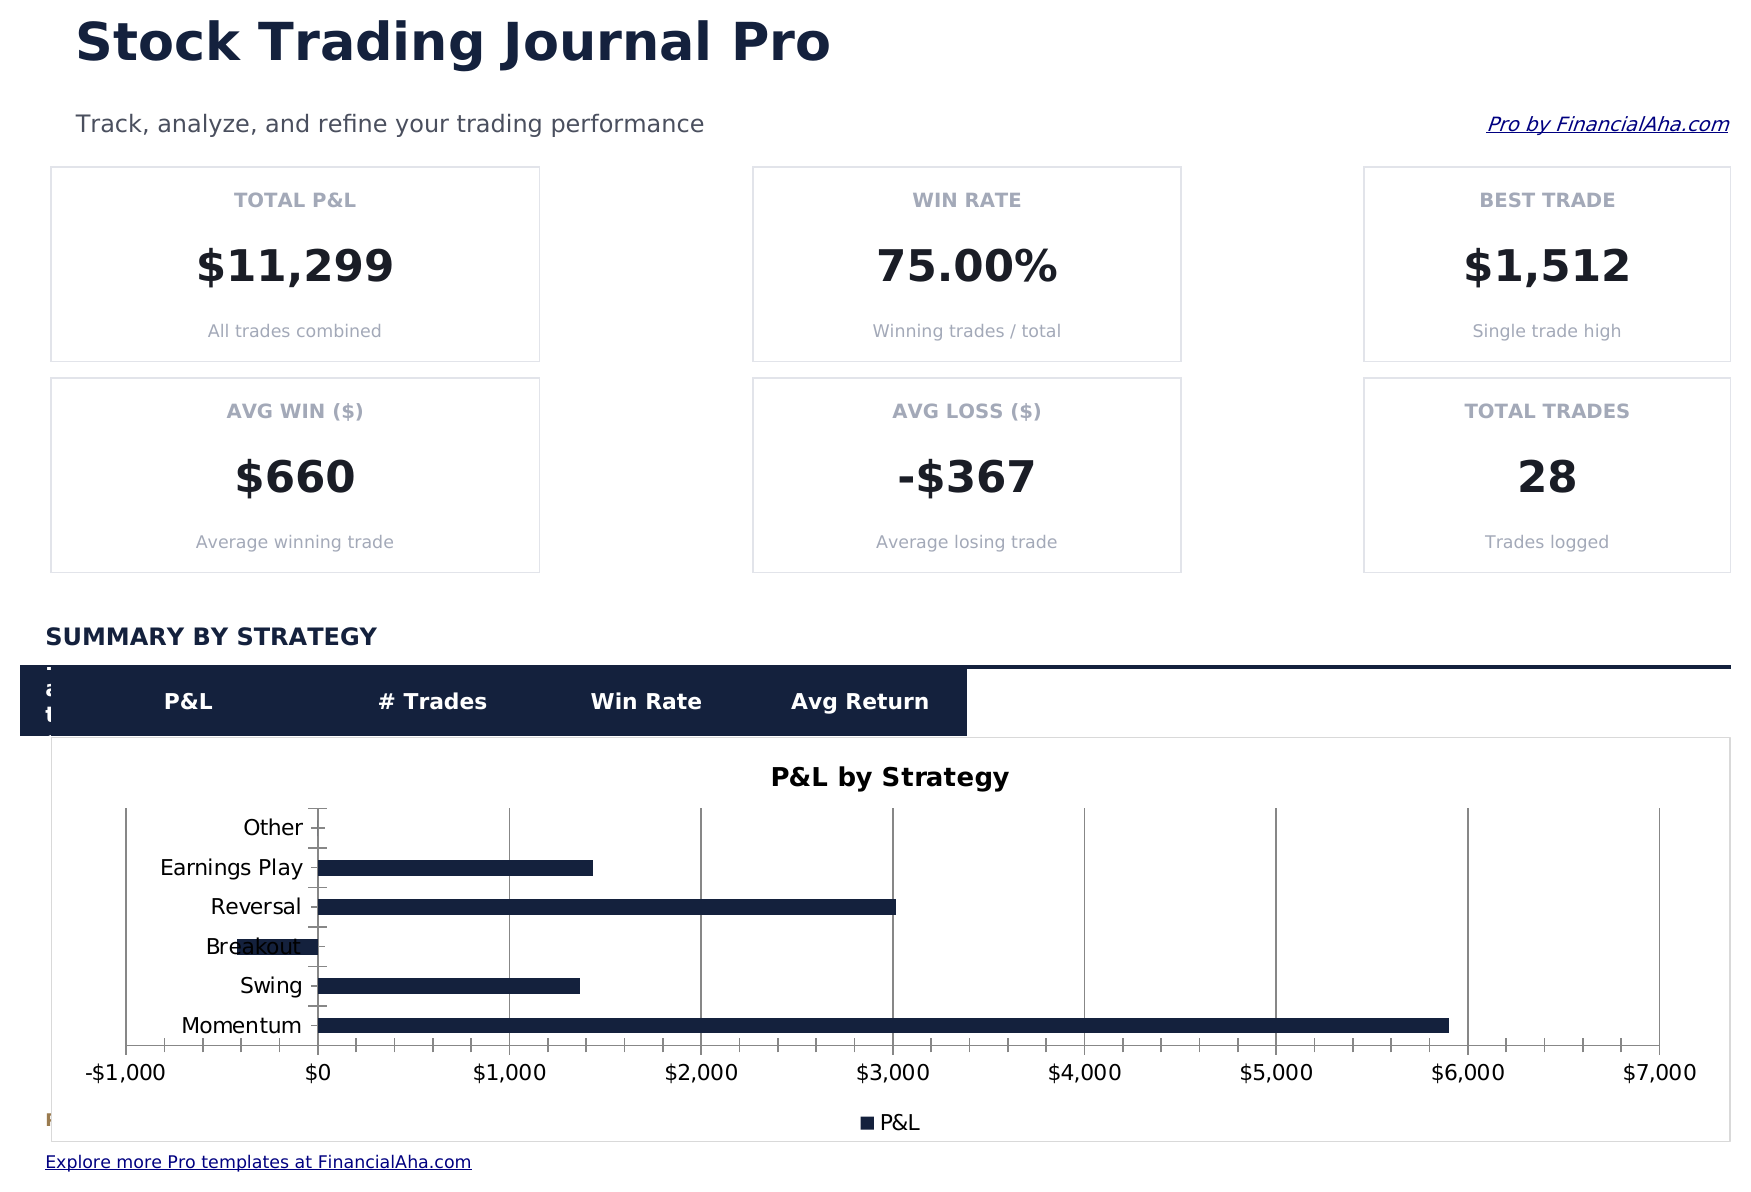
- Dashboard with 6 KPI cards: total P&L, win rate, best trade, average win, average loss, and total trades
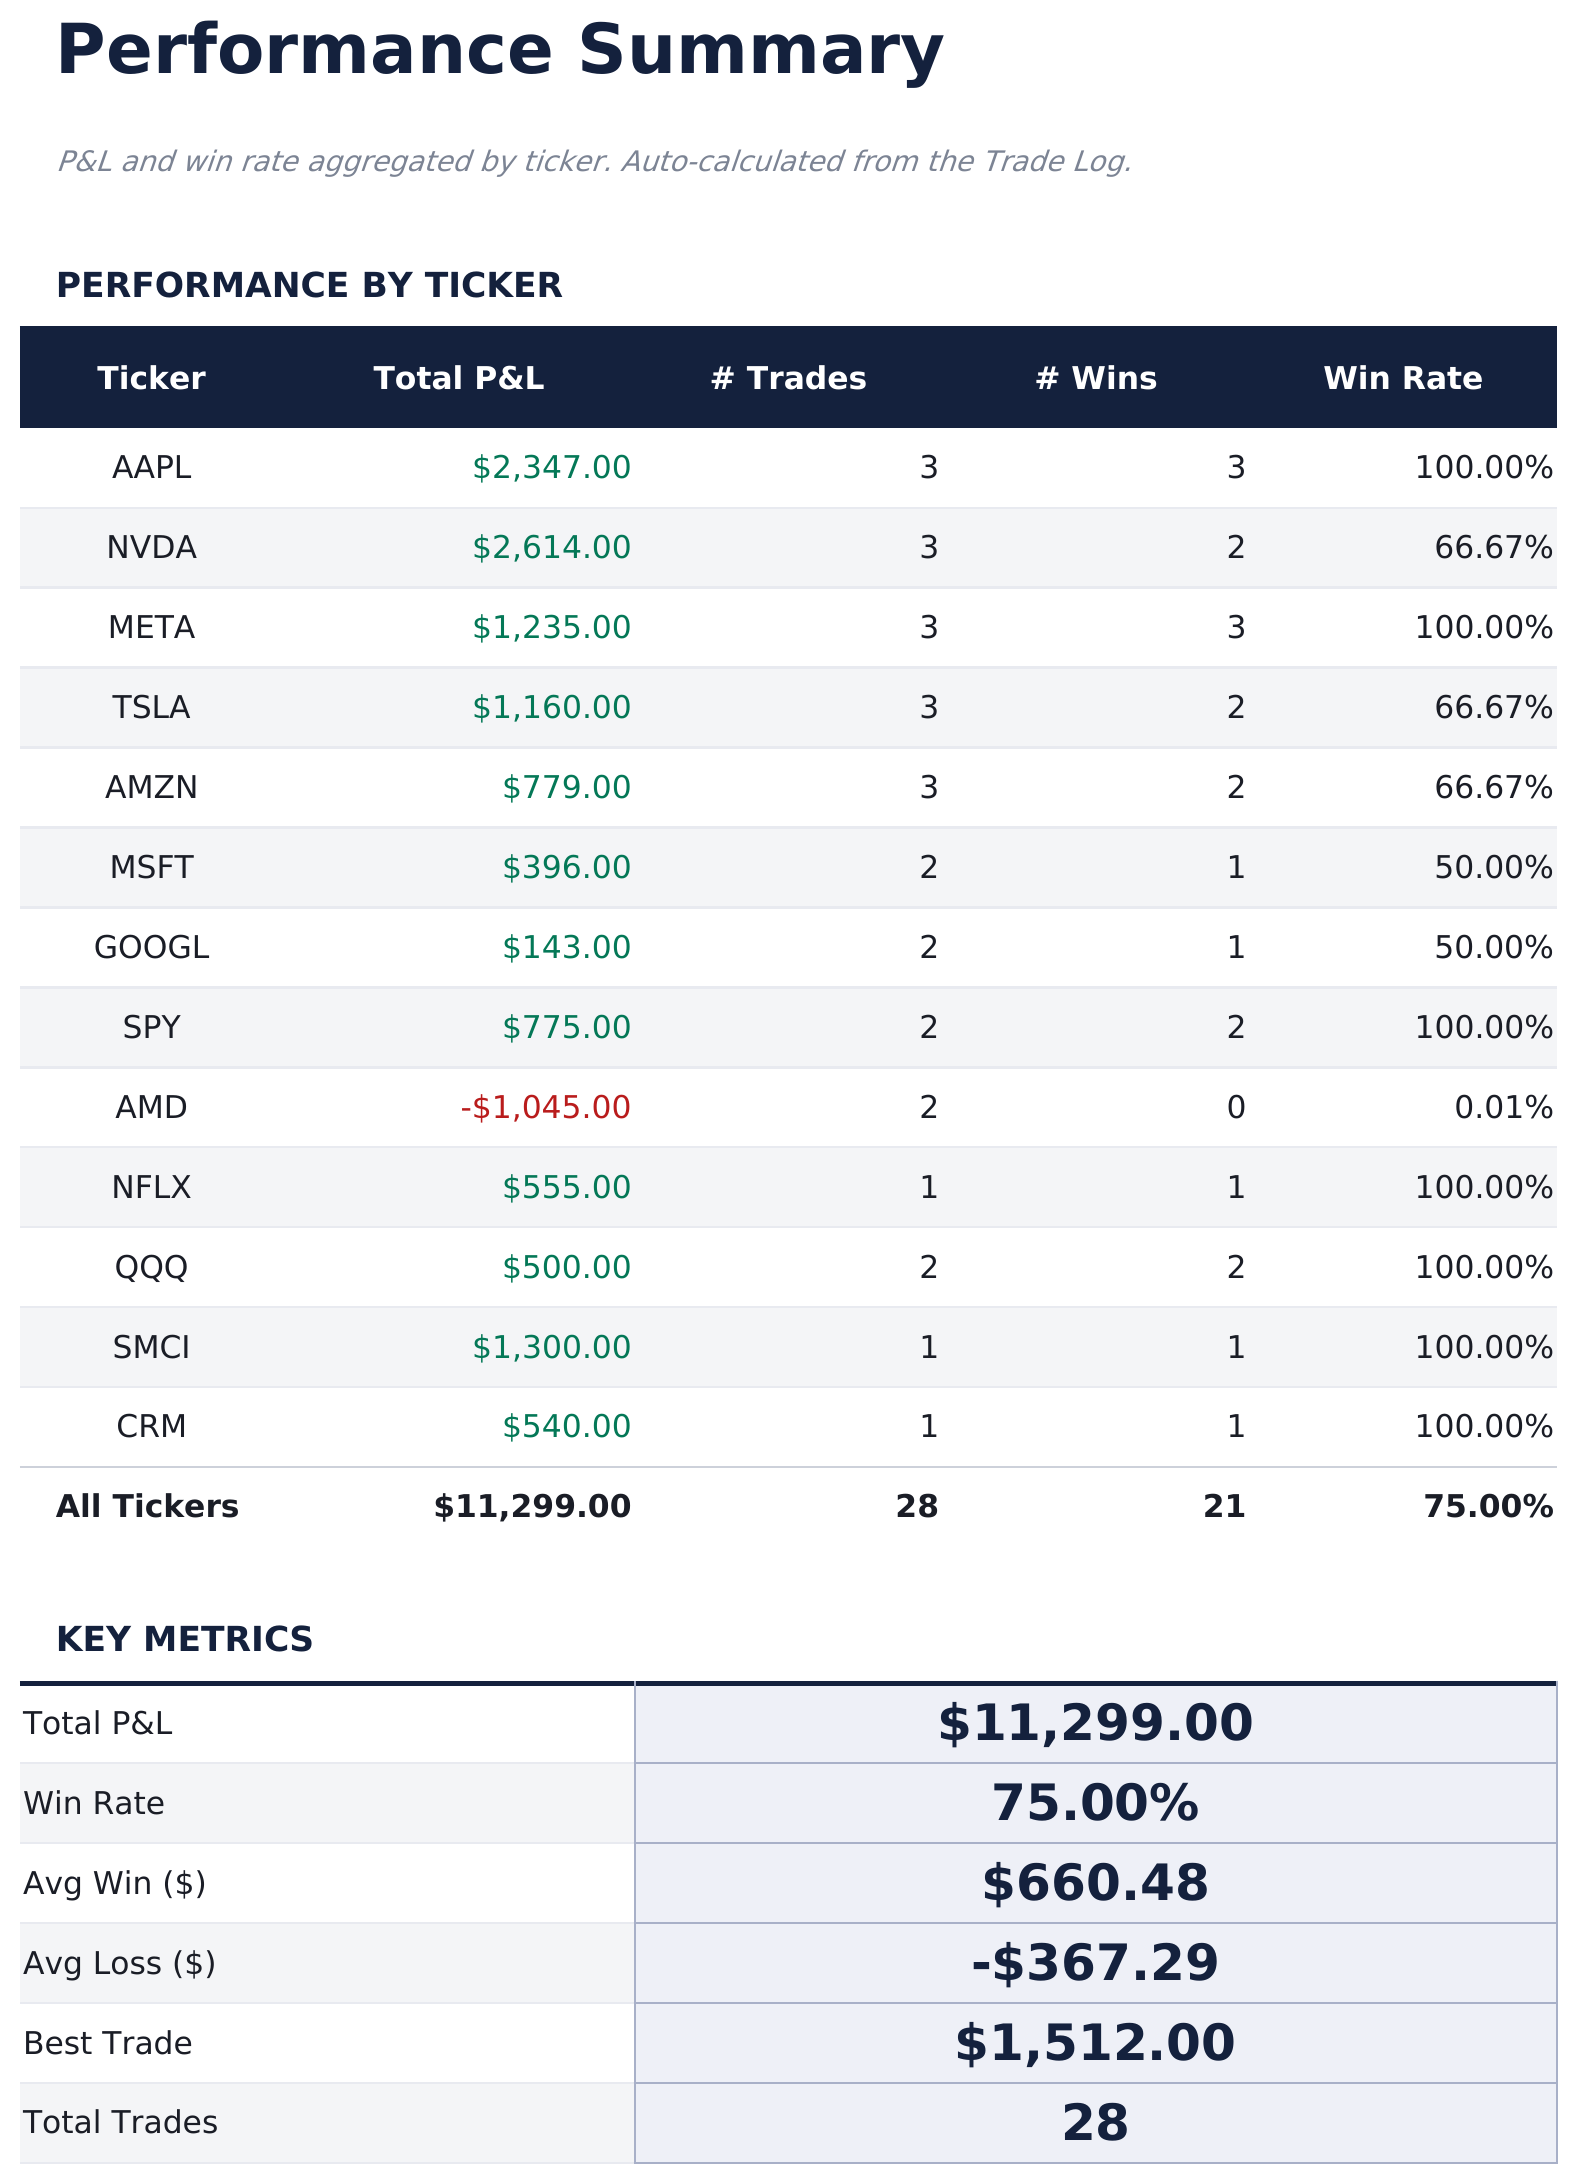
- Performance Summary showing total trades, wins, losses, win rate, average gain, average loss, and largest win and loss by ticker
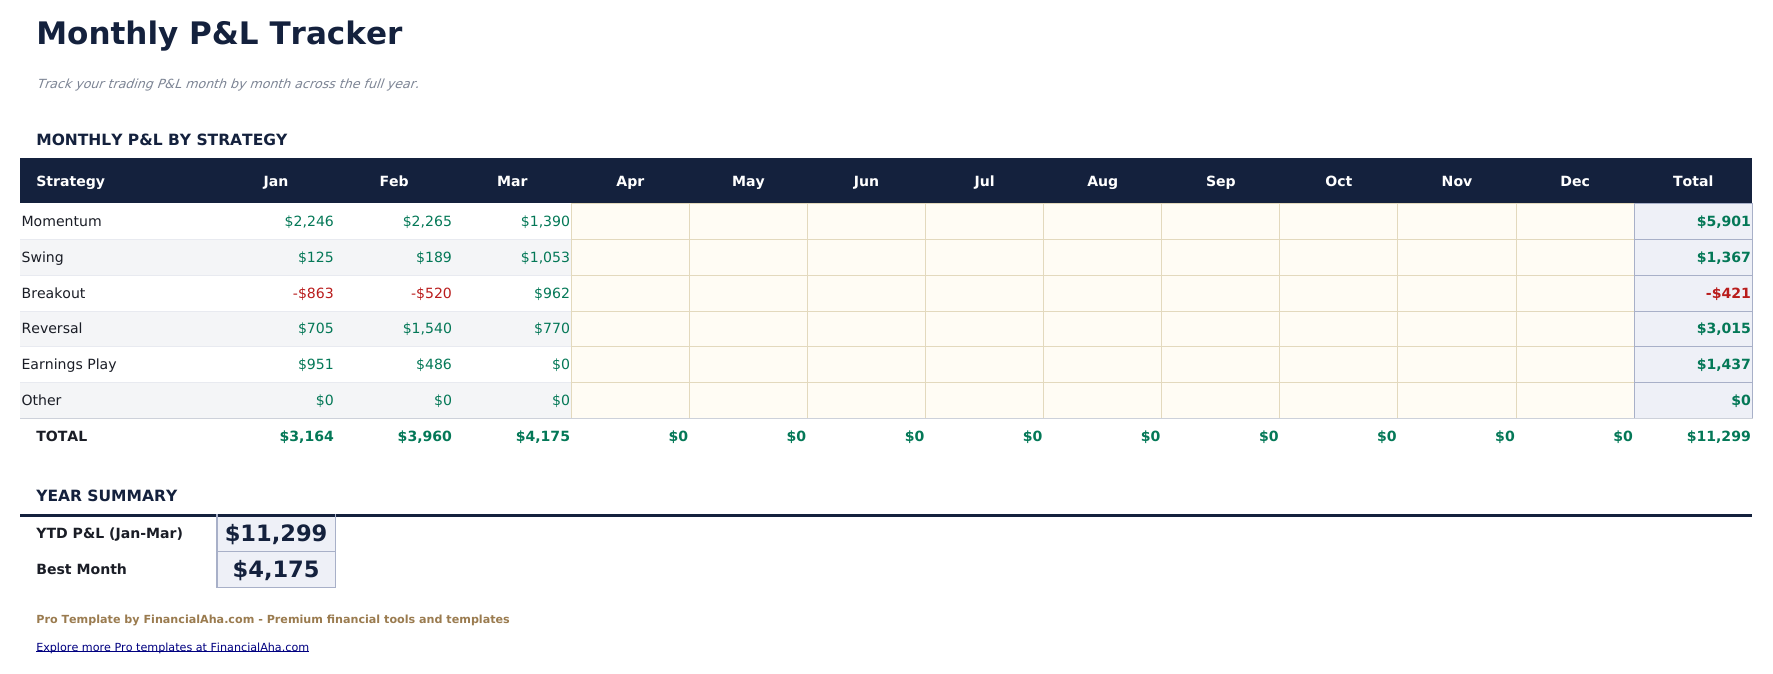
- Monthly P&L sheet aggregating trades by month: total trades, wins, losses, gross profit, gross loss, and net P&L per month
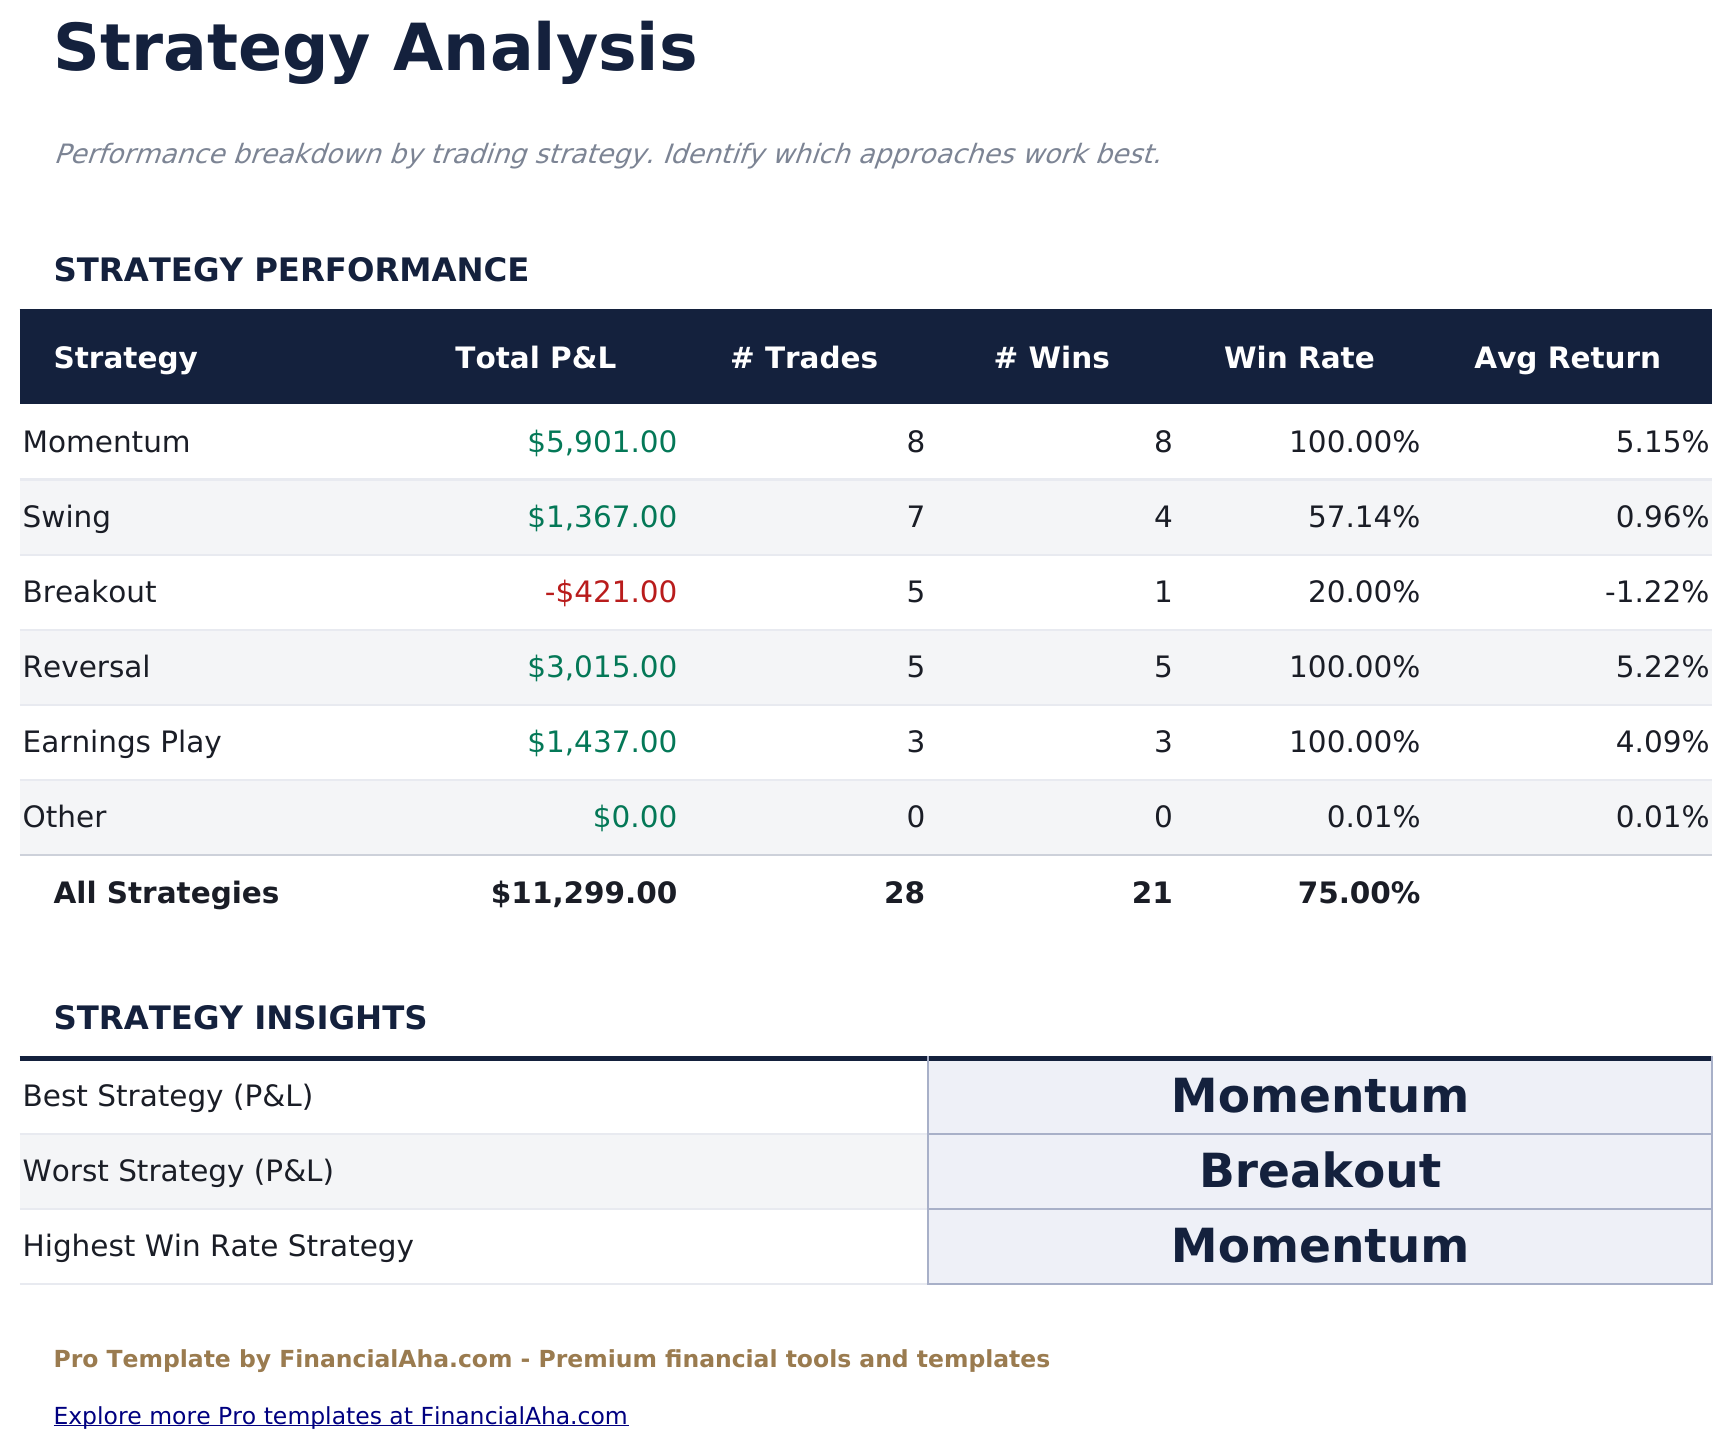
- Strategy Analysis breaking down performance by trading strategy: win rate, average P&L, net P&L, and trade count per strategy
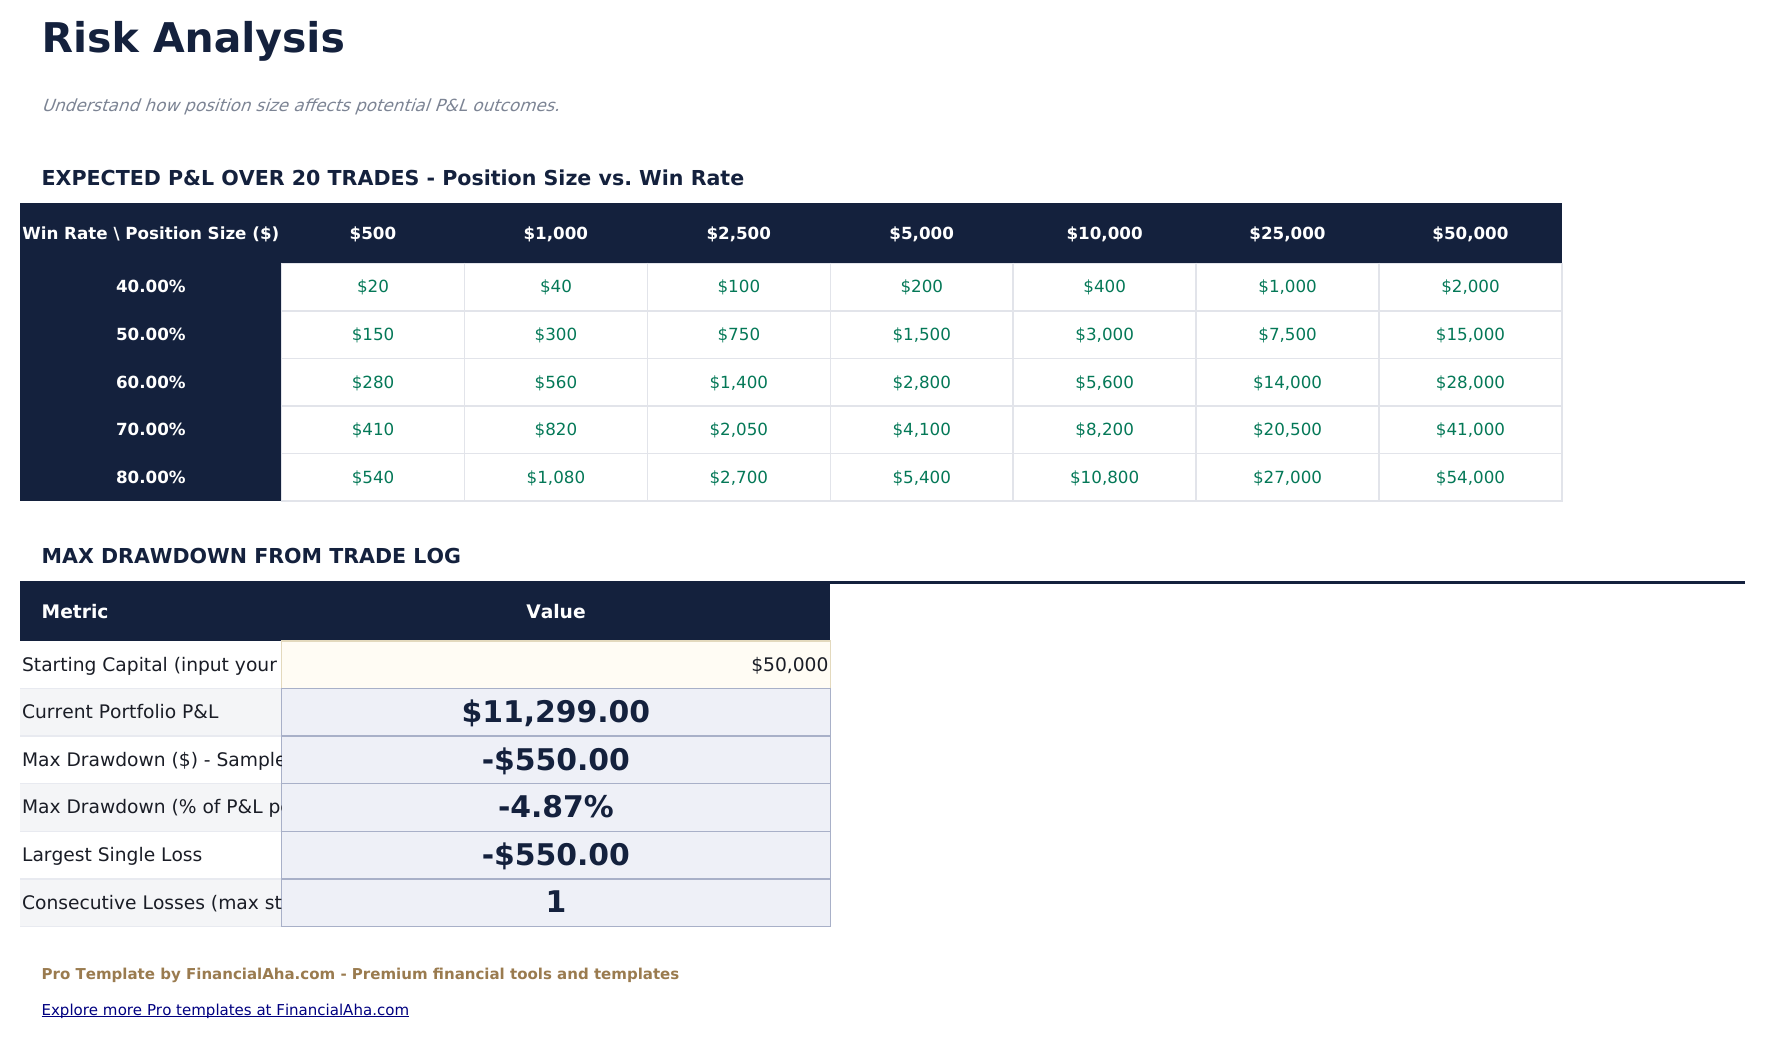
- Risk Analysis showing average risk per trade, average reward-to-risk ratio, maximum drawdown, and consecutive loss streak
- Automatic P&L calculation per trade based on shares, entry, and exit prices
- Works in Microsoft Excel, Google Sheets, and LibreOffice Calc with no macros required
Preview
See what's inside this template
How to Use This Template
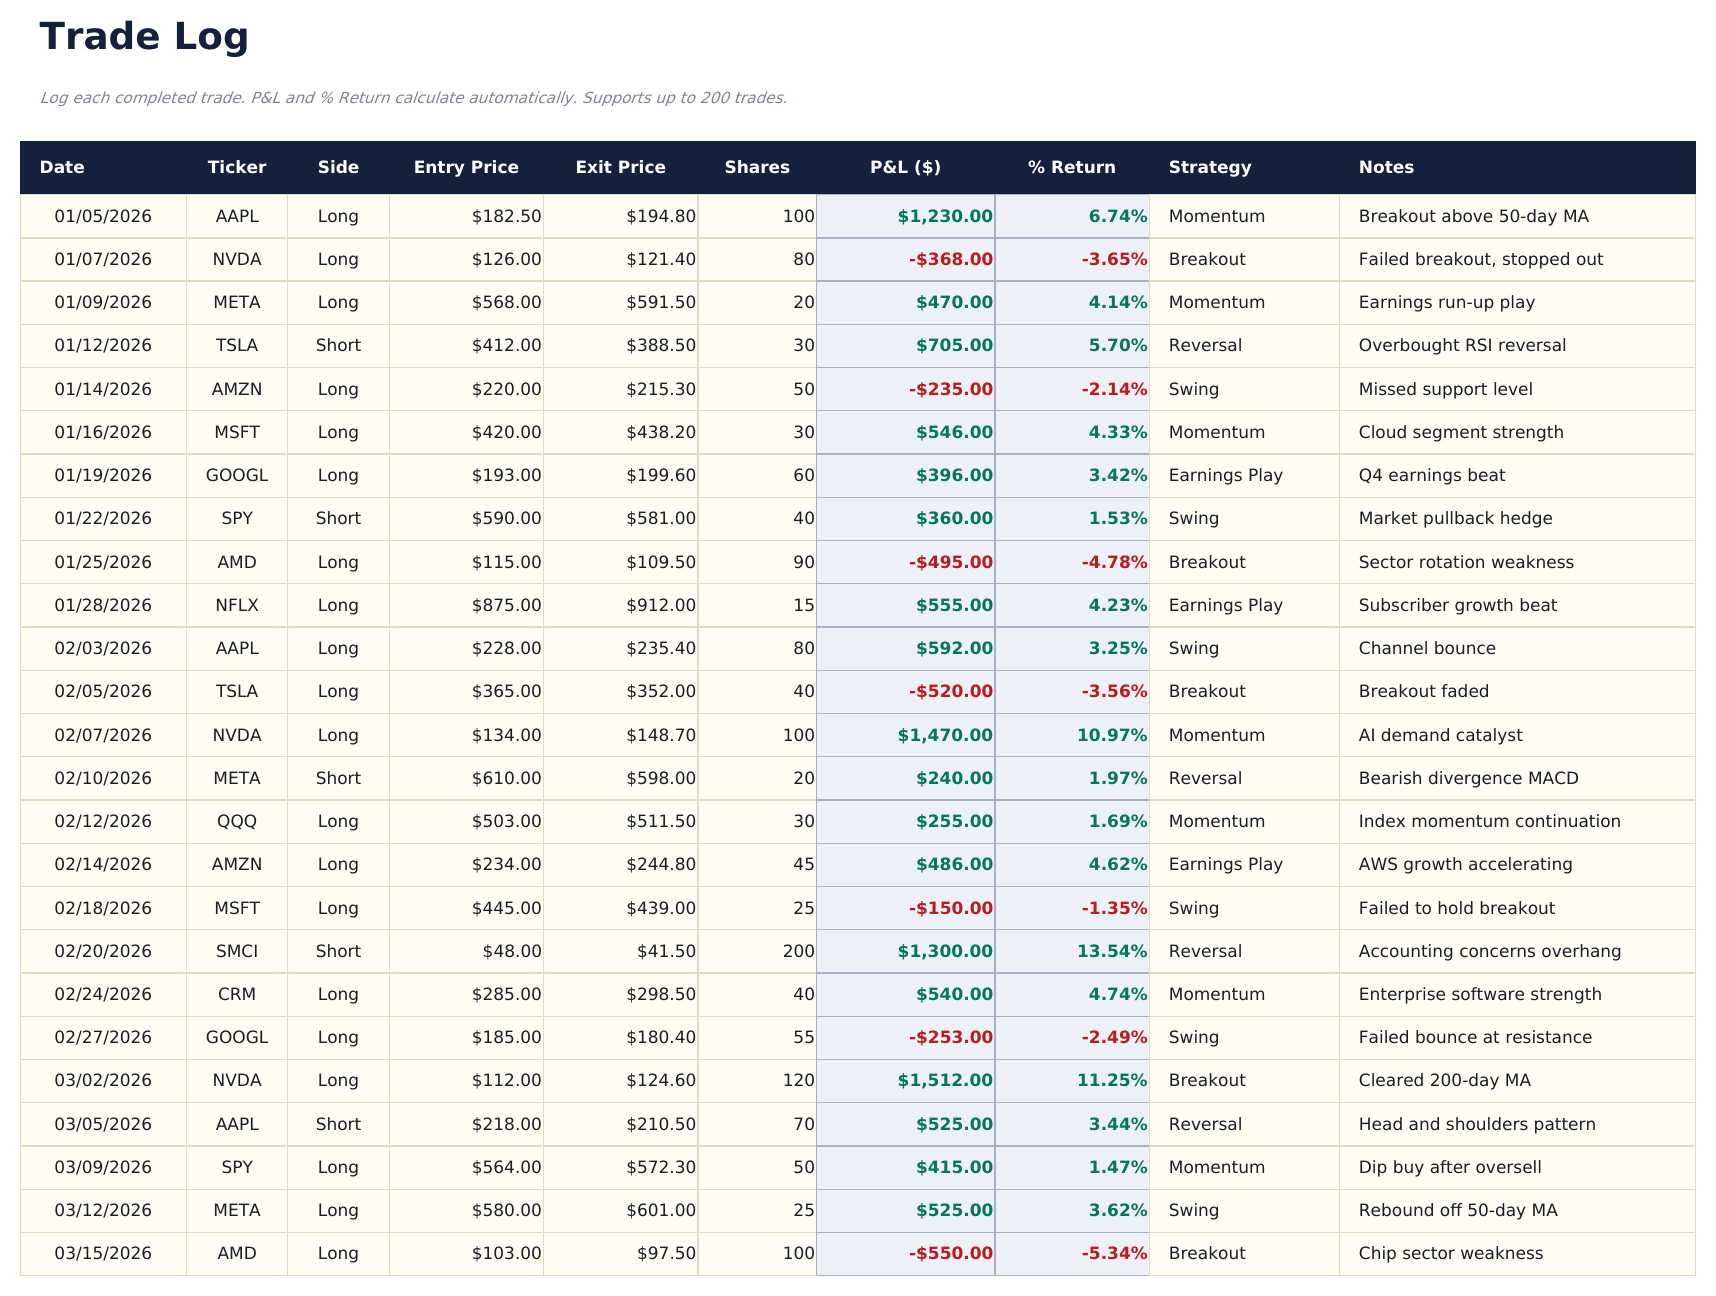
Log each trade
Go to the Trade Log and enter each completed trade: ticker, date, direction (Long or Short), number of shares, entry price, exit price, strategy tag, and any notes.
Review performance metrics
The Performance Summary shows win rate, average win and loss, total P&L by ticker, and other statistics calculated automatically from the trade log.
Track by strategy
Use the Strategy Analysis sheet to compare performance across different trading approaches. This helps identify which strategies are working and which are not.
Monitor risk metrics
Check the Risk Analysis sheet for reward-to-risk ratio, maximum drawdown, and consecutive loss streaks - useful for assessing position sizing and risk management.
Built by Claude AI. Perfected by us.
We use Claude AI to draft each template, after a deep research. Then our team steps in. We refine the layout, stress-test every formula, fix edge cases, and polish the design until it feels like something we would actually use ourselves. The AI gets us 80% there. The last 20% is all human judgment.
One-time purchase. No subscription. Works in Excel & Google Sheets.
Frequently Asked Questions
How many trades can I log?
The Pro version supports 200 trades - four times the free version. Each entry captures ticker, direction, shares, entry price, exit price, strategy tag, and notes. P&L calculates automatically.
How is win rate calculated?
Win rate is the number of trades with positive P&L divided by total closed trades. The Performance Summary breaks this down by ticker, and the Strategy Analysis sheet shows win rate per strategy.
How does strategy analysis work?
Tag each trade with a strategy name (for example, Breakout, Mean Reversion, Earnings Play). The Strategy Analysis sheet groups trades by tag and shows win rate, average P&L, total net P&L, and trade count per strategy.
What does the risk analysis show?
It calculates average risk per trade (using stop distance if provided), average reward-to-risk ratio, maximum drawdown (peak-to-trough in cumulative P&L), and the longest consecutive losing streak in the log.
Can I track both stocks and ETFs?
Yes. The ticker field accepts any symbol. The template does not connect to market data, so all prices are entered manually from your broker records.
What do I get after purchase?
You receive an Excel file (.xlsx) that works in Microsoft Excel, Google Sheets, and LibreOffice Calc. Download it immediately after purchase - no signup or account required.
Is there a free version?
Yes. The free version of this template is available with basic features. The Pro version adds advanced analysis, more capacity, and additional sheets.
What if it does not work for me?
Contact us and we will help troubleshoot. The template works in Microsoft Excel, Google Sheets, and LibreOffice Calc with no macros required.
Looking for more Pro templates?
We offer Pro versions of our most popular spreadsheet templates with advanced features, more capacity, and deeper analysis.