NPV & IRR Calculator Pro
Multi-project investment analysis comparing up to 3 projects with 15-year cash flow projections, sensitivity analysis at 9 discount rates, and project ranking by NPV, payback, and profitability index.
Free vs Pro
- Analyze a single project with 10-year cash flows
- Dashboard with NPV, payback period, and bar chart
- Discount rate and cash flow inputs
- Works in Excel and Google Sheets
- Compare up to 3 investment projects side by side with independent cash flow projections
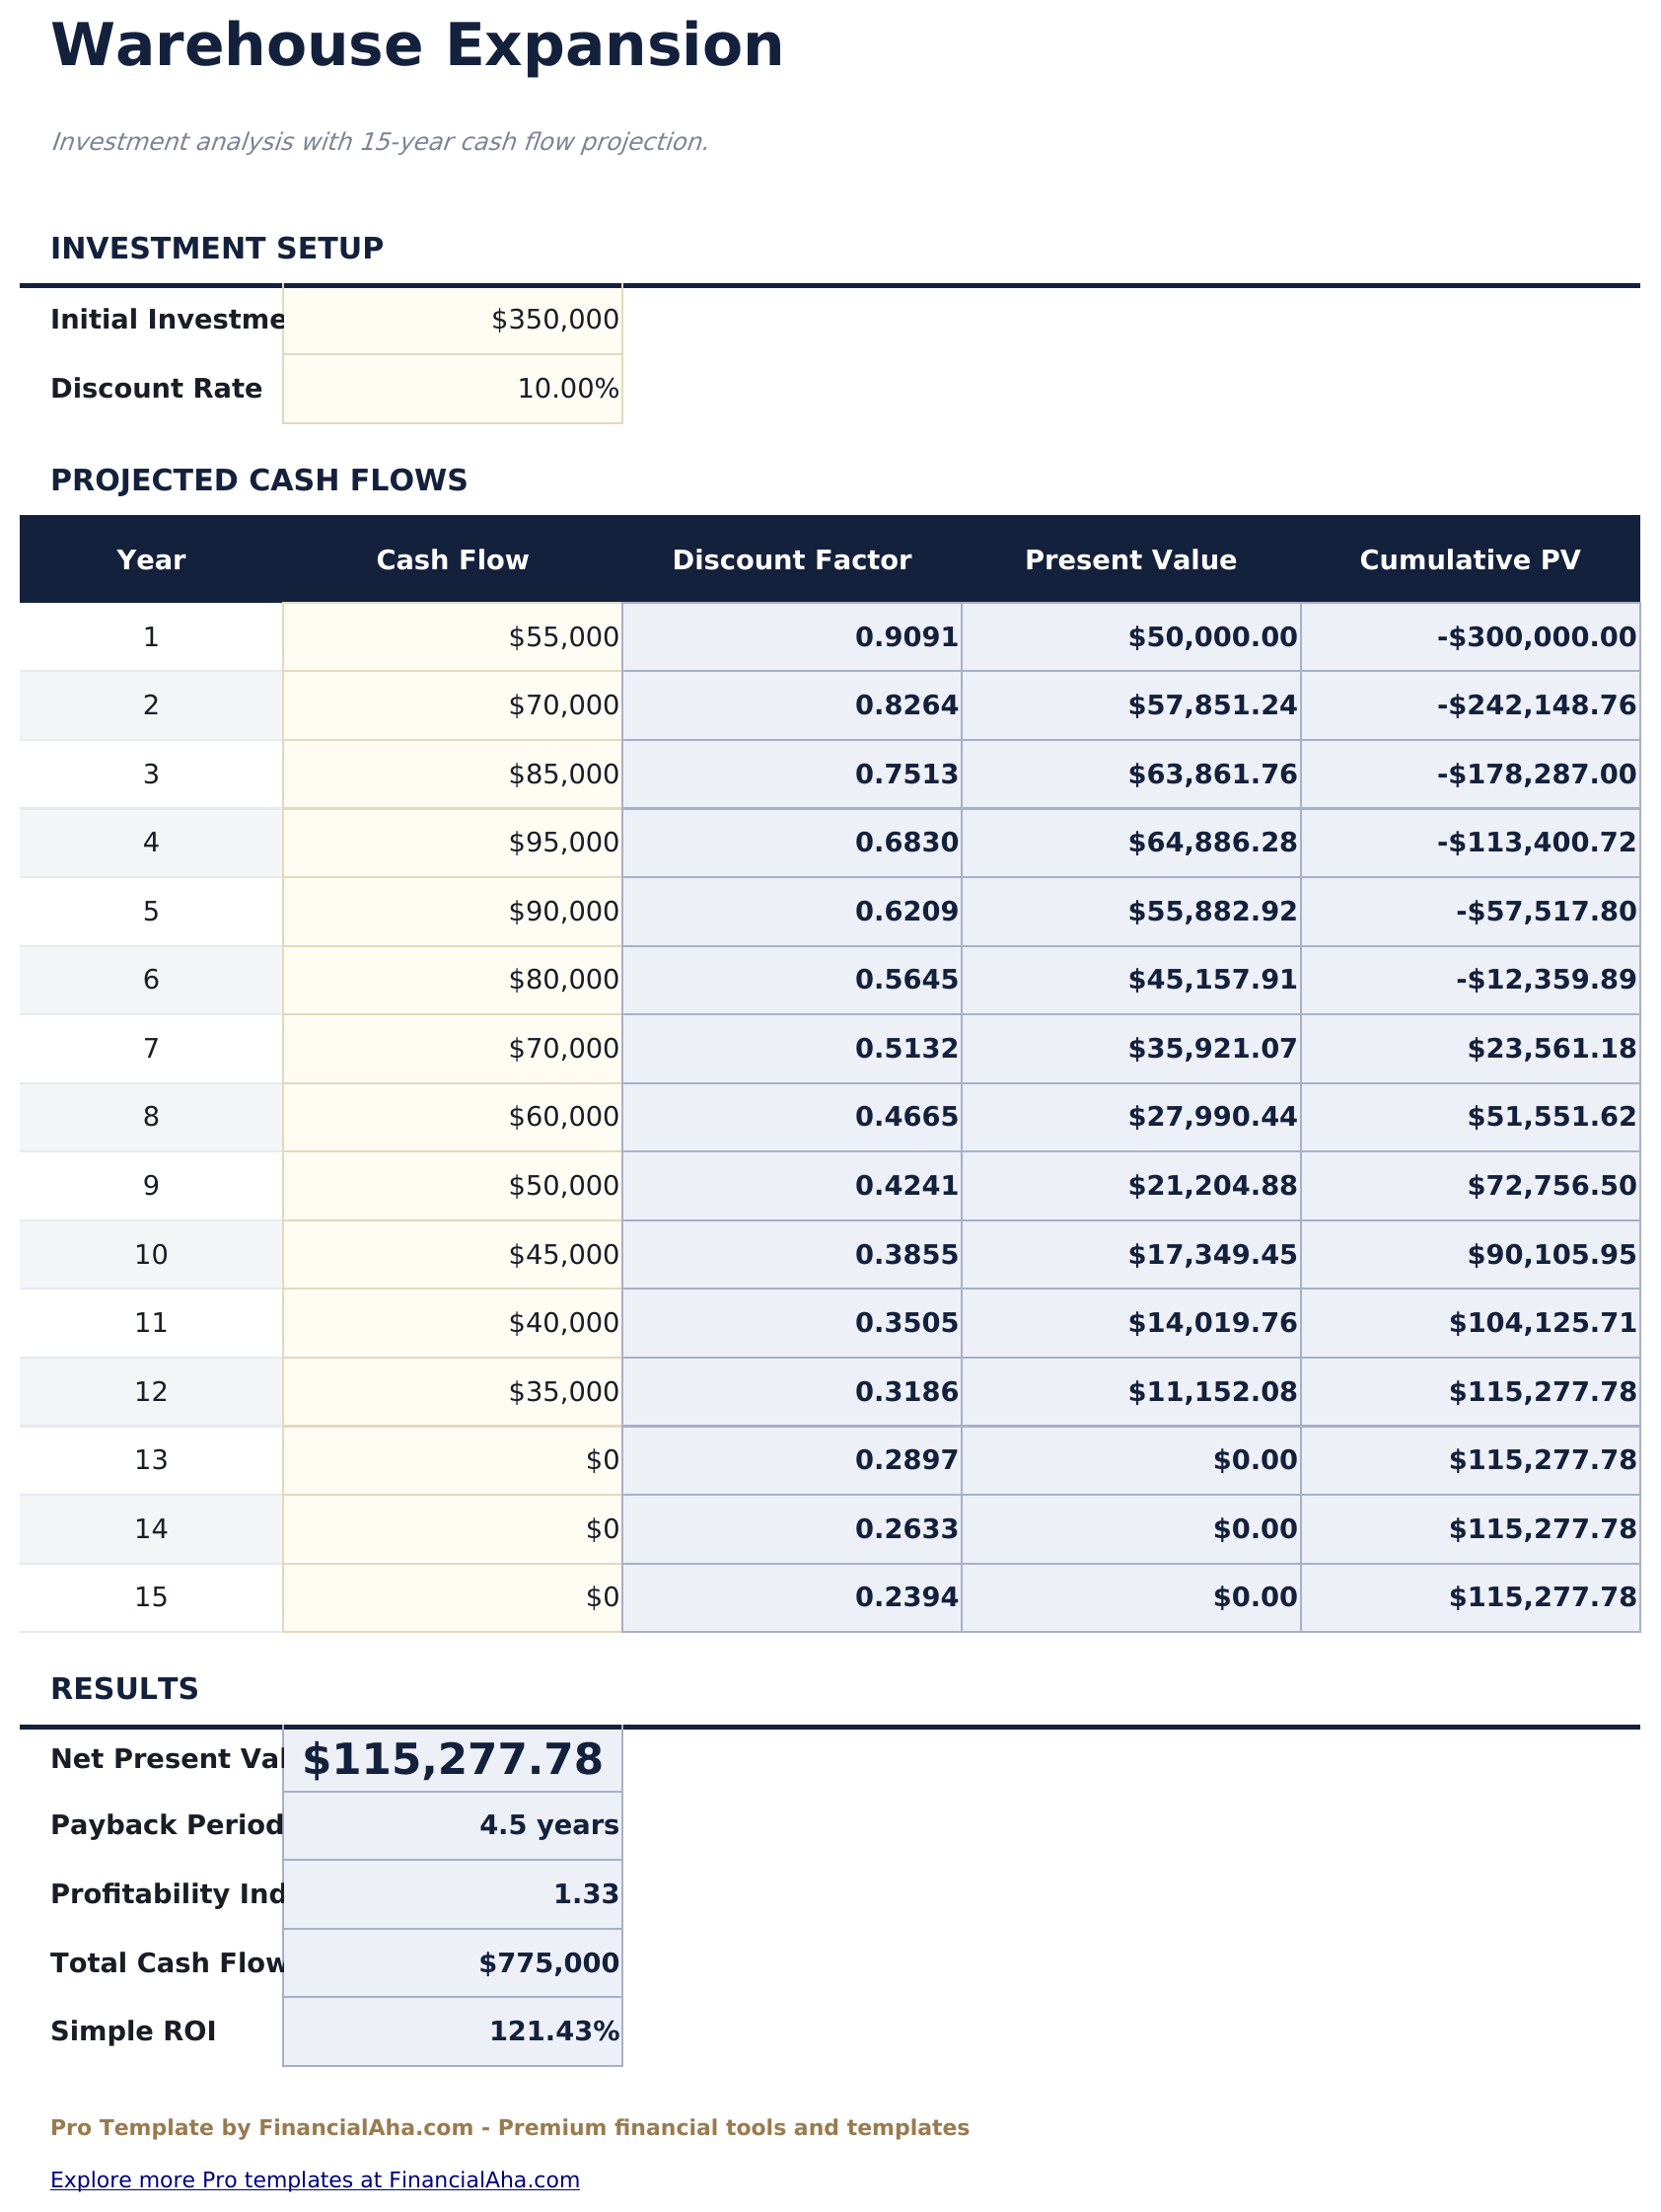
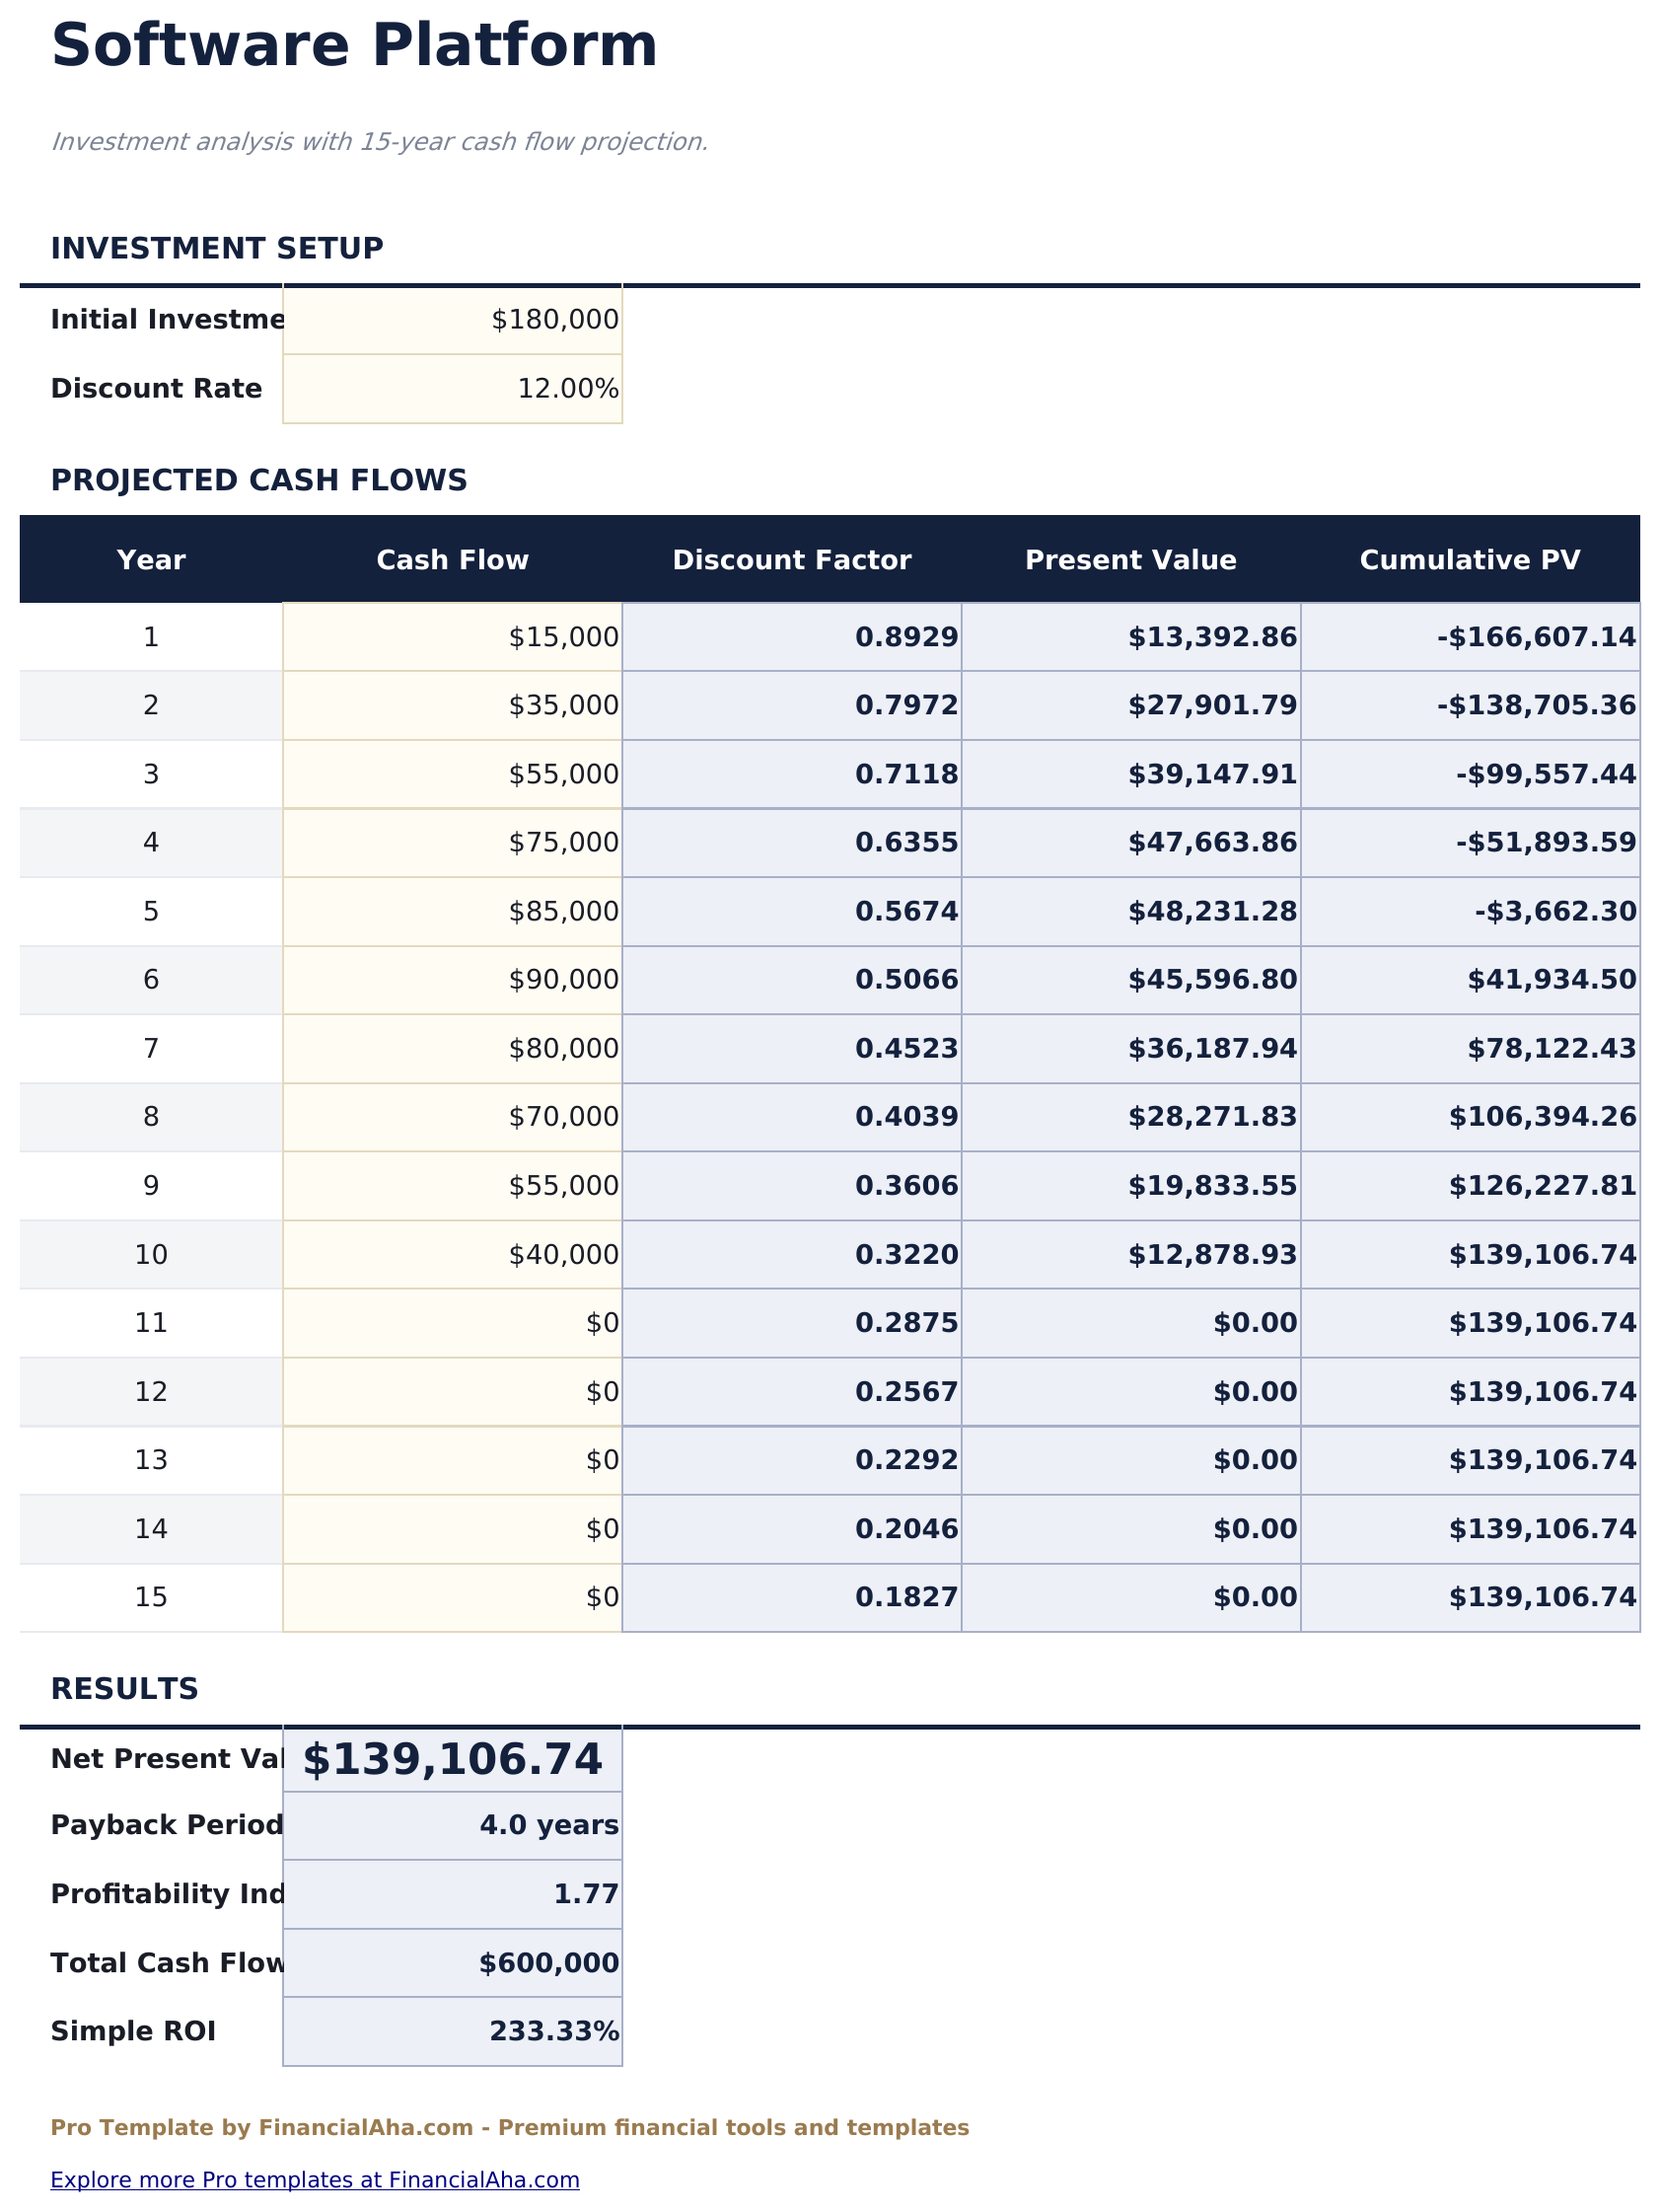
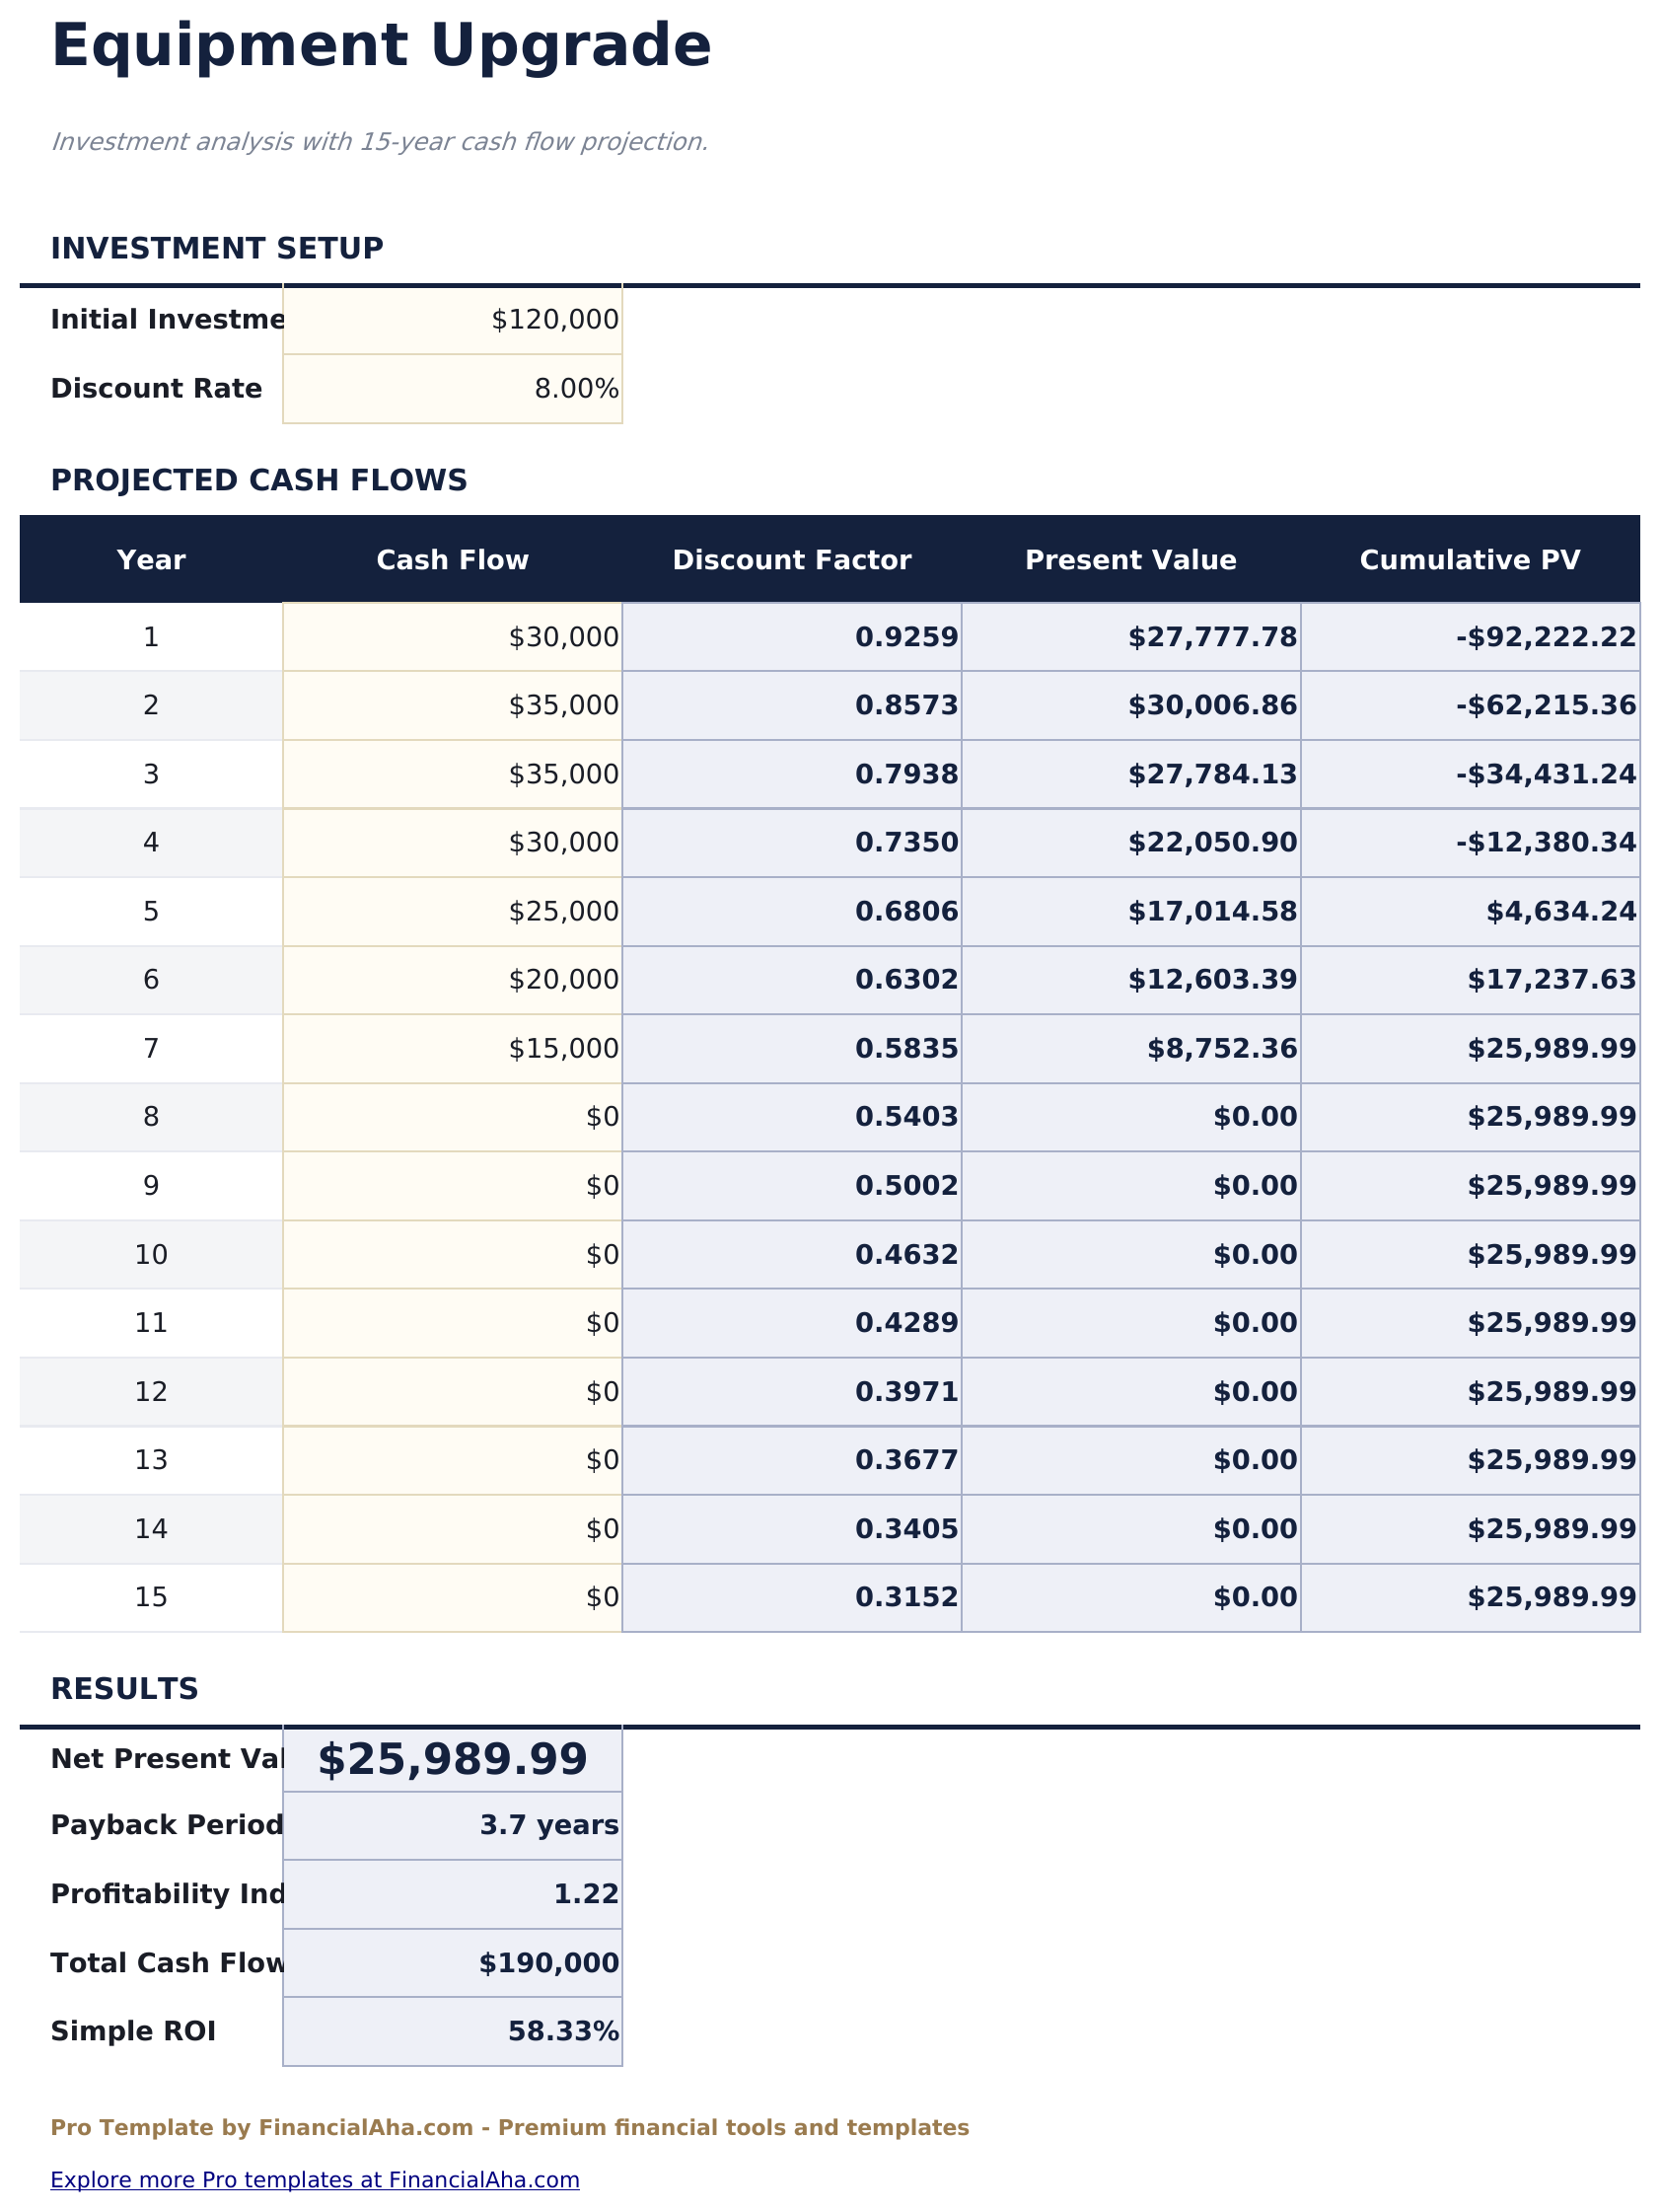
- Each project has a dedicated sheet with 15-year cash flow table, discount factors, present values, and cumulative PV
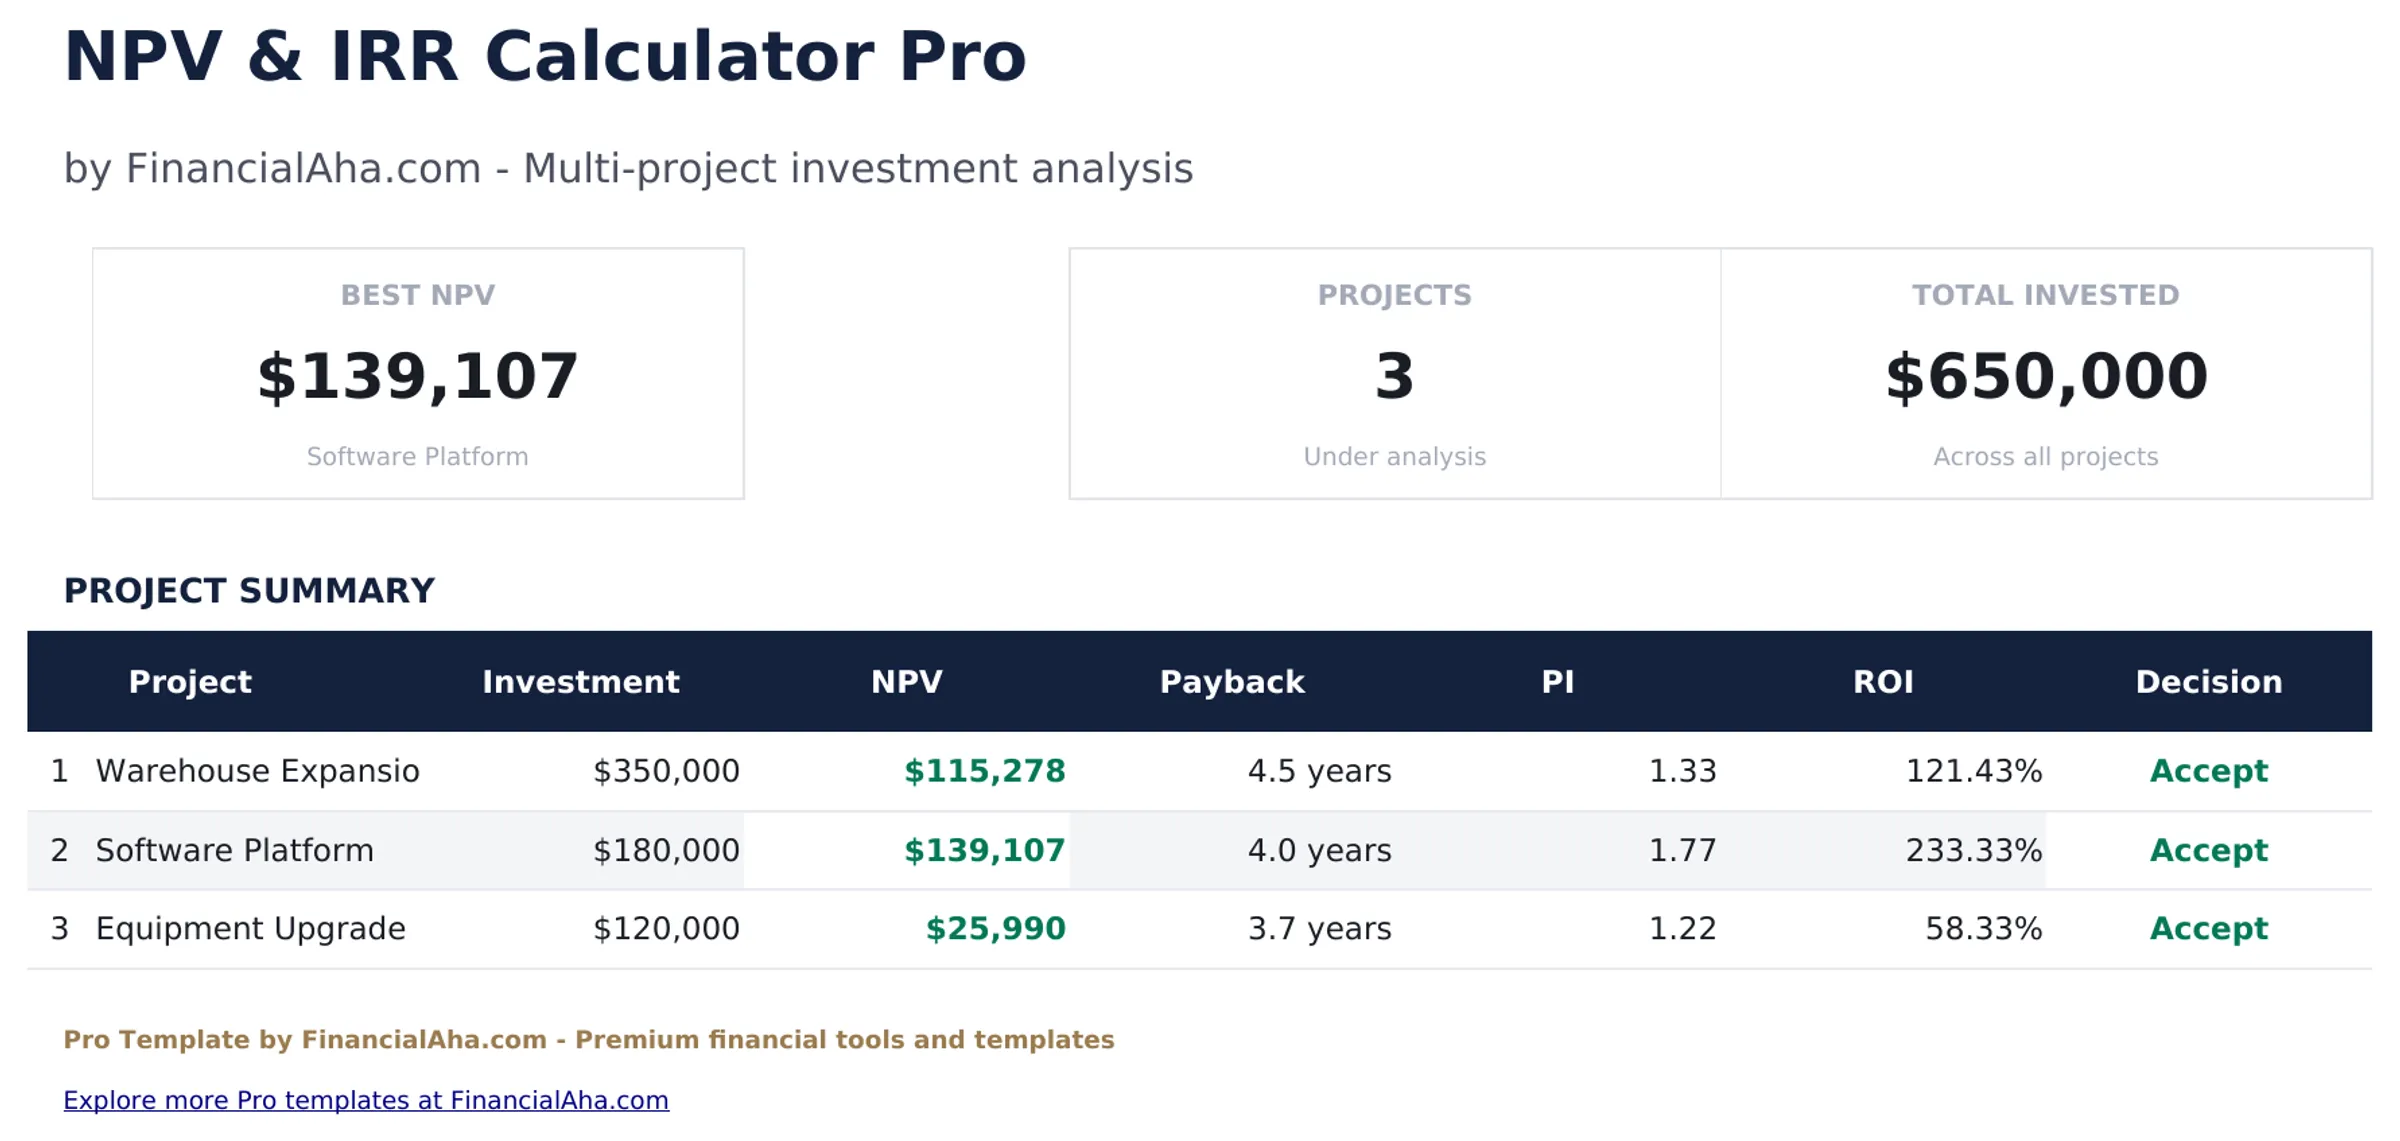
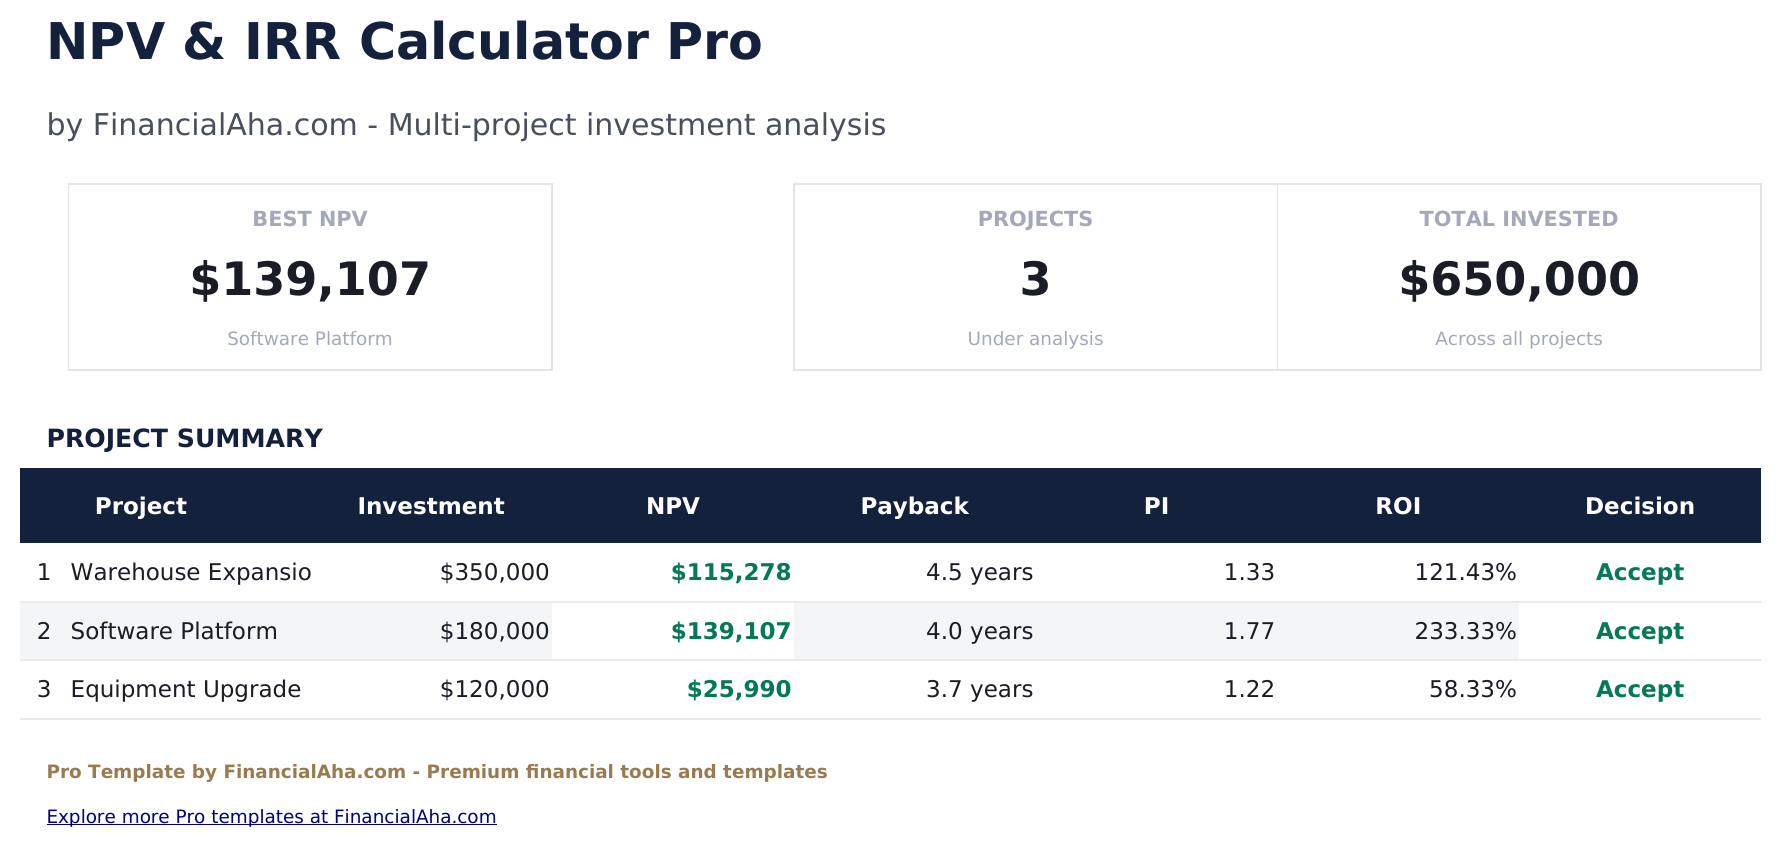
- Dashboard with portfolio KPIs: best NPV, project count, total invested, and a summary table with Accept/Reject decisions
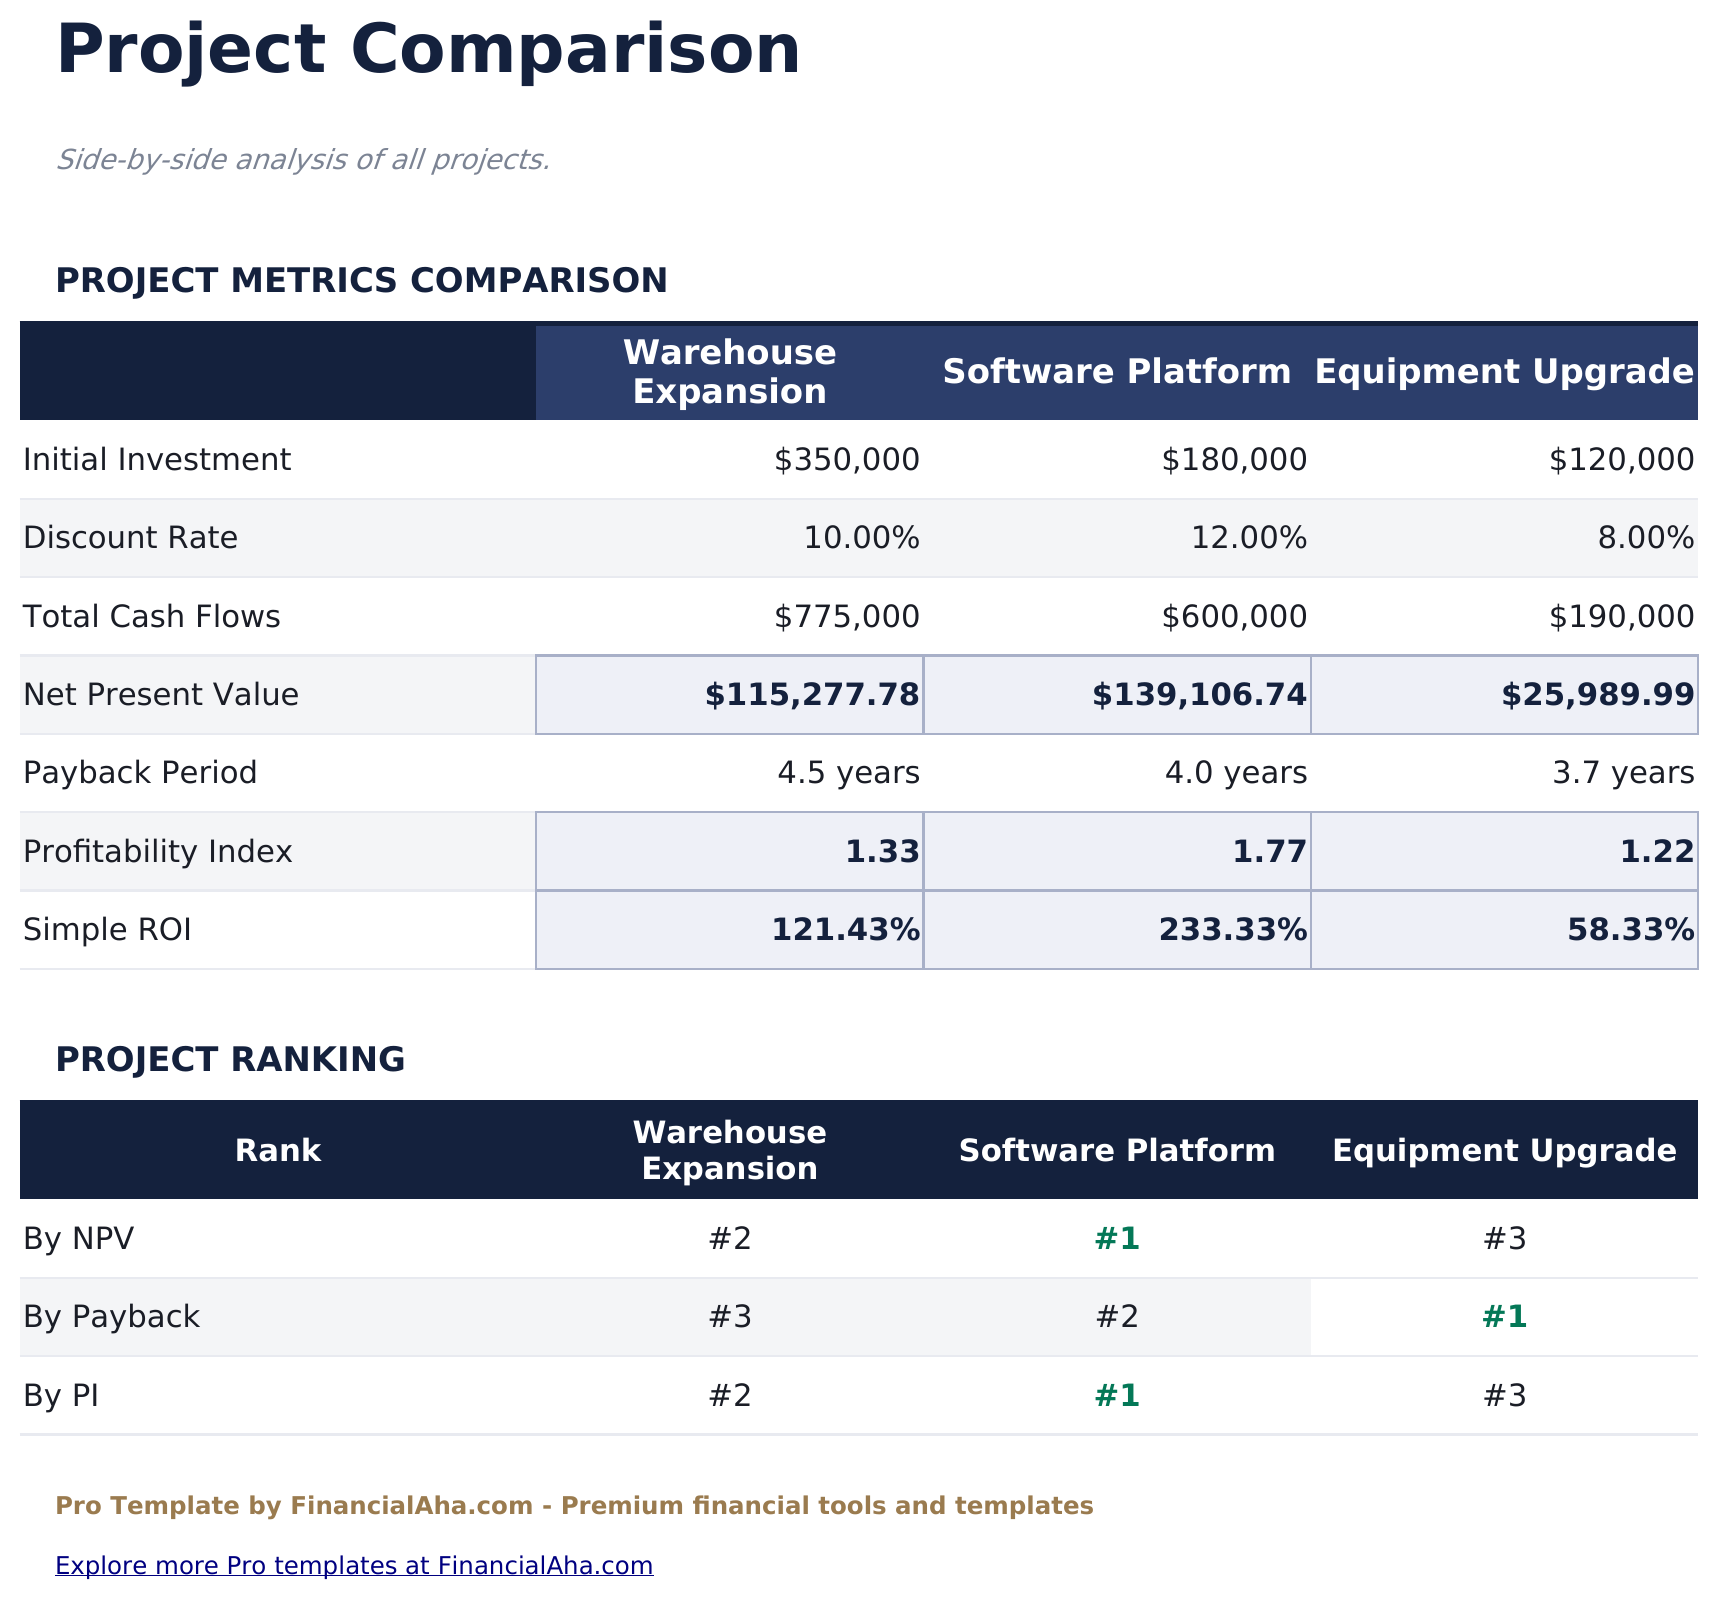
- Comparison sheet ranking all projects by NPV, payback period, and profitability index
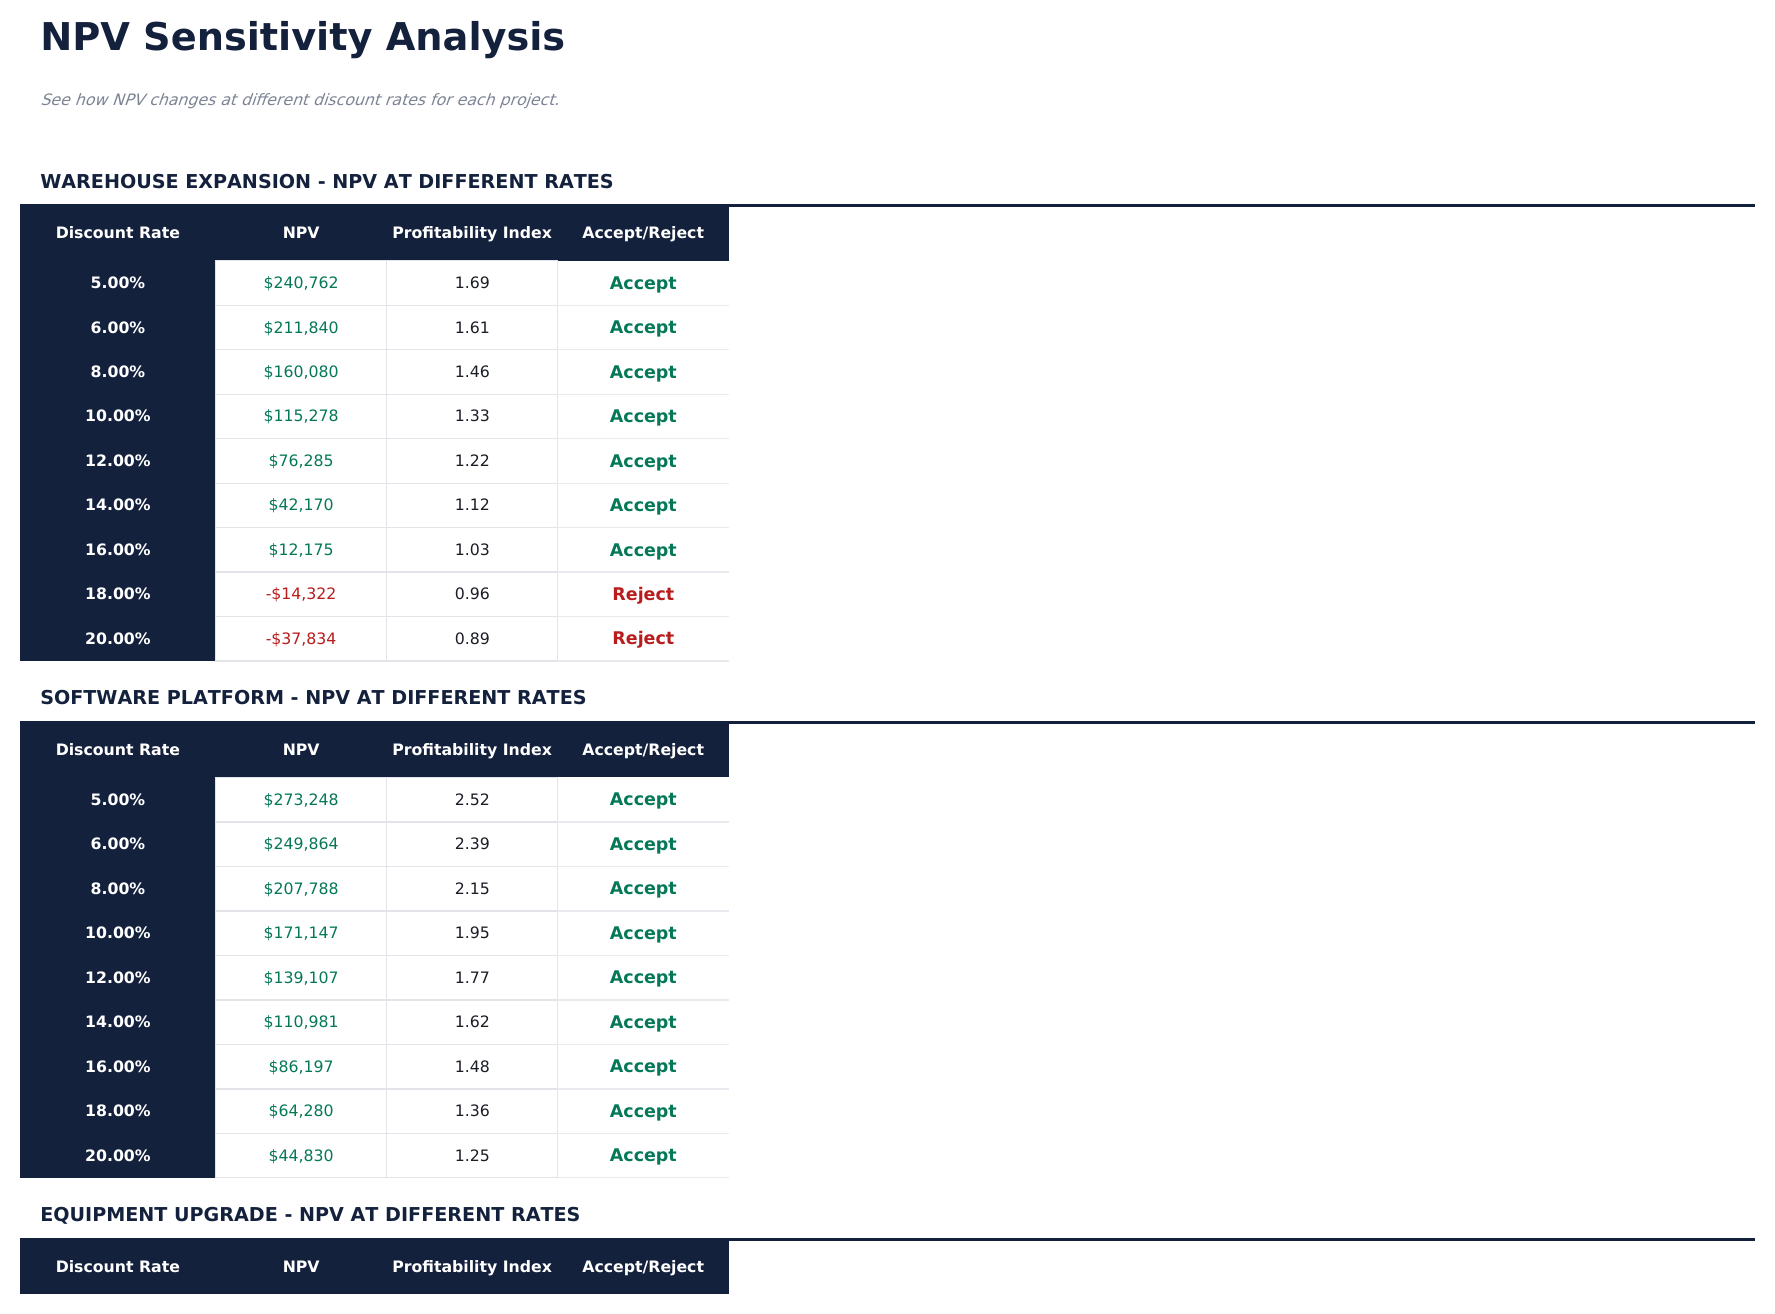
- Sensitivity analysis showing NPV, profitability index, and Accept/Reject at 9 different discount rates per project
- Automatic calculations: NPV, payback period, profitability index, simple ROI for every project
- Editable discount rate and cash flows per project - all downstream calculations update automatically
- Works in Microsoft Excel, Google Sheets, and LibreOffice Calc with no macros required
Preview
See what's inside this template
How to Use This Template
Enter project details
Go to each project sheet and enter the initial investment, discount rate (cost of capital), and projected cash flows for up to 15 years.
Compare projects
The Comparison sheet shows all projects side by side: investment, NPV, payback period, profitability index, and ROI with project rankings.
Run sensitivity analysis
The Sensitivity sheet shows how NPV changes at 9 different discount rates for each project, helping find the approximate IRR.
Make your decision
The Dashboard summarizes all projects with Accept/Reject recommendations based on positive NPV.
Built by Claude AI. Perfected by us.
We use Claude AI to draft each Pro template after deep research. Then our team steps in - refining the layout, stress-testing every formula, fixing edge cases, and polishing the design. The AI gets us 80% there. The last 20% is all human judgment.
One-time purchase. No subscription. Works in Excel & Google Sheets.
Frequently Asked Questions
How many projects can I compare?
The Pro version supports 3 projects, each with its own sheet and 15-year cash flow projection. The Comparison sheet ranks them side by side.
How does the sensitivity analysis work?
For each project, the template calculates NPV and profitability index at 9 different discount rates (5% to 20%). An Accept/Reject column shows whether the project creates value at each rate.
What is the profitability index?
The profitability index is the present value of future cash flows divided by the initial investment. A PI above 1.0 means the project creates more value than it costs. The Comparison sheet ranks projects by PI.
Can I change the project names?
The sheet tab names match the sample projects. You can rename the tabs in Excel or Google Sheets to match your actual project names.
How is payback period calculated?
The payback period is the time it takes for cumulative cash flows to equal the initial investment. The template calculates fractional years for precision - for example, 4.3 years means recovery happens partway through year 5.
What do I get after purchase?
You receive an Excel file (.xlsx) that works in Microsoft Excel, Google Sheets, and LibreOffice Calc. Download it immediately after purchase - no signup or account required.
Is there a free version?
Yes. The free version of this template is available with basic features. The Pro version adds advanced analysis, more capacity, and additional sheets.
What if it does not work for me?
Contact us and we will help troubleshoot. The template works in Microsoft Excel, Google Sheets, and LibreOffice Calc with no macros required.
Looking for more Pro templates?
We offer Pro versions of our most popular spreadsheet templates with advanced features, more capacity, and deeper analysis.