Spreadsheet Guide
Personal Finance Dashboard Spreadsheet
A personal finance dashboard brings everything together - income, spending, savings, debt, and net worth in one view. It is the financial equivalent of a cockpit instrument panel.

In Depth
The Value of a Single Financial View
Financial information is, by nature, fragmented. Bank accounts live in one app, investment accounts in another, loan balances on lender websites, and credit card statements in yet another place. Assembling a complete picture requires logging into multiple platforms and mentally combining disparate numbers. A financial dashboard consolidates all of this into a single view - and the effect of seeing everything together is often more powerful than the sum of seeing each piece separately.
The key metrics that a financial dashboard surfaces - net worth, monthly cash flow, savings rate, and goal progress - are the numbers that matter most for understanding financial health. Income alone does not indicate health; someone earning $150,000 with no savings and growing debt is in a worse position than someone earning $70,000 with a growing net worth. The dashboard makes these distinctions visible by showing the relationships between income, spending, assets, and liabilities in one place.
Regular dashboard updates create a financial check-in rhythm that many people find grounding. A monthly review that takes 20-30 minutes - updating account balances, recording the month's income and expenses, and noting progress toward goals - provides both practical value and psychological benefit. It transforms finances from something that causes background anxiety into something that is actively managed and understood.
Overview
What a Personal Finance Dashboard Does
A personal finance dashboard spreadsheet consolidates all financial data into a single overview. It shows key metrics at a glance: net worth, monthly cash flow, savings rate, debt-to-income ratio, and progress toward financial goals. Instead of logging into multiple bank accounts, investment platforms, and loan portals, the dashboard provides a unified view of financial health. Charts and visual indicators make trends immediately visible.
How It Works
How to Build a Financial Dashboard
Gather all financial account information
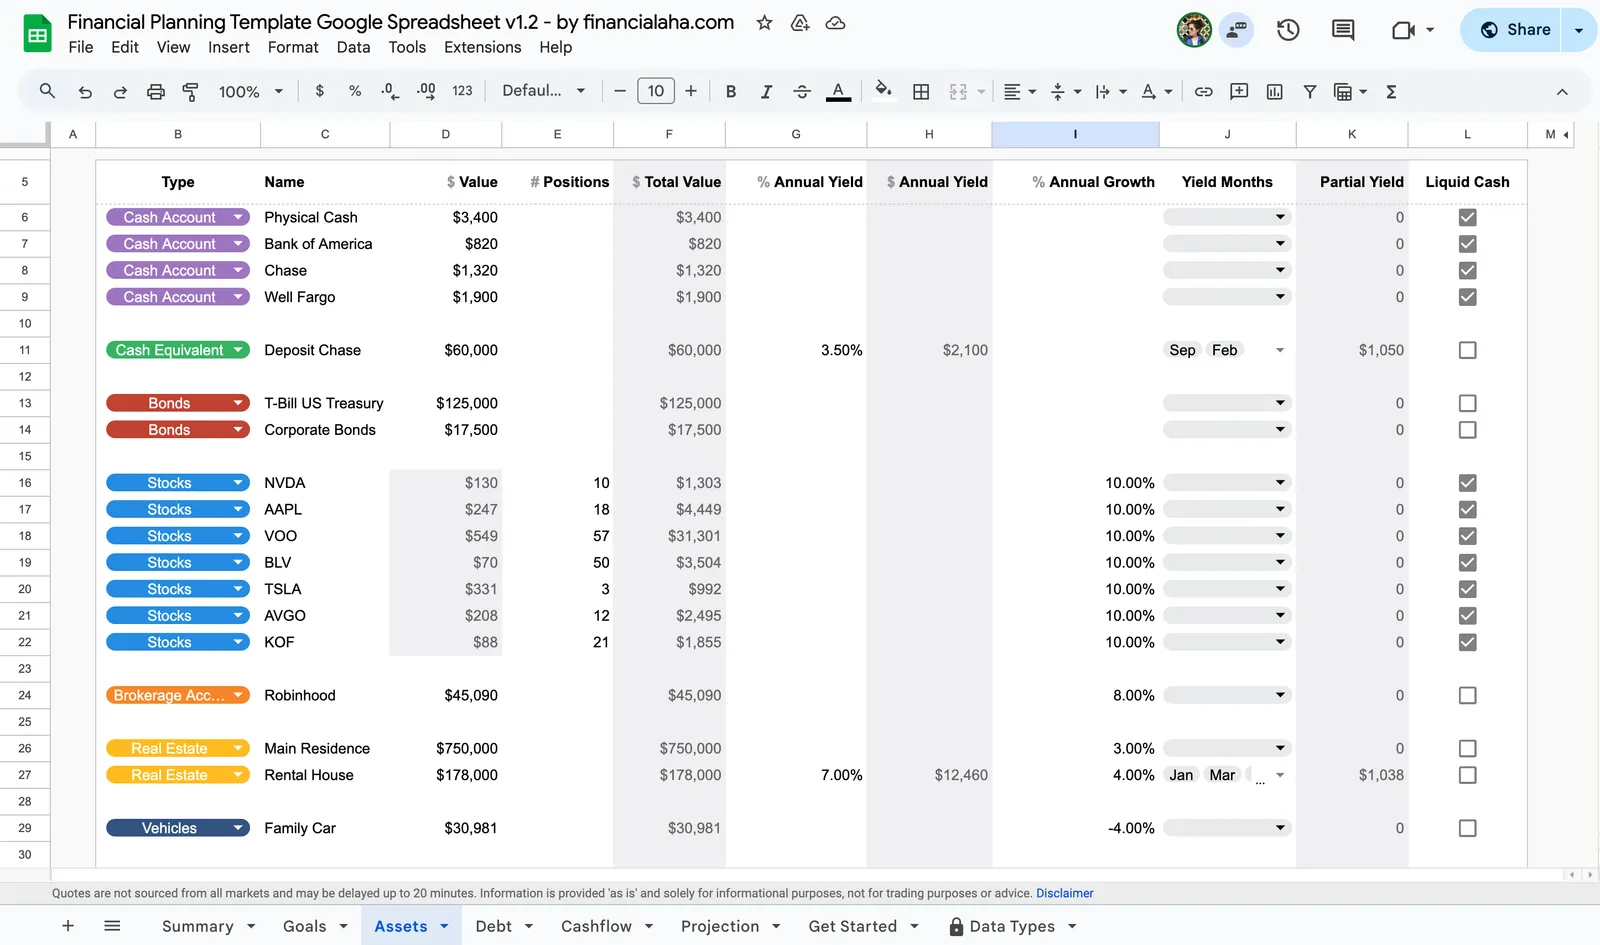
Collect current balances for every account: checking, savings, investments, retirement accounts, real estate equity, and all debts. This complete inventory becomes the foundation of the dashboard. Missing accounts mean an incomplete picture.
Set up key financial metrics
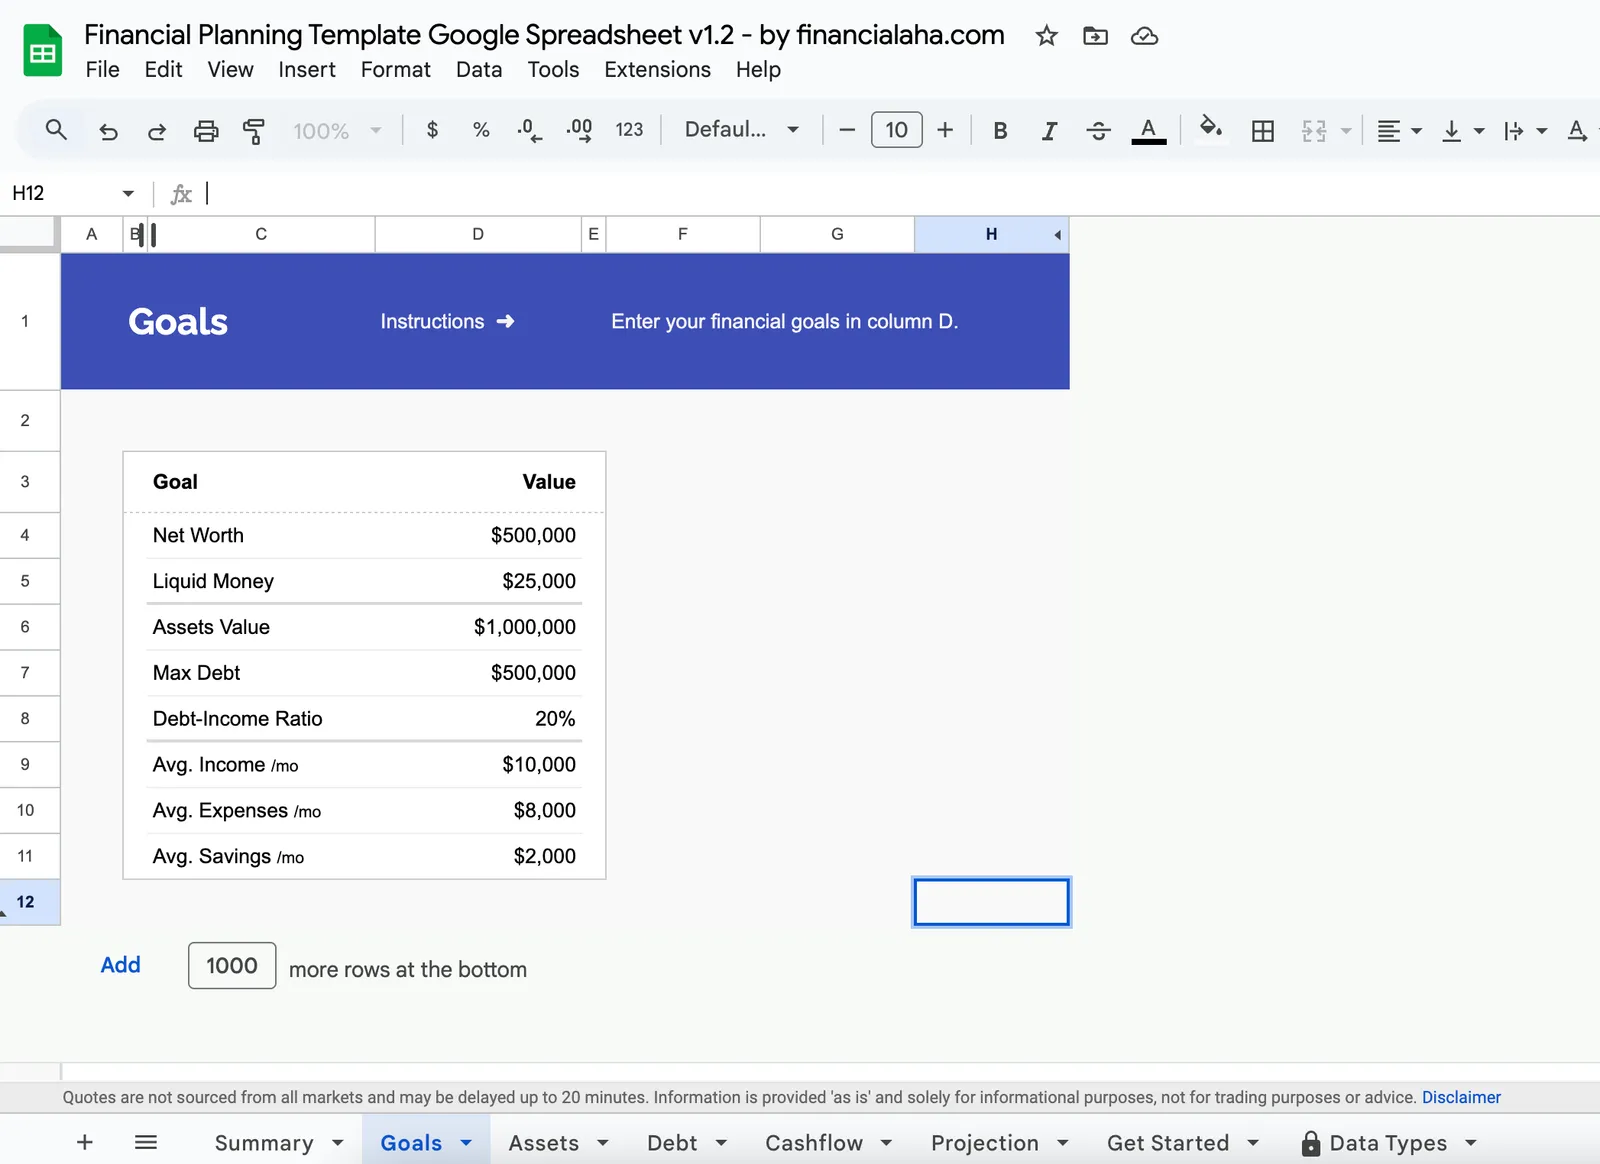
The most useful dashboard metrics include: net worth (assets minus liabilities), monthly cash flow (income minus expenses), savings rate (savings divided by income), and progress toward specific goals. These numbers tell the story of financial health at a glance.
Update regularly with fresh data
A dashboard is only useful if it reflects current reality. Monthly updates (or more frequently for active traders) keep the picture accurate. Many people set a specific day each month as their "financial check-in" day.
Track trends over time
The real power of a dashboard emerges over months and years. Is net worth trending up? Is the savings rate improving? Are debts decreasing? These trend lines are more important than any single snapshot and provide motivation during slow progress periods.
See The Template
A ready-made personal finance dashboard tool
Instead of building from scratch, start with a template that has the structure, formulas, and visuals already in place.
- Pre-built formulas and calculations
- Visual charts and dashboards
- No setup required
- Works in Google Sheets and Excel
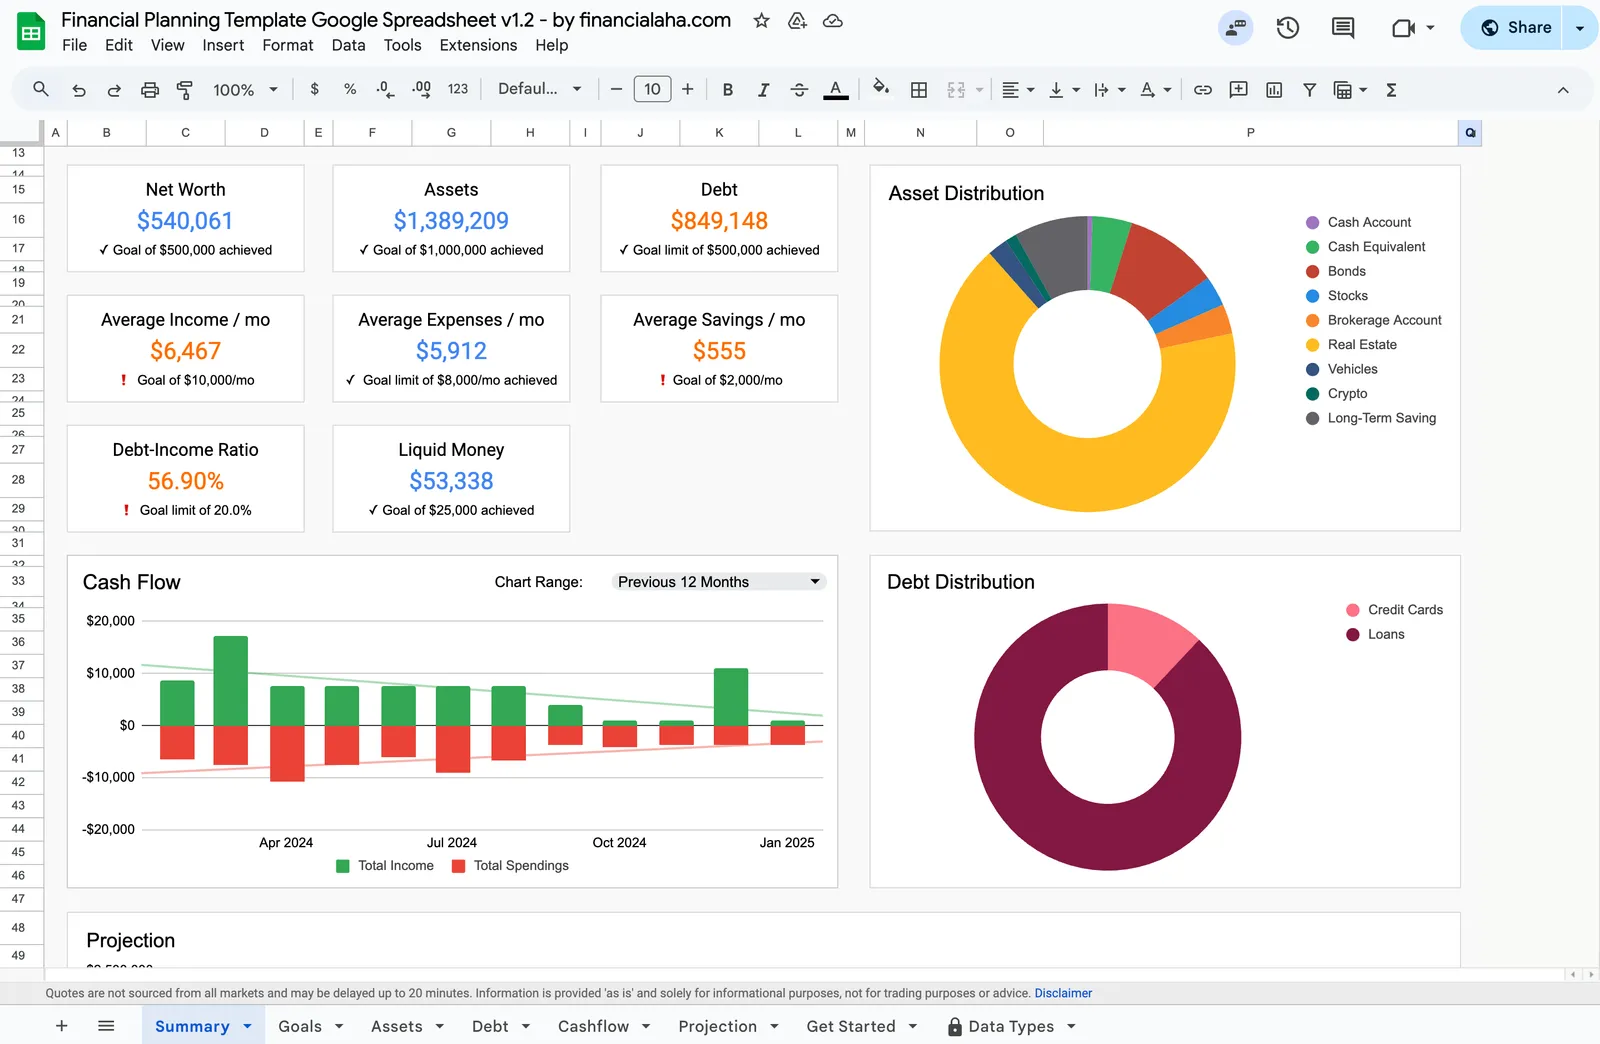
Complete financial overview with net worth and goals
Set and track progress toward financial milestones
Track all your assets in one place
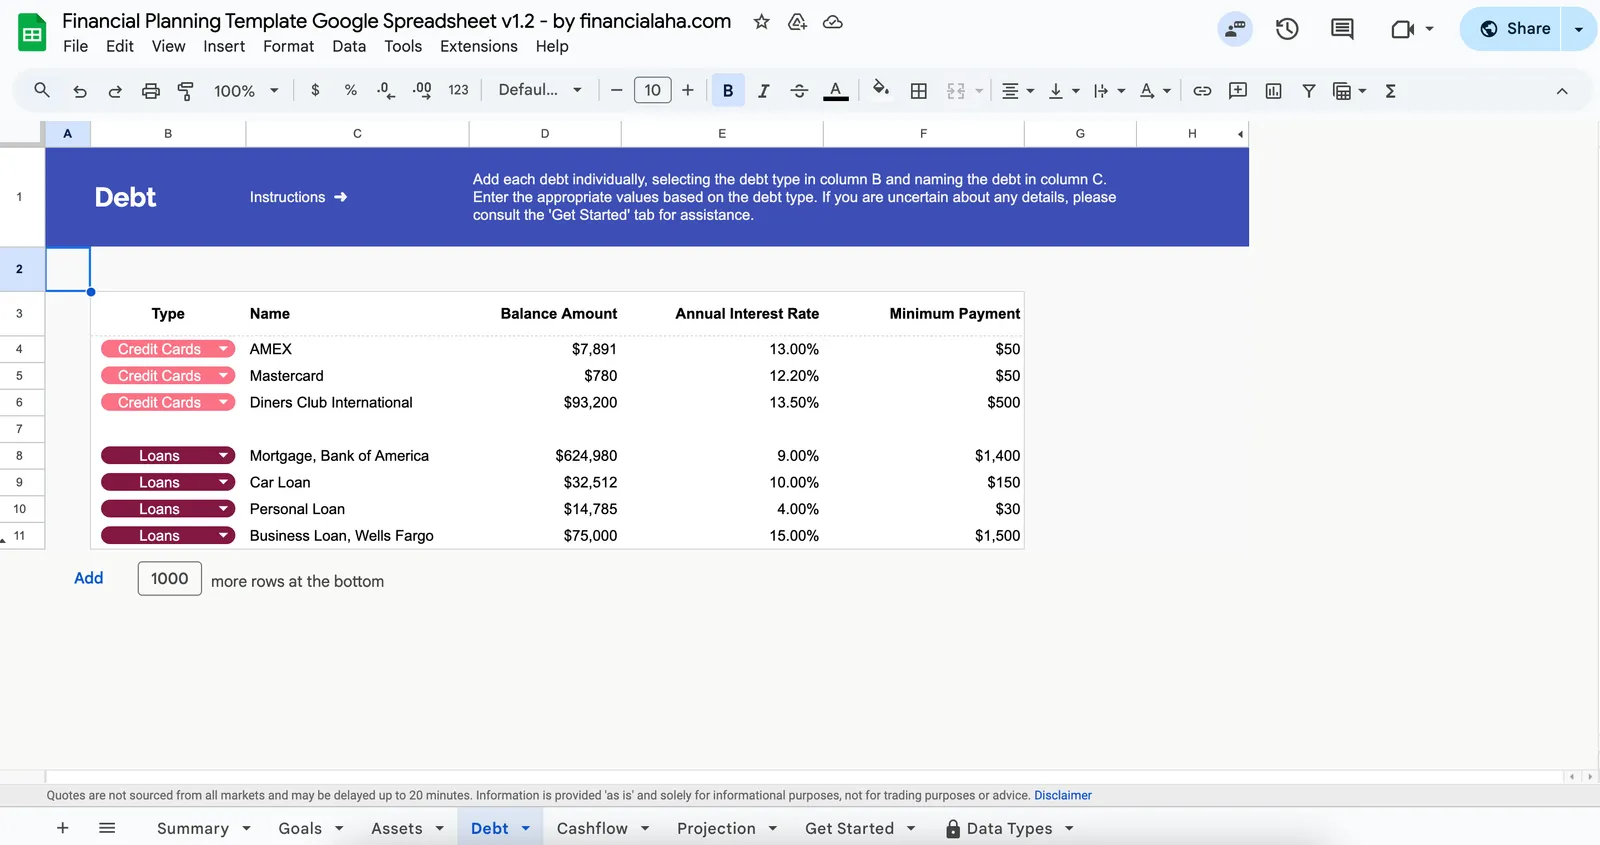
Monitor and plan debt repayment
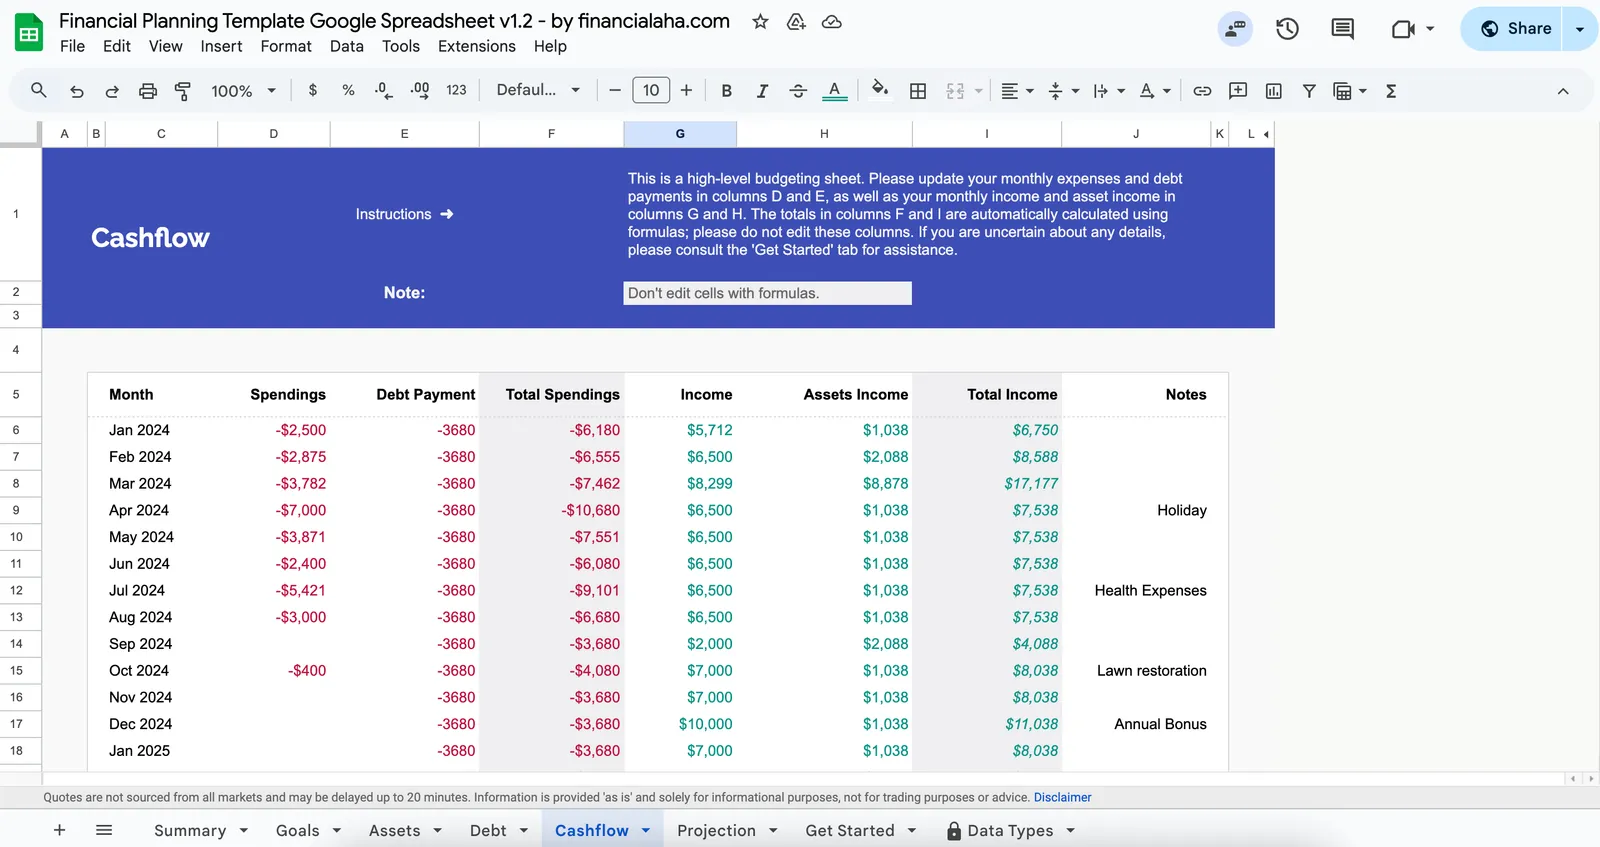
Visualize your income vs spending over time
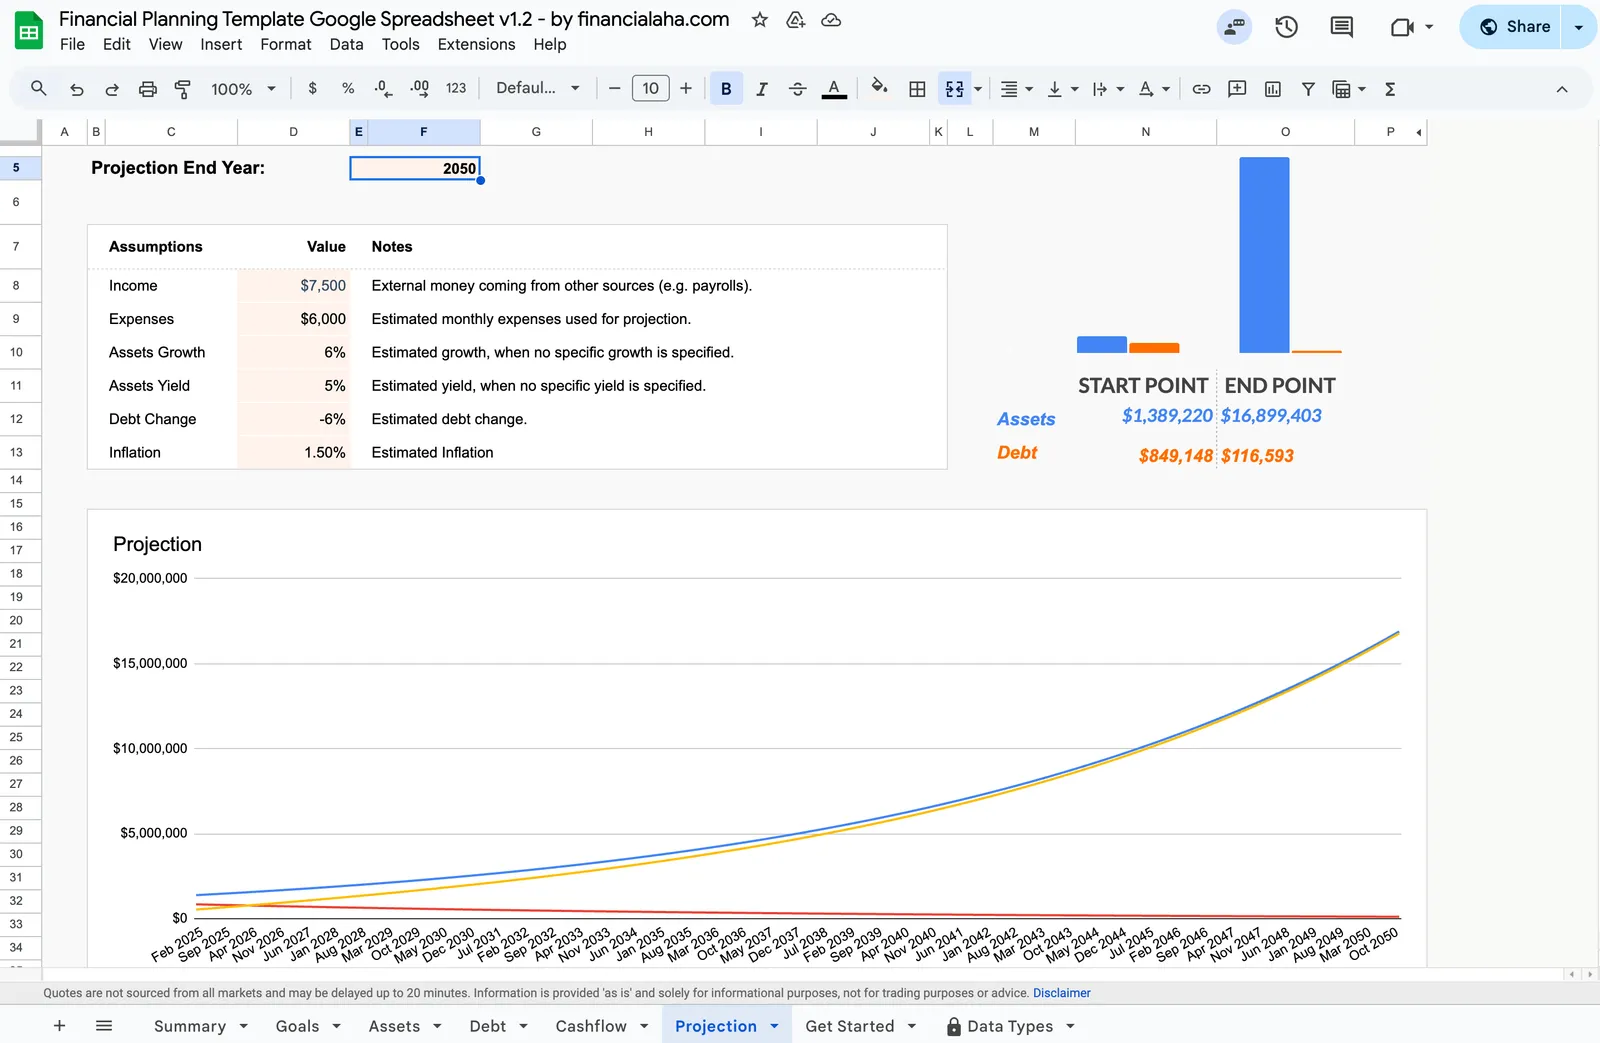
Project your financial future
Get Started
Template for This Use Case
This is a personal finance dashboard - purpose-built as a complete financial overview. Track net worth, assets, debts, cash flow, goals, and projections all in one spreadsheet with automatic calculations and visual charts.
View template Save $91Get the financial dashboard plus every specialized tool - monthly budgeting, expense tracking, annual planning, tax preparation, and retirement projections. The complete financial management system.
Includes 8 templates
View bundleCommon Questions
Personal Finance Dashboard Spreadsheet FAQ
How often should a financial dashboard be updated?
Monthly updates work well for most people. This cadence is frequent enough to catch issues early but not so frequent that it becomes tedious. Some people update net worth monthly and review spending weekly. The update schedule should be sustainable long-term.
What are the most important metrics to track?
Net worth (the single most comprehensive financial health number), savings rate (how much of income is being saved), and cash flow (is spending less than income) are the foundational metrics. Beyond these, tracking specific goals and debt balances provides actionable information.
Is a spreadsheet better than financial apps for dashboards?
Spreadsheets offer more customization and do not require sharing login credentials with third-party services. Apps offer automatic data imports and real-time updates. Some people use both - an app for daily tracking and a spreadsheet for the monthly comprehensive review.
What should a financial dashboard include?
At minimum: all account balances, net worth calculation, monthly income vs. expenses, and progress toward major goals. More detailed dashboards add: investment performance, debt payoff projections, savings rate trends, and cash flow forecasting.
How complex should a personal finance dashboard be?
Start simple and add complexity only as needed. A dashboard that tracks too many metrics becomes overwhelming and often gets abandoned. The version someone actually updates monthly is more valuable than a complex version that gets used once and forgotten.
Can't find the answer you're looking for? Contact our team
Get a ready-made personal finance dashboard spreadsheet
Skip the setup and start with a professionally designed spreadsheet template. All formulas, charts, and tracking built in.
Ready to get started?
Download instantly and start managing your finances, or contact us to design a custom template package for your needs.